 Open Access Article
Highly active Co–Al2O3-based catalysts for CO2 methanation with very low platinum promotion prepared by double flame spray pyrolysis
Miriam
Schubert
a,
Suman
Pokhrel
b,
Andreas
Thomé
c,
Volkmar
Zielasek
ae,
Thorsten M.
Gesing
de,
Frank
Roessner
c,
Lutz
Mädler
be and
Marcus
Bäumer
*ae
aInstitute of Applied and Physical Chemistry, University of Bremen, Germany. E-mail: mbaeumer@uni-bremen.de; Tel: +49 421 218 63170
bFoundation Institute of Materials Science (IWT), Department of Production Engineering, University of Bremen, Germany
cInstitute of Chemistry, Carl v. Ossietzky University of Oldenburg, Germany
dSolid State Chemical Crystallography, Institute of Inorganic Chemistry and Crystallography, University of Bremen, Germany
eMAPEX Center for Materials and Processes, University of Bremen, Germany
First published on 26th August 2016
Abstract
Cobalt-based catalysts are often promoted with noble metals to improve the reducibility of the catalyst and provide a high number of metallic Co sites. The high cost of such noble metals requires new synthetic strategies enabling the use of such promoters at as low concentrations as possible. In this article, we present platinum-promoted Co–Al2O3 catalysts with very small concentrations of platinum (between 0.03 and 0.43 wt%) synthesized by double flame spray pyrolysis (DFSP) as a very versatile preparation technique. Catalysts with Pt contents as low as 0.03 wt% Pt lead to a significant improvement in the reducibility of Co3O4 and to high catalytic activity for the CO2 methanation reaction compared to non-promoted Co–Al2O3. Upon further increasing the Pt content up to 0.43 wt%, only a slight improvement in catalyst reduction and catalytic activity is observed. All prepared catalysts were characterised using XRD, BET, TPR, TEM and EDX followed by catalytic tests for CO2 methanation. Furthermore, two different preparation schemes were used for DFSP, where platinum was combusted either with Co or with the Al precursor solution in one flame, which results in catalysts with a tight chemical contact between Pt and Co3O4 or Pt and Al2O3, respectively. Based on TPR and catalytic tests it could be demonstrated that the deposition of platinum on one or the other oxidic phase has no influence on the reducibility and catalytic performance. The conversion and reducibility were similar for both preparation schemes, an observation which can be explained by H2 spillover during catalyst reduction and catalytic reaction.
Introduction
Since CO2 is a greenhouse gas contributing to global warming, the potential utilization of CO2 as a carbon source for storing chemical energy would represent an attractive future technology. One approach is the “power-to-gas” concept that includes the catalytic conversion of CO2 (obtained from lime kilns or coal-fired power plants) and H2 (generated via electrolysis from excess energy using wind or solar plants) to CH4 for energy storage.1 The CO2 methanation process is a well-known catalytic reaction, e.g. used in industry for the separation of CO and CO2 from hydrogen for ammonia synthesis.2 Different supported catalysts have been investigated for this reaction with Ni or precious metals, with Ru or Rh (ref. 3–11) being the primary focus. While the highest activity is observed for Ru, it is not of practical interest due to its high cost.3,12 The use of Ni as a catalyst is much cheaper compared to Ru or Rh but at the expense of a much lower catalytic activity at low temperatures, i.e. higher temperatures are needed. In addition, the formation of coke and/or catalyst sintering retards the catalytic rate, eventually deactivating the catalysts at higher temperatures.13 To overcome this drawback, new thermally stable catalysts with higher activity at lower temperatures are needed.Bartholomew et al.14 reported the intrinsic activities and selectivities of group VIII metals supported on SiO2 for CO2 hydrogenation. They observed a higher turnover frequency (TOF) and selectivity for Co/SiO2 compared to a nickel catalyst supported on SiO2. The high tendency of cobalt catalysts for methane formation is also known from CO2 Fischer–Tropsch reactions. Yao et al.15 switched the feed gas between CO2 and CO, demonstrating higher methane yields for CO2. The higher methane production was explained by Visconti et al.16 by the lower adsorption rate of CO2 compared to CO, resulting in a higher H2/CO2 ratio on the catalyst surface. Chakrabarti et al.17 studied CO2/CO hydrogenation over CoPt–Al2O3 using 14CO2 and proposed two independent reaction pathways for CO and CO2 conversion so that CO is mainly converted to higher hydrocarbons, whereas CO2 is converted to CH4.
Nevertheless, studies focusing on Co-supported catalysts for the methanation reaction are rare. In the recent literature, the reaction temperature varied between 473 and 673 K, resulting in conversion levels between 30% and 70% and CH4 selectivity up to 90%. Zhou et al.18 reported on Co catalysts supported on mesoporous SiO2 for CO2 methanation leading to moderate CO2 conversions of ∼50% at 573 K. Similarly, Srisawad et al.19 prepared Co–Al2O3 catalysts with different Co precursors and tested them for CO2 methanation at 543 K using unusual CO2/H2 ratios of 1![[thin space (1/6-em)]](https://www.rsc.org/images/entities/char_2009.gif) :
:![[thin space (1/6-em)]](https://www.rsc.org/images/entities/char_2009.gif) 10. They claimed that cobalt nitrate is a good precursor for the formation of active catalysts with conversion rates of 75% and CH4 selectivity of around 80%. Janlamool et al.20 tested Co-supported MCM-41 and found 30% conversion with a selectivity over 90% at 493 K.
10. They claimed that cobalt nitrate is a good precursor for the formation of active catalysts with conversion rates of 75% and CH4 selectivity of around 80%. Janlamool et al.20 tested Co-supported MCM-41 and found 30% conversion with a selectivity over 90% at 493 K.
A major problem of Co-supported catalysts is the interaction between the support and the cobalt oxide phase. On the one hand, the support is required to stabilize the Co particles under reaction conditions. On the other hand, the reduction of Co3O4 to the catalytically active metallic Co is hindered by a too strong metal–support interaction.21 Another problem is the formation of inactive mixed oxides such as CoAl2O4, which affect the catalytic activity.22,23 To overcome this problem, noble metals such as Ru, Re and Pt have been intensively studied as promoters for supported cobalt FT catalysts facilitating the Co3O4 reduction.24,25 In several studies wet chemical preparation techniques, such as incipient wetness or co-impregnation, were employed for the catalyst preparation with platinum contents between 0.1 and 5 wt%.26–31 An increase in the FT activities with the addition of very small amounts of platinum was observed by Schanke et al.28 using 0.4 wt%, Chu at al.31 using 0.2 wt% and Tsubaki et al.29 using 0.1 wt%. A frequent drawback of wet chemical preparation routes is the difficulty in controlling all structural parameters, such as particle size and size distribution. For example, the crystallite size of Co3O4 changes by using an Al2O3 support with different pore sizes.32 Moreover, in the case of promoted catalysts, the distribution of the promoter on the support material is often not easy to control by standard impregnation techniques. In addition, several preparation steps are necessary for the manufacture of multicomponent catalysts.
In contrast, flame spray pyrolysis (FSP) is a well-established aerosol technique for manufacturing homogenous nanoparticles in a single step and in large quantities with good control over different structural parameters.33,34 Here, an organic precursor–solvent combination is dispersed by a gas stream through a nozzle forming a fine spray, which is ignited. In the flame, the precursors evaporate and particles are formed by nucleation.33 FSP has been used for manufacturing a number of supported catalysts, such as Pt/Al2O3, Pt/CeZrO2, and different mixed oxides as well as other metal-supported oxides.35–40 In the case of Al2O3-supported Pt catalysts, the deposited particles were found to be well dispersed on the alumina surface.35 A series of CoOx–Al2O3 nanomaterials with CoOx contents ranging from 0% to 100% were prepared by flame spray pyrolysis and characterised by X-ray fluorescence, BET, TEM, XRD, thermogravimetric analysis (TGA) and FTIR.41 The authors found that this method promotes the formation of a cobalt aluminate spinel phase. In view of catalytic applications, such spinel structures are detrimental.42,43 In our own earlier studies,44 we investigated various CoOx–Al2O3 catalysts prepared by single flame (SFSP) and double flame spray pyrolysis (DFSP) and tested them for the Fischer–Tropsch (FT) reaction. The catalysts obtained from the single flame showed no FT catalytic activity due to the formation of Co aluminates. However, by using two nozzles, independent Co3O4 and Al2O3 nanoparticle aerosol streams were realized. The intersection of the aerosol streams can be adjusted by changing the angle between the two nozzles. For the given geometry, they intersected at a distance of 0.52 m above the flame, leading to the formation of well-mixed but separated Co3O4 and Al2O3 particles. Earlier studies showed that a shorter distance promotes the formation of inactive CoAl2O4 particles and a larger distance leads to the formation of physically mixed particles with low activity.44
In this study, we used the DFSP approach to prepare Pt-promoted Co3O4–Al2O3 catalysts. Our aim was to elucidate the effect of the platinum dopant on the reducibility of Co3O4 and on the catalytic activity for the CO2 methanation reaction. To this end, two different precursor combinations were used to obtain particles with either a tight contact between Pt and Co or between Pt and Al. In the first case, the platinum precursor was mixed with the cobalt precursor and combusted in one flame, while the Al precursor was combusted in the second independent flame (tight Co–Pt contact). In the second case, the platinum precursor was mixed with the Al precursor and combusted in one flame, while the cobalt precursor was combusted in the second flame (tight Al–Pt contact). All other parameters were kept the same as reported by Minnermann et al.44 Our results reveal that DFSP can be successfully applied not only for controlled synthesis of Co3O4–Al2O3 catalysts, but also to achieve high dispersions of noble metal promoters. The tested low contents of platinum, ranging between 0.03 wt% and 0.43 wt%, make the FSP approach economically interesting as a synthesis technique for highly active CO2 methanation catalysts.
Experimental section
Nanoparticle preparation
Double flame spray pyrolysis was used for the production of ultrafine powders of non-promoted and Pt-promoted Co3O4–Al2O3 catalysts. The required amounts of the metal–organic precursors, such as cobalt napthenate (Strem Chemical, 5.96% Co in mineral spirits), and aluminium-tri-sec-butoxide (97% Sigma Aldrich) were separately dissolved in xylene (VWR, 99.9% pure) to obtain concentrations of 0.50 M and 0.11 M by metal, respectively. For the preparation of Pt-promoted catalysts, two different precursor–solvent combinations were used, as shown in Fig. 1. For the preparation of catalysts (80 wt% Al2O3 and 20 wt% Co) with Pt in tight contact with Co3O4, a 50 mL portion of the 0.11 M cobalt naphthenate solution in xylene was mixed with the required amount of Pt acetylacetonate (0.78, 2.58, 5.15 and 13.80 mg for 0.03, 0.08, 0.16 and 0.43 wt% of Pt, respectively) followed by combustion in one flame, while a 50 mL portion of 0.50 M aluminium-tri-sec-butoxide was combusted in the second, independent flame (see Fig. 1, scheme A). Similarly, in the second preparation scheme (Fig. 1, scheme B), a 50 mL portion of the 0.11 M cobalt naphthenate solution in xylene was combusted in one flame and a 50 mL portion of 0.50 M aluminium-tri-sec-butoxide mixed with the required amount of Pt acetylacetonate (0.78, 2.58, 5.15 and 13.80 mg is 0.03, 0.08, 0.16, 0.43 wt% of Pt, respectively) was combusted in the second, independent flame (see Table 1 for the masses used and the resulting concentrations) leading to a tight Pt–Al2O3 contact.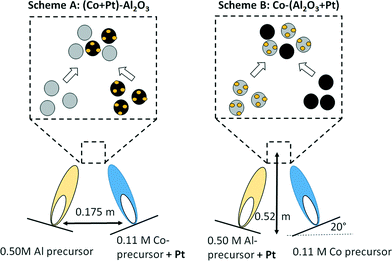 | ||
| Fig. 1 DFSP for the preparation of Pt-promoted Co3O4–Al2O3 catalysts; preparation schema A: Pt in contact with Co3O4 (left); preparation schema B: Pt in contact with Al2O3 (right). | ||
| Catalysts | Solution (50 mL) | Catalyst powders | Calculated concentration of reduced Co–Al2O3 catalysts | |||||
|---|---|---|---|---|---|---|---|---|
| Co solution (0.11 M) | Al solution (0.5 M) | Pt promotion | ||||||
| Co/g | Al/g | Pt/g | Co3O4/g | Al2O3/g | Co3O4/wt% | Co/wt% | Pt/wt% | |
| Co–Al2O3 | 0.3151 | 0.6745 | — | 0.4291 | 1.2745 | 25.2 | 19.8 | 0.00 |
| Co + 0.03% Pt–Al2O3 | 0.3151 | 0.6745 | 0.0004 | 0.4291 | 1.2745 | 25.2 | 19.8 | 0.03 |
| Co + 0.08% Pt–Al2O3 | 0.3151 | 0.6745 | 0.0013 | 0.4291 | 1.2745 | 25.2 | 19.8 | 0.08 |
| Co + 0.16% Pt–Al2O3 | 0.3151 | 0.6745 | 0.0026 | 0.4291 | 1.2745 | 25.2 | 19.8 | 0.16 |
| Co + 0.43% Pt–Al2O3 | 0.3151 | 0.6745 | 0.0069 | 0.4291 | 1.2745 | 25.2 | 19.8 | 0.43 |
| Co–Al2O3 + 0.03% Pt | 0.3151 | 0.6745 | 0.0004 | 0.4291 | 1.2745 | 25.2 | 19.8 | 0.03 |
| Co–Al2O3 + 0.08% Pt | 0.3151 | 0.6745 | 0.0013 | 0.4291 | 1.2745 | 25.2 | 19.8 | 0.08 |
| Co–Al2O3 + 0.16% Pt | 0.3151 | 0.6745 | 0.0026 | 0.4291 | 1.2745 | 25.2 | 19.8 | 0.16 |
| Co–Al2O3 + 0.43% Pt | 0.3151 | 0.6745 | 0.0069 | 0.4291 | 1.2745 | 25.2 | 19.8 | 0.43 |
Catalysts with Pt loadings in the range between 0.03 and 0.43 wt% were synthesized as discussed above, varying the amount of the Pt acetylacetonate. During the DFSP synthesis, the liquid precursors were delivered to the nozzle at a rate of 5 mL min−1 using a syringe pump and were combusted with O2 at a flow rate of 5 L min−1 with a constant pressure drop of 1.5 × 10⁵ Pa at the nozzle tip. The distance between the two nozzles and the angle were 0.175 m and 20°, respectively. The sprays were ignited with a premixed mixture of CH4 and O2 supplied at rates of 1.5 and 3.2 L min−1, respectively. The two aerosol streams met at a distance of 0.52 m above the flame.44 The ultrafine particles were collected from a filter unit with a diameter of 257 mm placed above the flame reactor at a distance of 0.60 m from the nozzle. One catalyst without Pt promotion and 8 catalysts with Pt amounts between 0.03 and 0.43 wt% (from each preparation scheme) were obtained with this method as summarized in Table 1. The amounts of metallic Co and Pt after catalyst activation (i.e. reduction of Co3O4 to metallic Co) were calculated and listed in Table 1.
Brunauer–Emmett–Teller (BET) measurements
BET measurements were carried out using a Quantachrome NOVA 4000e Autosorb gas sorption system. The powders (as prepared) were placed in a test cell and allowed to degas for 2 hours at 473 K under flowing nitrogen. The BET isotherm measurements were performed using nitrogen as an adsorbent at 77 K and relative pressures P/Po in the range of 0.01–0.99. From the plot of [(P/Po)/a(1 − P/Po)] versus [P/Po] in the range between 0.05 and 0.3, a linear correlation was obtained with the correlation coefficient being greater than 0.999. The BET surface area measurement is related to an average equivalent primary particle size, which was calculated using eqn (1).| dBET = 6/(ρ·SA) | (1) |
Here dBET is the average diameter of a spherical monodisperse particle, SA represents the measured surface area of the powder, and ρ is the theoretical density.45
X-Ray diffraction studies
The freshly prepared catalysts were characterized by X-ray diffraction to identify the phases of the catalysts. The non-promoted Co3O4–Al2O3 and a selection of Pt-promoted Co3O4–Al2O3 catalysts were placed in circular sample holders with a diameter of 16 mm which were then loaded into a Bruker D8 diffracting system. The diffractometer was configured in a Bragg–Brentano geometry and equipped with a primary Johansson monochromator producing Cu-Kα1 (λ = 0.1540598 nm) radiation. A 0.1° fixed divergence, 4° primary, 2.5° secondary Soller slits, and a multi-strip LynxEye detector were used. Continuous scans in the range of 15–100° 2θ were applied with an integration step width of 0.0119° 2θ and 5.82 s per step. The XRD patterns of the freshly prepared catalysts were refined using DiffracPlus Topas 4.2 software (Bruker AXS, Karlsruhe, Germany) and the structural and microstructural parameters were extracted using Rietveld refinements. Background, scale factor, unit cell parameters and peak width parameters were simultaneously refined in addition to the Lorentzian crystallite size. For the pattern refinement, the structural models for Al2O3 (ICSD: 28260) with space group Fd![[3 with combining macron]](https://www.rsc.org/images/entities/char_0033_0304.gif) m46 and Co3O4 (ICSD: 28158) with space group Fd
m46 and Co3O4 (ICSD: 28158) with space group Fd![[3 with combining macron]](https://www.rsc.org/images/entities/char_0033_0304.gif) m47 were employed. The instrumental contribution to the peak broadening was taken into account during the full profile fitting using instrumental parameters derived from a fit of standard crystalline LaB6. From the refinement, the wt% Co3O4 and wt% Al2O3 were quantified and compared with the values during synthesis.
m47 were employed. The instrumental contribution to the peak broadening was taken into account during the full profile fitting using instrumental parameters derived from a fit of standard crystalline LaB6. From the refinement, the wt% Co3O4 and wt% Al2O3 were quantified and compared with the values during synthesis.
TEM and EDX investigation
TEM images were obtained with a Tecnai F20 S-TWIN microscope equipped with an EDX detector and a GATAN imaging filter. The GATAN imaging filter and the field emission gun were operated at an acceleration voltage of 200 keV for all measurements. Co–Al2O3 catalysts with 0.43 wt% platinum were analysed by TEM before and after catalysis to investigate the influence of the activation and reaction conditions on the nanoparticle phases and shapes. The STEM mode was used to conduct space-resolved EDX and distinguish between cobalt and aluminium nanoparticles.Temperature programmed reduction
The reducibility of all catalysts was analysed by inverse temperature reduction (iTPR). The iTPR method indirectly detects the consumption of hydrogen analogous to conventional TPR and is patented by Roessner and Schoenen.48 The main difference is the shape of the profile. The signal is inverse to standard TPR (H2 detection with TCD detector), meaning that a decrease in intensity is detected if reduction takes place during the process. For analysis, a powder sample was placed in a quartz tube and exposed to a continuously flowing 5% H2 gas stream at 50 mL min−1 while applying a temperature ramp from room temperature to 1273 K. After passing the sample tube, 2 mL min−1 CO2 was mixed with the outlet stream and passed through a methanizer at 573 K to produce CH4, which in turn was detected by a flame ionization detector (FID). In the absence of reduction, all H2 reacts with CO2 resulting in a steady, high FID signal (baseline). The consumption of H2 during the reduction of the catalysts gives rise to a decreased FID signal resulting in a negative reduction peak.Catalytic testing
CO2 methanation was performed in a U-shaped tube reactor (quartz, internal diameter of 4 mm) with 50 mg of catalysts (sieve fraction of 100–300 μm) diluted with 20 mg of SiO2 (sieve fraction of 100–300 μm). The catalysts were activated at 673 K under flowing hydrogen for 10 h (heating rate 1 K min−1) before starting CO2 methanation experiments. The reaction was carried out at varying temperatures between 473 and 673 K at 1 × 10⁵ Pa and at a CO2![[thin space (1/6-em)]](https://www.rsc.org/images/entities/char_2009.gif) :
:![[thin space (1/6-em)]](https://www.rsc.org/images/entities/char_2009.gif) H2 ratio of 1
H2 ratio of 1![[thin space (1/6-em)]](https://www.rsc.org/images/entities/char_2009.gif) :
:![[thin space (1/6-em)]](https://www.rsc.org/images/entities/char_2009.gif) 4 with a total flow rate of 30 mL min−1. The gases were detected for 30 minutes at each temperature to reach steady state conditions. In order to analyse the product gases, a compact gas chromatograph (Global Analyser Solution) equipped with two different columns and two TCD detectors was used. For the parallel detection of the gases two sample loops were loaded in parallel followed by separating them on a Molsieve 5 Å column (15 m, diameter = 0.32 mm) for the detection of Ar (internal standard), H2, CO and CH4 and a Porabond column (15 m, diameter = 0.32 mm) for analysing Ar (internal standard), H2, CH4 and CO2. Conversion (X) and selectivity (S) were calculated using eqn (2) and (3), where ṅCO2 is the molar flow rate of CO2 before (in) or after (out) catalytic reaction and ṅCH4 and ṅCO are the molar flows of CH4 and CO detected in the product gas stream, respectively.
4 with a total flow rate of 30 mL min−1. The gases were detected for 30 minutes at each temperature to reach steady state conditions. In order to analyse the product gases, a compact gas chromatograph (Global Analyser Solution) equipped with two different columns and two TCD detectors was used. For the parallel detection of the gases two sample loops were loaded in parallel followed by separating them on a Molsieve 5 Å column (15 m, diameter = 0.32 mm) for the detection of Ar (internal standard), H2, CO and CH4 and a Porabond column (15 m, diameter = 0.32 mm) for analysing Ar (internal standard), H2, CH4 and CO2. Conversion (X) and selectivity (S) were calculated using eqn (2) and (3), where ṅCO2 is the molar flow rate of CO2 before (in) or after (out) catalytic reaction and ṅCH4 and ṅCO are the molar flows of CH4 and CO detected in the product gas stream, respectively. | (2) |
 | (3) |
Results and discussion
Primary particle size (dBET), crystallite size (dXRD) and morphology (dTEM)
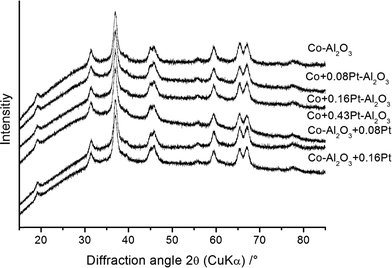
BET measurements were carried out to determine the specific surface area and to calculate the average equivalent primary particle size (dBET). The latter quantity was derived using a theoretical density obtained from the Rietveld refinements and specific surface areas obtained from BET measurements (Table 3). The specific surface areas varied between 114(5) and 157(5) m2 g−1 and the resulting diameters of the spherical particles (dBET) were found to be in the range of 14(1) and 17(1) nm. The freshly prepared Co3O4–Al2O3 catalysts without platinum doping and a selection of platinum-containing Co3O4–Al2O3 catalysts from both preparation schemes were analysed using XRD to quantitatively determine their phases. The results are presented in Fig. 2.All samples, independent of the preparation scheme or platinum content, show the same diffraction pattern with the highest intensity at 37° 2θ, which confirms the formation of the same phases. To obtain more information about the crystal structure, composition, average crystallite sizes and cell parameters, the diffraction patterns were analysed with the Rietveld method using the structural models for Al2O3 (space group Fd![[3 with combining macron]](https://www.rsc.org/images/entities/char_0033_0304.gif) m) and Co3O4 (space group Fd
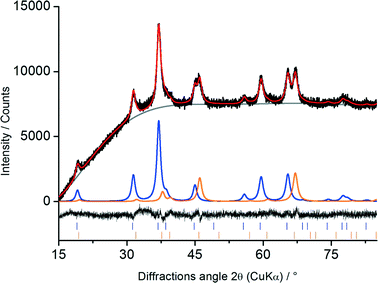
m) and Co3O4 (space group Fd![[3 with combining macron]](https://www.rsc.org/images/entities/char_0033_0304.gif) m). Based on these structural models all observed reflections could be described. Representative Rietveld results for Co–Al2O3 + 0.16% Pt are shown in Fig. 3.
m). Based on these structural models all observed reflections could be described. Representative Rietveld results for Co–Al2O3 + 0.16% Pt are shown in Fig. 3.
The black line shows the measured diffraction pattern while the red line illustrates the intensities calculated using the Rietveld analysis. All diffraction peaks could be indexed as either Co3O4 or Al2O3, shown in blue and orange, respectively.
The unit cell parameters, theoretical densities and calculated compositions are summarised in Table 2 for all samples. The lattice parameters were found to be 808.2(2) pm for Co3O4 and 790.6(2) pm for Al2O3. These values agree well with the published lattice parameters of Co3O4 (808.4 pm (ref. 47)) and Al2O3 (790.6 pm (ref. 46)). The calculated composition was found to be in the range of 21 and 23 wt% Co3O4, agreeing well with the amount used during the synthesis (Table 1).
| Co3O4a/pm | Density/g m−3 | Al2O3a/pm | Density/g m−3 | Co3O4/wt% | |
|---|---|---|---|---|---|
| Co–Al2O3 | 808.2(1) | 6.060 | 790.8(1) | 1.825 | 21(5) |
| CoPt0.08–Al2O3 | 808.0(1) | 6.063 | 790.6(1) | 1.826 | 21(5) |
| CoPt0.16–Al2O3 | 808.2(1) | 6.060 | 790.6(1) | 1.826 | 21(5) |
| CoPt0.43–Al2O3 | 808.4(1) | 6.055 | 790.6(1) | 1.826 | 23(5) |
| Co–Al2O3 + Pt0.08 | 808.1(1) | 6.062 | 790.7(1) | 1.826 | 21(5) |
| Co–Al2O3 + Pt0.16 | 808.2(1) | 6.060 | 790.7(1) | 1.826 | 23(5) |
The calculated average crystallite sizes LVol(IB) of Co3O4 and Al2O3 are listed in Table 3. Crystallite sizes of Co3O4 vary between 6.2 and 6.8 nm, whereas the calculated sizes for Al2O3 are slightly smaller with an average diameter of ∼5 nm. These crystallite sizes differ from the particle sizes calculated from BET (dBET), which indicates the formation of polycrystalline particles.
| Calculated crystallite size LVol(IB) | Surface area/m2 g−1 (fresh) | d BET/nm (fresh) | ||
|---|---|---|---|---|
| Catalyst name | Co3O4/nm | Al2O3/nm | ||
| Co–Al2O3 | 6.8(1) | 4.8(1) | 157(5) | 14(1) |
| Co + 0.03% Pt–Al2O3 | No XRD | No XRD | 114(5) | No XRD |
| Co + 0.08% Pt–Al2O3 | 6.2(1) | 5.2(1) | 130(5) | 17(1) |
| Co + 0.16% Pt–Al2O3 | 6.4(1) | 5.1(1) | 151(5) | 15(1) |
| Co + 0.43% Pt–Al2O3 | 6.5(1) | 5.1(1) | 133(5) | 17(1) |
| Co–Al2O3 + 0.03% Pt | No XRD | No XRD | 138(5) | No XRD |
| Co–Al2O3 + 0.08% Pt | 6.3(1) | 5.1(1) | 132(5) | 17(1) |
| Co–Al2O3 + 0.16% Pt | 6.4(1) | 5.4(1) | 134(5) | 17(1) |
| Co–Al2O3 + 0.43% Pt | No XRD | No XRD | 138(5) | No XRD |
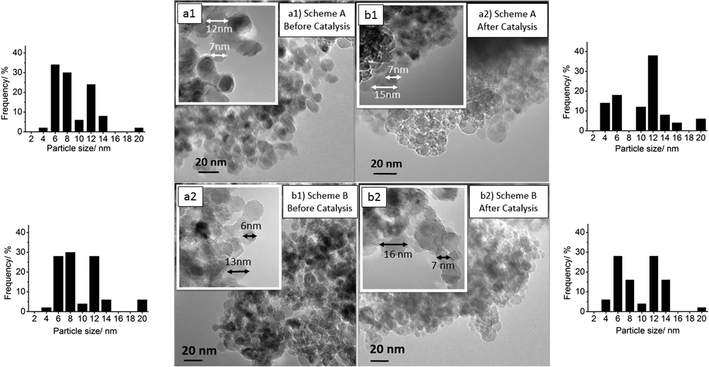
Therefore, the samples were further investigated by TEM and EDX. TEM images at two different magnifications of Pt-promoted Co–Al2O3 catalysts with 0.43 wt% Pt were chosen to determine the particle sizes before and after catalysis. For all 4 samples, the diameters of 50 particles were measured to estimate the particle size distribution. EDX was used to distinguish between Co3O4 and Al2O3 particles. The investigation was conducted for the catalysts (schemes A and B) with the highest Pt concentration because these two samples showed the highest catalytic performance (see below). The TEM image in Fig. 4(a1) reflects the structure and the particle size distribution of a freshly prepared catalyst according to scheme A and the TEM image in (a2) the structure for the preparation according to scheme B. In both cases, the material consists of spherical particles in the range of 5 to 20 nm. Mainly two fractions of particles occur: one fraction of particles with an average size between 6 and 8 nm and a second fraction with diameters between 12 and 14 nm. Only a small amount of the particles was larger than 15 nm. Comparing the particle sizes before and after catalysis clearly demonstrates that no sintering took place under reaction conditions after 210 minutes time on stream, indicating a good thermal stability. Due to the fact that the crystallite sizes of Al2O3 and Co3O4 calculated from XRD were found to be in the range of 5 to 6.5 nm, it can be assumed that the smaller particles are fully crystalline and larger particles consist of polycrystalline particles. Platinum particles could not be detected, suggesting a very fine dispersion with small particles or clusters of a few platinum atoms.
To shed light on the question which of the particles observed by TEM are Co3O4 and which are Al2O3, single particles were analysed using EDX in STEM mode. Fig. 5 shows TEM images and the corresponding STEM images including the areas used for an EDX analysis. For 6 single particles, the Co/Al/O ratios were calculated from the EDX measurements and are listed in Table 4. The values in brackets describe the error of the EDX software for quantitative analysis. All the analysed particles contain oxygen in the range of 56% to 70%. The large particles (no. 5 and 6; ∼15 nm) consist only of oxygen and aluminium, identifying them as Al2O3 particles. Taking the XRD results into account, the data imply that the Al2O3 particles are polycrystalline and consist of smaller Al2O3 crystallites. For the smaller particles (no. 1, 3 and 4) both cobalt and aluminium could be detected by EDX. Yet, based on the fact that the concentration of Al is much lower as compared to Co, the smaller particles are most probably crystalline Co3O4 particles. The Al signal probably results from the surrounding Al2O3 particles.
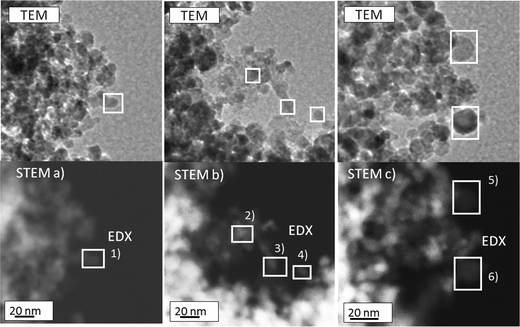 | ||
| Fig. 5 TEM image and the corresponding STEM images for EDX analysis of the prepared Co3O4 + 0.43% Pt–Al2O3 (before catalysis). | ||
| EDX no. | Co/wt% | Al/wt% | O/wt% |
|---|---|---|---|
| 1 | 34(5) | 10(2) | 56(5) |
| 2 | 4(1) | 29(2) | 67(3) |
| 3 | 21(4) | 9(2) | 70(5) |
| 4 | 25(5) | 11(2) | 64(5) |
| 5 | 0(0) | 40(3) | 60(2) |
| 6 | 0(0) | 33(2) | 67(3) |
Platinum could not be detected by EDX so that it was not possible to prove that Pt is in direct contact with either Co3O4 or Al2O3 depending on the preparation scheme. Apparently, the synthesis results in a very fine dispersion of low Pt content. However, it is known from earlier studies of a Pt–TiO2 system prepared by single flame spray pyrolysis (SFSP) that Pt particles are completely formed and deposited on the oxide support already after 0.12 m in the flame.49 Even though for this study a different support material was used, the particle streams meet after approx. 0.52 m so that it can be safely assumed that Pt is deposited on the oxide of the precursor (Co or Al) with which it was combusted in one flame.
Temperature programmed reduction
The reducibility was detected to study and compare the reducibility of Co3O4 for all catalysts. The reduction of Co3O4 takes place via two distinct steps. In the first step, Co3O4 is reduced to CoO and in the second step to metallic Co. The TPR profiles of supported cobalt catalysts are more complex due to interactions between Co3O4 particles and the oxidic support compared to unsupported Co3O4. Thus, oxide–support interactions inhibit the reduction of Co3O4 leading to shifts of the reduction signals to higher temperatures.50–52 With the addition of noble metals such effects can be reduced due to increased availability of hydrogen on the surface.53Fig. 6 shows the TPR profiles for the non-promoted Co3O4–Al2O3 (bottom) and platinum-promoted catalyst (with increasing platinum content from top to bottom) from preparation scheme A, where platinum was sprayed together with cobalt in one flame, hypothesizing that there might be a tighter contact between Pt and Co as compared to that in preparation scheme B.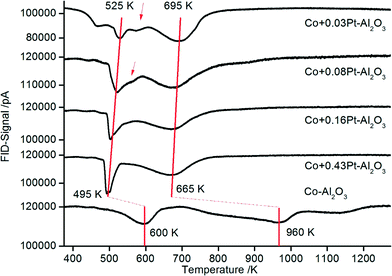 | ||
| Fig. 6 TPR profiles for Co–Al2O3 catalyst without and with 0.03–0.43% platinum prepared according to preparation scheme A with platinum and cobalt in tight contact. | ||
The TPR profile for the non-promoted catalyst (Fig. 7: Co–Al2O3) shows three main signals. The first peak occurring at ∼600 K suggests the reduction of Co3O4 to CoO and the broad peak between 720 and 1000 K the subsequent reduction of CoO to metallic Co. A third shoulder at ∼1150 K is attributed to the reduction of CoAl2O4.54,55 The high intensity of the signal between 720 and 1000 K is an indication of strong interactions between the Al2O3 and the CoO nanoparticles.56 In general, strong metal–support interactions are characteristic of Al2O3-supported Co catalysts.53 On the one hand, such interactions lead to high sintering stability, i.e. very stable Co particles on the support. On the other hand, the reduction of the catalysts is more difficult compared to catalysts with weaker metal–support interaction.
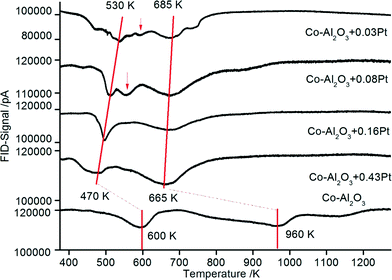 | ||
| Fig. 7 TPR profiles for Co–Al2O3 nanoparticles without and with 0.03–0.43% platinum prepared according to preparation scheme B with platinum and aluminium in tight contact. | ||
Unlike non-promoted Co–Al2O3, the platinum-promoted catalysts show significant TPR shifts to lower temperatures. For a better illustration, the two main reduction steps in the series of different Pt amounts are connected with a red line. The maximum of the high temperature reduction peak, representing the reduction to metallic cobalt, shifts by around 300 K (compared to unpromoted Co–Al2O3) to lower temperatures and reaches a new maximum between 695 and 665 K for the highest platinum loading. The low-temperature reduction peak, which represents the first reduction step to CoO, is also shifted to lower temperatures for the samples with 0.03 and 0.08 wt% Pt to 525 K. However, there is still a small shoulder at ∼575 K (see arrow) in the same range where the first peak was also detected for the non-promoted catalysts, but with increasing platinum content the shoulder at 575 K disappears and the maximum of the low-temperature peak further shifts to 495 K. Thus, the beneficial effect of platinum is clearly demonstrated by TPR. An enhanced reducibility of platinum-containing samples is well known for supported Co3O4 catalysts and is attributed to the high affinity of platinum for H2 activation and a subsequent hydrogen spillover to Co3O4.25,57 Due to the high availability of hydrogen on the surface, the reduction of Co3O4 is enhanced.
Yet, the distinct effect of even very low Pt contents (0.03 wt%) is striking. Usually, Co-catalysts are promoted with platinum contents in the range of 0.5 to 1 wt%. The lowest contents of 0.1 and 0.2 wt% Pt for catalysts prepared by incipient wetness impregnation were reported by Chu et al.31 and Tsubaki et al.29 Such low concentrations reported here for the first time might be economically viable for the industrial large-scale production of such novel catalysts. It can be supposed that the DFSP technique is decisive for the good performance at such low platinum contents. As a result of the atomization in the aerosol stream, Pt can be finely distributed on the Co3O4 or Al2O3 particles, respectively, so that later on – during reduction and reaction – a good accessibility for hydrogen is ensured.49
The TPR data from the catalysts prepared according to scheme B (Pt in tight chemical contact with Al2O3) are depicted in Fig. 7. It can be assumed that the tight contact between the promoter and Co is very important for enhanced catalytic reduction as demonstrated by Nabaho et al.58 These authors prepared three different catalysts by incipient wetness impregnation: (1) a non-promoted Co–Al2O3 catalyst, (2) a chemically (by impregnation) promoted CoPt (0.5 wt%)–Al2O3 catalyst and (3) a 0.5 wt% Pt–Al2O3 catalyst. The non-promoted and chemically promoted CoPt–Al2O3 catalyst and a physical mixture of Pt–Al2O3 and Co–Al2O3 were characterized by TPR. In the first experimental observation, the physically mixed catalyst showed the same TPR profile as a Co–Al2O3 catalyst without platinum. However, after milling the physical mixture of Co–Al2O3 and Pt–Al2O3, the TPR profile shifted to lower temperatures, showing improved reduction as compared to the chemically prepared CoPt–Al2O3 catalyst. From this observation it can be concluded that the direct interaction between cobalt and platinum is not the driving force for Co3O4 reduction, rather a short distance between Pt and Co enables H2 spillover from Pt to Co3O4. Comparing the TPR profiles of the catalysts prepared according to schemes A and B in the present investigation (Fig. 6 and 7), almost the same shifts towards lower temperatures are observed. The peak maxima (also connected with a red line) representing the reduction of CoO to metallic cobalt are detected between 530 and 470 K depending on the platinum content.
The results also show small reduction peaks in the temperature range between 500 and 575 K for the catalysts with 0.03 and 0.08 wt% Pt, respectively. Further increasing the platinum content, however, leads to new peak maxima at a temperature lower than 470 K. In summary, very similar TPR data from platinum-promoted catalysts prepared according to schemes A and B are obtained. This similar reduction behaviour can be explained by hydrogen spillover from Pt (on top of Al2O3) to Co3O4 during the reduction process. The activation and spillover of hydrogen is schematically depicted in Fig. 8 for both structural situations. In the first case, Pt is in tight contact with Co3O4 and hydrogen can directly react with Co3O4 to form Co and H2O. In the second case, where Pt is in tight contact with Al2O3, the activated hydrogen can diffuse on the Al2O3 surface via spillover to Co3O4. Baeza et al. studied the extent of hydrogen spillover on different supports. The extent decreased in the following order: γ-Al2O3 > C > SiO2 > MgSiO3. This was explained by the level of surface acidity or the presence of OH groups.59 As reported by Nabaho et al.,58 a short distance between Pt and Co is necessary to enable the H2 spillover from Pt to Co3O4. A few researchers also reported very large distances for spillover hydrogen on a physical mixed material or on packed beds. For example, Roland et al.60 reported H spillover of over several millimetres on a Pt-zeolite/H-zeolite system at room temperature. Lenz et al.61 studied the spillover distance from PtAl2O3 to SiO2 by NMR and found that H diffused by 12 cm to reach the probe area of the NMR system. The conclusion of the authors was that hydrogen interacts with the surface OH groups as a radical. Nevertheless, in our case the Co3O4 and A2O3 particles prepared by DFSP are well mixed, meaning that each Co3O4 particle is surrounded by several Al2O3 particles. Thus, it can be estimated that the maximal diffusion distance is approx. 10 nm (equal to the Al2O3 particle size). Furthermore, reported hydrogen diffusion coefficients on oxides such as Pt/SiO2 or Al2O3 are in the range of 10−6 cm2 s−1 at 473 K.62 Taking the Einstein relation with x2 = 4Dt into account, where D is the diffusion coefficient, t is the diffusion time and 4 is the coefficient for two-dimensional diffusion, a diffusion distance of around 20![[thin space (1/6-em)]](https://www.rsc.org/images/entities/char_2009.gif) 000 nm s−1 would be possible at a low surface coverage. We cannot completely exclude that Pt migration from Al2O3 to Co3O4 takes place during catalyst activation, but, due to the fact that hydrogen spillover is very fast, the availability of hydrogen is not likely to be limiting for the reduction of Co3O4 independent of the preparation scheme, i.e. even if Pt is located on Al2O3.
000 nm s−1 would be possible at a low surface coverage. We cannot completely exclude that Pt migration from Al2O3 to Co3O4 takes place during catalyst activation, but, due to the fact that hydrogen spillover is very fast, the availability of hydrogen is not likely to be limiting for the reduction of Co3O4 independent of the preparation scheme, i.e. even if Pt is located on Al2O3.
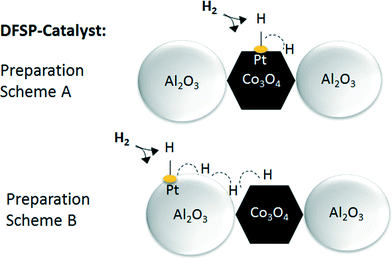 | ||
| Fig. 8 Schematic drawing illustrating the activation and spillover effect occurring on DFSP catalysts with tight contact between Pt and Co or Pt and Al. | ||
Catalytic tests for CO2 methanation reaction
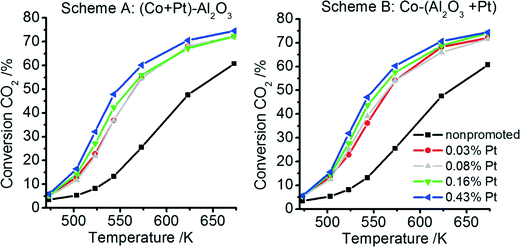
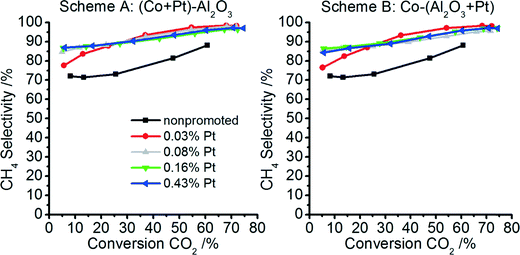
All non-promoted and promoted catalysts were tested for CO2 methanation at different temperatures after activating the catalyst at 673 K under H2 flow for 10 h. The CO2 conversion and CH4 selectivity at different temperatures for catalysts prepared according to schemes A and B are plotted in Fig. 9 and 10, respectively. For all catalysts – non-promoted and promoted catalysts independent of the preparation scheme – the conversion of CO2 increases with increasing temperature. For the non-promoted catalyst, the CO2 conversion rises from 25% at 573 K to ∼60% at 673 K. Already very low Pt contents (0.03 wt% Pt) double the conversion at low temperatures (573 K: ∼55%) and the highest achievable conversion in the studied temperature range increased to ∼70% at 673 K. Upon further increase of the platinum content only slight increases of the CO2 conversion can be observed (5% to 10%). Notably, the CO2 conversion is almost identical for the catalysts prepared according to scheme A or B.The conversion rate is directly related to the amount of available metallic Co sites and the supply of dissociated hydrogen on the surface.63,64 It can be assumed that a higher amount of active Co sites can be formed during activation in the presence of platinum due to a more effective reduction, as revealed by our TPR profiles, where the reducibility was significantly improved for the promoted catalysts independent of the preparation scheme. In addition, more activated hydrogen is available on the surface during catalysis in the presence of platinum, which may also increase the conversion rates. As discussed above, H spillover is fast, explaining why the conversion rates between catalysts prepared by scheme A and B are comparable, independent of whether Pt is deposited on Al2O3 or Co3O4.
The two products obtained during the reaction were CO and CH4 for all samples. The CH4 selectivity is found to increase with increasing CO2 conversion for all catalytically analysed samples (see Fig. 10). The platinum-promoted catalysts show comparable selectivities of between 80% and 98%, whereas the non-promoted sample reaches only 72–88% CH4 selectivity.
Two different mechanisms are discussed for the CO2 methanation reaction in the literature. Lahtinen et al.64 reported a one-step mechanism, where CO2 is dissociated into carbon and oxygen on the catalyst surface. Carbon can then be directly converted with dissociated hydrogen to methane. The rate-limiting step was found to be the removal of surface oxygen. The second mechanism reported is a two-step reaction, where CO2 is first converted to CO in a reverse water gas shift reaction. CO is then converted to CH4.65 Due to the fact that cobalt is not reverse-water-gas-shift active and the RWGS does not take place at temperatures below 400 °C, the one-step mechanism is most likely.66,67 Furthermore, if CO would be an intermediate of CH4, the main product would be CO at low conversion levels. Since CH4 selectivity is approx. 80% at 5% CO2 conversion, it can be assumed that both CO and CH4 are primary products. One possible reaction mechanism is the dissociation of CO2 on the cobalt surface to surface carbon and CO. Surface carbon is then hydrogenated to CH4 and CO can desorb (see Fig. 11).
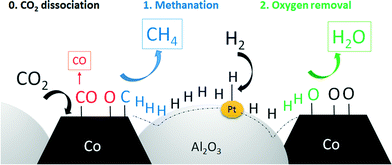 | ||
| Fig. 11 Schematic description of the spillover effect during CO2 methanation on platinum-promoted DFSP catalysts. | ||
Nevertheless, from our results it can be concluded that activated hydrogen has an enhancing effect on the selectivity. A higher amount of hydrogen on the surface may increase the rate of methane formation and the removal of surface oxygen by water formation at the same time. The consequences are higher amounts of CH4 formed, less CO and a higher regeneration rate of Co sites during catalysis.
All catalysts independent of the preparation scheme show a similar behaviour during activation, as demonstrated with TPR, and under catalytic reaction conditions. The exceptional conversion rate for very low Pt quantities (0.03 wt%) and the precise control of catalyst composition, phase and morphology, which was demonstrated by XRD, TPR and catalytic tests, is worth noting. Overall, the results demonstrate that DFSP is a promising preparation technique for precisely adjusted catalysts.
4. Conclusion
In this article, we have presented the properties and catalytic activity of non-promoted and Pt-promoted Co3O4–Al2O3 catalysts prepared by DFSP. In particular, the impact of platinum in the range between 0.03 and 0.43 wt% was studied. For the preparation of catalysts with a tight contact between Pt and Co, platinum and cobalt precursors were mixed and combusted in one flame, while an Al precursor solution was simultaneously combusted in the second flame (scheme A). In the second approach, a solution of platinum and aluminium were mixed and combusted, while the Co precursor solution was combusted in a second flame (scheme B).Our key findings from TPR and catalytic tests are that only 0.03 wt% Pt can significantly increase the reducibility of the catalysts and the methanation rate compared to the non-promoted catalysts independent of the preparation scheme, i.e. deposition of Pt on Co3O4 or Al2O3. The performance of all promoted samples with 0.03 to 0.43 wt% followed the same trend, i.e. increase in reducibility, CO2 conversion and CH4 selectivity upon Pt deposition. Hence, the homogenous distribution of Pt between Al2O3 and Co3O4 particles enables hydrogen spillover from platinum to cobalt and/or Al.
In summary, our results clearly demonstrate the great potential of the double flame spray pyrolysis as a method for catalyst manufacturing.
Acknowledgements
This work was part of the Research Training Group GRK 1860 “Micro-, meso- and macroporous nonmetallic materials: fundamentals and applications” (MIMENIMA) program. We gratefully thank the German Research Foundation (DFG) for financial support.Notes and references
- T. Riedel, Appl. Catal., A, 1999, 186, 201 CrossRef CAS.
- J. M. Thomas and W. J. Thomas, Principles and Practice of Heterogeneouse Catalysis, VCH, Weinheim, 1997 Search PubMed.
- M. Kuśmierz, Catal. Today, 2008, 137, 429–432 CrossRef.
- G. Du, S. Lima, Y. Yangb, C. Wanga, L. Pfefferlea and G. L. Hallera, J. Catal., 2007, 249, 370–379 CrossRef CAS.
- G. D. Weatherbee and C. H. Bartholomew, J. Catal., 1981, 68, 67–76 CrossRef CAS.
- C. K. Vance and C. H. Bartholomew, Appl. Catal., 1983, 7, 169–177 CrossRef CAS.
- Z. Fan, K. Sun, N. Rui, B. Zhao and C.-j. Liu, J. Energy Chem., 2015, 24, 655–659 CrossRef.
- L. Bian, L. Zhang, R. Xia and Z. Li, J. Nat. Gas Sci. Eng., 2015, 27, 1189–1194 CrossRef CAS.
- A. Zamani, R. Ali and W. Abu Bakar, J. Ind. Eng. Chem., 2015, 29, 238–248 CrossRef CAS.
- M. Ding, J. T. Tu, Q. Zhang and M. Wang, Biomass Bioenergy, 2016, 85, 12–17 CrossRef CAS.
- A. Beulsa, C. Swalusa, M. Jacquemina, G. Heyenb, A. Karelovica and P. Ruiza, Appl. Catal., B, 2012, 113, 2–10 CrossRef.
- M. S. Duyar, A. Ramachandran and C. Wan, J. CO2 Util., 2015, 12, 27–33 CrossRef CAS.
- C. H. Bartholomew, Appl. Catal., A, 2001, 212, 17–60 CrossRef CAS.
- G. D. Weatherbee and C. H. Bartholomew, J. Catal., 1984, 87, 352–362 CrossRef CAS.
- Y. Yao, X. Liu, D. Hildebrandt and D. Glasser, Chem. Eng. J., 2012, 193–194, 318–327 CrossRef CAS.
- C. G. Visconti, L. Lietti, E. Tronconi, P. Forzatti, R. Zennaro and E. Finocchio, Appl. Catal., A, 2009, 355, 61–68 CrossRef CAS.
- D. Chakrabarti, A. de Klerk, V. Prasad, M. K. Gnanamani, W. D. Shafer, G. Jacobs, D. E. Sparks and B. H. Davis, Ind. Eng. Chem. Res., 2015, 54, 1189–1196 CrossRef CAS.
- G. Zhou, T. Wu, H. Xie and X. Zheng, Int. J. Hydrogen Energy, 2013, 38, 10012–10018 CrossRef CAS.
- N. Srisawad, W. Chaitree, O. Mekasuwandumrong, A. Shotipruk, B. Jongsomjit and J. Panpranot, React. Kinet., Mech. Catal., 2012, 107, 179–188 CrossRef CAS.
- J. Janlamool, P. Praserthdam and B. Jongsomjit, J. Nat. Gas Chem., 2011, 20, 558–564 CrossRef CAS.
- J. Zhang, J. Chen, J. Ren and Y. Sun, Appl. Catal., A, 2003, 243, 121–133 CrossRef CAS.
- R. L. Chin and D. M. Hercules, J. Phys. Chem., 1982, 86, 360–367 CrossRef CAS.
- W. J. Wang and Y. W. Chen, Appl. Catal., 1991, 77, 223–233 CrossRef CAS.
- B. W. Weckhuysen, Catalysis, 2006, 19, 1–40 Search PubMed.
- M. Minnermann, S. Pokhrel, K. Thiel, R. Henkel, J. Birkenstock, T. Laurus, A. Zargham, J.-I. Flege, V. Zielasek, E. Piskorska-Hommel, J. Falta, L. Mädler and M. Bäumer, J. Phys. Chem. C, 2011, 115, 1302–1310 CAS.
- Z. Zsoldos, T. Hoffer and L. Guczi, J. Phys. Chem., 1991, 95, 798–801 CrossRef CAS.
- S. Vada, A. Hoff, E. Adnanes, D. Schanke and A. Holmen, Top. Catal., 1995, 2, 155–162 CrossRef CAS.
- D. Schanke, S. Vada, E. A. Blekkan, A. M. Hilmen, A. Hoff and A. Holmen, J. Catal., 1995, 156, 85–96 CrossRef CAS.
- N. Tsubaki, S. Sun and K. Fujimoto, J. Catal., 2001, 199, 236–246 CrossRef CAS.
- T. Jermwongratanachai, G. Jacobs, W. Ma, W. D. Shafer, M. K. Gnanamani, P. Gao, B. Kitiyanan, B. H. Davis, J. L. Klettlinger, C. H. Yen, D. C. Cronauer, A. J. Kropf and C. L. Marshall, Appl. Catal., A, 2013, 464–465, 165–180 CrossRef CAS.
- W. Chu, P. A. Chernavskii, L. Gengembre, G. A. Pankina, P. Fongarland and A. Y. Khodakov, J. Catal., 2007, 252, 215–230 CrossRef CAS.
- H. Xiong, Y. Zhang, S. Wang and J. Li, Catal. Commun., 2005, 6, 512–516 CrossRef CAS.
- R. Strobel, A. Baiker and S. E. Pratsinis, Adv. Powder Technol., 2006, 17, 457–480 CrossRef CAS.
- S. Pokhrel, A. E. Nel and L. Mädler, Acc. Chem. Res., 2013, 46, 632–641 CrossRef CAS PubMed.
- R. Strobel, W. J. Stark, L. Mädler, S. E. Pratsinis and A. Baiker, J. Catal., 2003, 213, 296–304 CrossRef CAS.
- W. J. Stark, J. D. Grunwaldt, M. Maciejewski, S. E. Pratsinis and A. Baiker, Chem. Mater., 2005, 17, 3352 CrossRef CAS.
- W. Y. Teoh, R. Amal and L. Mädler, Nanoscale, 2010, 2, 1324–1347 RSC.
- H. Zhang, S. Pokhrel, Z. Ji, H. Meng, X. Wang, S. Lin, C. H. Chang, L. Li, R. Li, B. Sun, M. Wang, Y.-P. Liao, R. Liu, T. Xia, L. Mädler and A. E. Nel, J. Am. Chem. Soc., 2014, 136, 6406–6420 CrossRef CAS PubMed.
- K. D. Kim, S. Pokhrel, Z. Wang, H. Ling, C. Zhou, Z. Liu, M. Hunger, L. Mädler and J. Huang, ACS Catal., 2016, 6, 2372–2381 CrossRef CAS.
- B. Sun, S. Pokhrel, D. R. Dunphy, H. Zhang, Z. Ji, X. Wang, M. Wang, Y.-P. Liao, C. H. Chang, J. Dong, R. Li, L. Mädler, C. J. Brinker, A. E. Nel and T. Xia, ACS Nano, 2015, 9, 9357–9372 CrossRef CAS PubMed.
- J. Azurdia, J. Marchal and R. M. Laine, J. Am. Ceram. Soc., 2006, 89, 2749–2756 CAS.
- A. Y. Khodakov, A. Griboval-Constant, R. Bechara and V. L. Zholobenko, J. Catal., 2002, 206, 230 CrossRef CAS.
- A. Y. Khodakov, J. L. Lynch, D. Bazin, B. Rebours, N. Zanier, B. Moison and P. Chaumette, J. Catal., 1997, 168, 16 CrossRef CAS.
- M. Minnermann, H. K. Grossmann, S. Pokhrel, K. Thiel, H. Hagelin-Weaver, M. Bäumer and L. Mädler, Catal. Today, 2013, 214, 90–99 CrossRef CAS.
- S. Pokhrel, J. Birkenstock, M. Schowalter, A. Rosenauer and L. Mädler, Cryst. Growth Des., 2010, 10, 632–639 CAS.
- K. Shirasuka, H. Yanagida and G. Yamaguchi, Yogyo Kyokaishi, 1976, 84, 610–613 CrossRef CAS.
- W. Smith and A. Hobson, Acta Crystallogr., Sect. B: Struct. Crystallogr. Cryst. Chem., 1973, 29, 362–363 CrossRef CAS.
- F. Roessner and S. Schoenen, Method for the detection of hydrogen, Pat. WO2011134934A1, 2011 Search PubMed.
- H. Schulz, M. Lutz, R. Strobel, R. Jossen and S. E. Pratsinisa, J. Mater. Res., 2005, 20, 2568–2577 CrossRef CAS.
- P. Arnoldy and J. A. Moulijn, J. Catal., 1985, 93, 38–54 CrossRef CAS.
- B. Jongsomjit, J. Panpranot and J. G. Goodwin Jr, J. Catal., 2001, 204, 98–109 CrossRef CAS.
- A. M. Hilmen, D. Schanke and A. Holmen, Catal. Lett., 1996, 38, 143–147 CrossRef CAS.
- M. de Beer, A. Kunene, D. Nabaho, M. Claeys and E. van Steen, J. South. Afr. Inst. Min. Metall., 2014, 114, 157–165 CAS.
- W. K. Jozwiak, E. Szubiakiewicz, J. Góralski, A. Klonkowski and T. Paryjczak, Kinet. Catal., 2004, 45, 247–255 CrossRef CAS.
- G. Melaet, W. T. Ralston, C.-S. Li, S. Alayoglu, K. An, N. Musselwhite, B. Kalkan and G. A. Somorjai, J. Am. Chem. Soc., 2014, 136, 2260–2263 CrossRef CAS PubMed.
- G. Prieto, A. Martínez, P. Concepción and R. Moreno-Tost, J. Catal., 2009, 266, 129–144 CrossRef CAS.
- S. K. Beaumont, S. Alayoglu, C. Specht, W. D. Michalak, V. V. Pushkarev, J. Guo, N. Kruse and G. A. Somorjai, J. Am. Chem. Soc., 2014, 136, 9898 CrossRef CAS PubMed.
- D. Nabaho, J. W. H. Niemantsverdriet, M. Claeys and E. v. Steen, Catal. Today, 2016, 261, 17–27 CrossRef CAS.
- P. Baeza, M. Villarroel, P. Avila, L. A. Agudo, B. Delmon and F. J. Gil-Llambias, Appl. Catal., A, 2006, 304, 109–115 CrossRef CAS.
- U. Roland, H. Winkler and K.-H. Steinberg, in Second Conference of Spillover, Leipniz, 1989, p. 83 Search PubMed.
- D. H. Lenz and W. C. Conner, J. Catal., 1987, 104, 288–298 CrossRef CAS.
- W. Curtis Conner and J. L. Falconer, Chem. Rev., 1995, 95, 759–788 CrossRef.
- G. Fröhlich, U. Kestel, J. Lojewska, T. Lojewski, G. Meyer, M. Voß, D. Borgmann, R. Dziembaj and G. Wedler, Appl. Catal., A, 1996, 134, 1–19 CrossRef.
- J. Lahtinen, T. Anraku and G. A. Somorjai, Catal. Lett., 1994, 25, 241–255 CrossRef CAS.
- G. D. Weatherbee and C. H. Bartholomew, J. Catal., 1982, 77, 460–472 CrossRef CAS.
- B. H. Davis and M. L. Occelli, in Fischer-Tropsch Synthesis, Catalysts and Catalysis, Elsevier, Netherland, 2007, p. 190 Search PubMed.
- J. Gao, Y. Wang, Y. Ping, D. Hu, G. Xu, F. Gu and F. Su, RSC Adv., 2012, 2, 2358–2368 RSC.
| This journal is © The Royal Society of Chemistry 2016 |

