 Open Access Article
Creative Commons Attribution 3.0 Unported Licence
The effect of phosphorus on the catalytic performance of nickel oxide in ethane oxidative dehydrogenation†
Ştefan-Bogdan
Ivan
a,
Ionel
Popescu
a,
Ioana
Fechete
*b,
François
Garin
b,
Vasile I.
Pârvulescu
a and
Ioan-Cezar
Marcu
*a
aLaboratory of Chemical Technology and Catalysis, Department of Organic Chemistry, Biochemistry and Catalysis, Faculty of Chemistry, University of Bucharest, 4-12, Blv. Regina Elisabeta, 030018 Bucharest, Romania. E-mail: ioancezar.marcu@chimie.unibuc.ro
bInstitut de Chimie et Procédés pour l'Energie, l'Environnement et la Santé ICPEES, UMR 7515 CNRS, Université de Strasbourg, 25 rue Becquerel, 67087 Strasbourg Cedex 2, France. E-mail: ifechete@unistra.fr
First published on 25th July 2016
Abstract
Surface-phosphated NiO catalysts with different phosphorus contents were prepared and used for ethane oxidative dehydrogenation (ODH) in the temperature range from 300 to 425 °C. The catalysts were characterized by nitrogen adsorption at −196 °C, XRD, ICP-OES, XPS, TEM, and Raman spectroscopy. They were also characterized by in situ electrical conductivity measurements at various temperatures and oxygen partial pressures, and the temporal response of the electrical conductivity to sequential exposure to air, an ethane–air mixture (reaction mixture) and pure ethane was recorded under conditions similar to those employed in the catalytic experiments. Adding increasing amounts of phosphorus to NiO changes its physicochemical characteristics; specifically, both the concentration and mobility of the surface lattice O− species in the NiO material decrease considerably, affecting its catalytic performance in ethane ODH. Thus, increasing the P content in NiO leads to a decrease in its catalytic activity with an increase in its ODH selectivity at the expense of total oxidation selectivity in the temperature range studied.
1. Introduction
Ethane oxidative dehydrogenation (ODH) is an attractive alternative to conventional ethylene production via steam cracking.1,2 NiO-based catalysts are among the most active and selective catalysts for low-temperature ethane ODH to ethylene.1 The good catalytic performance of NiO in the low-temperature ethane ODH was first reported by Ducarme and Martin.3 Schuurman et al.4 showed that the ethylene oxidation activity of NiO is lower than its ethane oxidation activity, thus explaining its interesting catalytic behavior in ethane ODH and demonstrating the potential of NiO-based systems in this reaction. Heracleous et al.5 studied unpromoted and M-promoted (M = Mo, V, Nb, Ta, Co) alumina-supported NiO catalysts in ethane ODH. Increasing the Ni loading from 8 to 24 wt% increased the ethane conversion without significantly affecting the ethylene selectivity. The structures and ethane ODH catalytic properties of the promoted catalysts were considerably different from those of the unpromoted ones. The Nb-promoted catalyst was found to be the best catalyst; its reactivity toward ethane was more than 50% higher than that of the unpromoted catalyst, and it exhibited high ethylene selectivity. The effect of doping NiO with a series of altervalent cations, such as Li, Mg, Al, Ga, Ti and Nb, on its ethane ODH catalytic properties was also investigated.6,7 It was shown that the catalytic behavior can be controlled by the nature of the dopant. Specifically, increasing the dopant valence state leads to a decrease of the amount of non-selective electrophilic O− species on the NiO surface; a decrease in the number of these species leads to an increase in the ODH selectivity.6,7 Accordingly, the Nb-doped NiO catalyst exhibited the highest catalytic performance with a conversion of ca. 66% and selectivity of 68% at 400 °C. Due to its outstanding ethane ODH performance, several studies have been focused on the Nb–Ni–O catalyst.8–17 The optimal Nb–Ni–O catalyst composition for obtaining the highest ethylene yield was found to be Nb0.15Ni0.85O.8,10 However, this catalytic system deactivates over time on stream due to the formation of the inactive NiNb2O6 phase.10 To find a new highly active, selective and stable NiO-based catalyst, many recent studies were focused on modifying bulk18–28 or supported29–32 NiO with various promoters, including higher valence transition metals, rare earth elements and even main group elements. None of these NiO-based systems exhibited higher catalytic performances in low-temperature ethane ODH than the Nb0.15Ni0.85O catalyst. On the other hand, it has been shown that modifying oxide catalysts with phosphorus improves their ODH catalytic performances, although the specific effect of phosphorus on the catalysis depends on the nature of the oxide catalyst system. For example, Maiti et al. used DFT calculations to show that the presence of phosphorus in surface-phosphated silica and alumina decreases the activation barrier of the ethane ODH rate-limiting step by ca. 10 kcal mol−1.33 When phosphorus was added to Cr/TiO2 catalysts, the Cr3+ ions were isolated in octahedral sites, leading to improved ethane ODH catalytic performances.34 For chromium oxide supported on phosphorus-modified alumina, the interaction between phosphorus and the surface-dispersed chromate species weakened the Cr![[double bond, length as m-dash]](https://www.rsc.org/images/entities/char_e001.gif) O bond and hindered Cr2O3 formation, thus leading to a decrease in the propane conversion and concomitant increase in the propylene selectivity in propane ODH.35 For TiO2-supported V2O5, the interaction between phosphorus and the vanadium species affected the reducibility of vanadium and resulted in higher propene selectivity in propane ODH.36 Both the catalytic activity and ethylene selectivity in ethane ODH were improved by modifying alumina-supported and unsupported MoOx catalysts with vanadium and phosphorus.37,38 For the supported catalyst, the exact role of phosphorus was unclear, but it was proposed that isolated groups of Mo and V oxo species formed on the catalyst.37 For the unsupported MoOx catalyst, the presence of phosphorus might have led to the formation of a [PMo11V] heteropolyanion in which V and P interact more closely, thus leading to a higher catalytic performance.38 Higher propane conversion and enhanced propene selectivity were also observed for P-modified cobalt oxide catalysts compared to pure cobalt oxide in propane ODH.39 The increased catalytic performance of P-modified cobalt oxide catalysts was attributed to their smaller crystallite size and to the presence of highly dispersed phosphate acting as an agent for the isolation of active sites. Adding phosphorus to ceria resulted in a decrease in the alkane conversion and concomitant increase in the selectivity in both isobutane40 and propane41 ODH reactions. The ODH-selective sites were Ce(IV) cations interacting with phosphorus and, therefore, having a lowered redox ability.41,42 Finally, it should be noted that adding phosphorus to a high surface area zirconia-supported NiO catalyst increased both its catalytic activity and ethylene selectivity in ethane ODH.30 The presence of phosphorus enabled the Ni species to remain in an oxidized state during the ODH reaction, i.e. it was not reduced to metallic Ni, as observed for the unpromoted catalyst.
O bond and hindered Cr2O3 formation, thus leading to a decrease in the propane conversion and concomitant increase in the propylene selectivity in propane ODH.35 For TiO2-supported V2O5, the interaction between phosphorus and the vanadium species affected the reducibility of vanadium and resulted in higher propene selectivity in propane ODH.36 Both the catalytic activity and ethylene selectivity in ethane ODH were improved by modifying alumina-supported and unsupported MoOx catalysts with vanadium and phosphorus.37,38 For the supported catalyst, the exact role of phosphorus was unclear, but it was proposed that isolated groups of Mo and V oxo species formed on the catalyst.37 For the unsupported MoOx catalyst, the presence of phosphorus might have led to the formation of a [PMo11V] heteropolyanion in which V and P interact more closely, thus leading to a higher catalytic performance.38 Higher propane conversion and enhanced propene selectivity were also observed for P-modified cobalt oxide catalysts compared to pure cobalt oxide in propane ODH.39 The increased catalytic performance of P-modified cobalt oxide catalysts was attributed to their smaller crystallite size and to the presence of highly dispersed phosphate acting as an agent for the isolation of active sites. Adding phosphorus to ceria resulted in a decrease in the alkane conversion and concomitant increase in the selectivity in both isobutane40 and propane41 ODH reactions. The ODH-selective sites were Ce(IV) cations interacting with phosphorus and, therefore, having a lowered redox ability.41,42 Finally, it should be noted that adding phosphorus to a high surface area zirconia-supported NiO catalyst increased both its catalytic activity and ethylene selectivity in ethane ODH.30 The presence of phosphorus enabled the Ni species to remain in an oxidized state during the ODH reaction, i.e. it was not reduced to metallic Ni, as observed for the unpromoted catalyst.
In this work, the effect of adding phosphorus to bulk NiO surfaces on the catalytic performance of NiO in ethane ODH was investigated and the role of surface phosphorus was unambiguously explained.
2. Experimental part
2.1 Catalyst preparation
Pure NiO was prepared by precipitating a Ni(NO3)2 aqueous solution with NaOH. The obtained hydroxide was separated by centrifugation, washed, dried at 80 °C overnight and then calcined for 5 h in air at 450 °C. Surface-phosphated NiO samples were prepared by adding 3 cm3 of finely ground NiO to 6 cm3 of a NH4H2PO4 solution with a concentration of 0.05, 0.5 or 1.0 M. The resulting suspension was stirred for 1 h and then separated by decantation. The remaining wet solid was dried at 80 °C overnight and finally calcined for 5 h in air at 450 °C. The phosphated samples were labeled 0.05P@NiO, 0.5P@NiO and 1.0P@NiO, respectively. Pure Ni2P2O7 was prepared by precipitating a Ni(NO3)2 aqueous solution with Na4P2O7. The obtained precipitate was separated by centrifugation, washed, dried at 80 °C overnight and then calcined for 5 h in air at 600 °C.2.2. Catalyst characterization
The chemical compositions of the prepared samples were determined by ICP-OES using an Optima 8300 Perkin Elmer spectrometer. Nitrogen adsorption isotherms were recorded at liquid nitrogen temperature on a Micromeritics ASAP 2020 surface area and porosity analyzer. Before analysis, the samples were outgassed under vacuum at 200 °C overnight. Powder X-ray diffraction (XRD) patterns were recorded on a Shimadzu XRD-7000 diffractometer using Cu Kα radiation (λ = 1.5418 Å, 40 kV, 40 mA) at a scanning speed of 2° min−1 over the 2θ range of 10–85°. Raman spectra were recorded at room temperature on a Horiba Jobin Yvon LabRAM HR UV-visible-NIR Raman microscope spectrometer equipped with a DL 785-100 laser. The samples were excited at 633 nm and scanned 5 times in the 100–1200 cm−1 range. The power of the laser used was 17 mW. Transmission electron microscopy (TEM) images were obtained on a TopCon 2100 FCs microscope operated at 200 kV. The samples were dispersed in ethanol in an ultrasonic bath for several minutes, and then deposited on a Cu grid and dried at room temperature. X-ray photoelectron spectroscopy (XPS) measurements were performed on a KRATOS Axis Ultra DLD spectrometer equipped with Al Kα X ray source (1486.6 eV) in a static system at a base pressure of 10−7 Pa. Binding energies were corrected for charge effects by referencing to the C 1s peak at 284.6 eV.2.3. Electrical conductivity measurements
The electrical conductivity measurements were performed on oxide samples compressed at ca. 2.76 × 10⁷ Pa using a Carver 4350.L pellet press to ensure good electrical contacts between the catalyst grains. The obtained pellet was placed in a horizontal quartz tube between two platinum electrodes. The gas flow rates over the sample were controlled by fine needle valves and measured by capillary flow meters. The temperature was controlled using Pt–Rh thermocouples soldered to the electrodes. When short-circuited, they were used to determine the electrical conductivity σ of the samples, which can be calculated using the following formula: | (1) |
To compare the electrical conductivities of the samples, the solids must have similar textures and surface states. Indeed, the electrical conductivity of a semiconducting oxide powder can be expressed by the following equation:
| σ = An | (2) |
The common reference states for determining σ were chosen to be at temperatures of 350 and 400 °C under air at atmospheric pressure. At these temperatures, which are in the range used in the catalytic reactions, most of the ionically adsorbed species, such as H3O+, HO−, etc., that contribute to the surface conductivity were removed from the surface. The solid was initially heated from room temperature to the desired temperature at a heating rate of 5 °C min−1.
2.4. Catalytic tests
Catalytic ethane oxidative dehydrogenation was performed in a fixed bed quartz tube down-flow reactor operated at atmospheric pressure in the temperature range from 300 to 425 °C. The internal diameter of the reactor tube was 18 mm. The catalyst (0.7 g) was supported on quartz wool. The axial temperature profile was measured using an electronic thermometer placed in a thermowell centered in the catalyst bed. The reactor temperature was controlled using a chromel–alumel thermocouple attached to the reactor exterior. The dead volumes on both ends of the catalyst bed were filled with quartz chips to minimize potential gas-phase reactions at higher reaction temperatures. The gas mixture consisted of ethane and air. To determine the catalytic activity as a function of temperature, the W/F ratio and oxygen-to-ethane molar ratio were kept constant at 0.54 g s cm−3 and 1, respectively. To obtain different ethane conversions at 400 °C, the W/F ratio was varied from 0.18 to 1.09 g s cm−3, while the oxygen-to-ethane molar ratio was maintained at 1. Finally, to study the effect of the oxygen-to-ethane molar ratio on the catalytic performance, it was varied from 0.5 to 3 at a constant W/F ratio of 0.54 g s cm−3. Before each activity test, the reactor was heated to the desired temperature while the reactants flowed through it. The system was allowed to equilibrate for approximately 1 h at the reaction temperature before the first product analysis was performed. Each run was conducted over a period of 2–3 hours until two successive product analyses were identical. The reaction products were analyzed using a Clarus 500 gas chromatograph equipped with a thermal conductivity detector (TCD) and two packed columns in series (6 ft Hayesep and 10 ft molecular sieve 5 Å). Ethylene and CO2 were the only products detected under these reaction conditions. For quantitative analysis calibration curves were obtained. The ethane conversion and products selectivities were expressed in mol% on a carbon atom basis. The carbon balances of all the runs were satisfactory; the error margin was within ±2%.3. Results and discussion
3.1. Catalyst characterization
The P contents of the phosphated NiO catalysts determined by ICP-OES are listed in Table 1. As expected, the P content increases as the NH4H2PO4 solution concentration in the surface phosphatation step increases.| Sample | P content (% wt) | BET surface area (m2 g−1) | P/Ni | Surface coverage (%) | Pore volume (cm3 g−1) | Average pore size (nm) | Particle size (nm) | ||
|---|---|---|---|---|---|---|---|---|---|
| ICP | XPS | ICP | XPS | ||||||
| a n.d.: not determined. | |||||||||
| NiO | 0 | 35.1 | 0 | 0 | 0 | 0 | 0.49 | 35.4 | 21.1 |
| 0.05P@NiO | 0.5 | 67.3 | 0.011 | n.d.a | 4 | n.d. | 0.57 | 27.6 | 18.9 |
| 0.5P@NiO | 3.0 | 45.1 | 0.073 | 0.153 | 35 | 61 | 0.33 | 23.1 | 18.5 |
| 1.0P@NiO | 5.7 | 43.0 | 0.146 | 0.227 | 70 | 89 | 0.29 | 20.4 | 19.2 |
The textural properties of the pure NiO and phosphated NiO samples are also presented in Table 1. The surface area increases from 35 to 67 m2 g−1 when P is added to pure NiO to produce 0.05P@NiO. Further increases in the P content lead to a decrease in the surface area, which is consistent with previously reported results;40,41 however, the surface areas of all the phosphated NiO catalysts are higher than that of the pure NiO sample. All the materials exhibit type IV nitrogen adsorption/desorption isotherms, according to the BDDT classification,44 with a type H3 hysteresis loop, which is characteristic of materials with interparticle mesoporosity (Fig. S1†). These results are consistent with the average mesoporous pore sizes obtained from desorption branches of the isotherms by the BJH method (Table 1). Additionally, the average pore size decreases with increasing phosphorus content in the NiO catalyst. Ni2P2O7 has a surface area of 2 m2 g−1.
The surface coverage (Table 1) was calculated as the ratio between the area occupied by all the phosphate groups on the surface of 1 g of the sample and its BET surface area. By virtue of the method of preparation used for adding P to NiO, i.e. impregnation, it was assumed that all the phosphorus is on the catalyst surface as phosphate groups. The area occupied by the phosphate groups was calculated based on the P content determined by ICP-OES analysis (Table 1) and assuming that they have a regular tetrahedral geometry with P–O bond length of 1.536 Å.45 The surface coverage increases from 4% for 0.05P@NiO sample to 70% for 1.0P@NiO and the bulk P/Ni atomic ratios are 0.011, 0.073 and 0.146 for 0.05P@NiO, 0.5P@NiO and 1.0P@NiO, respectively. The surface coverage and the P/Ni atomic ratios calculated from XPS results are larger than those calculated based on the bulk P content determined by ICP-OES, clearly showing that P is concentrated at the catalyst surface.
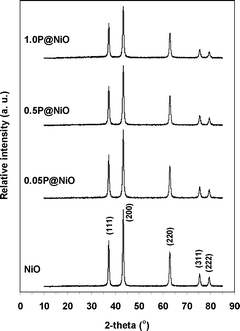
The XRD patterns of the pure NiO and surface-phosphated NiO samples are presented in Fig. 1. For all the samples, only reflections corresponding to the well-crystallized NiO phase (PDF 47-1049) are observed (peaks corresponding to P-containing phases are not detected), indicating a high degree of phosphorous dispersion on the NiO surface. The Ni metal reflection peaks at 44.6° and 51.9° are not observed. The particle size was estimated by applying the Scherrer formula to all the diffraction lines in the 2θ range of 10–85° (Table 1). The pure NiO particle size is larger than the phosphated NiO particle sizes, which is consistent with the measured surface areas. Nevertheless, the phosphated NiO particle size does not exhibit a clear dependence on the surface area, suggesting that the NiO particles agglomerate to different degrees in the presence of phosphorous. Ni2P2O7 is a highly crystalline pure phase (PDF 72-8424) (Fig. S2†).
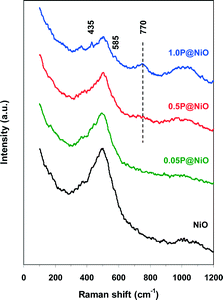
The Raman spectra of both pure NiO and phosphated NiO samples were recorded to identify the surface phosphorus species. The results are presented in Fig. 2. A broad, intense band near 500 cm−1 and a weak band near 1000 cm−1 are observed in the pure NiO Raman spectrum and are attributed to the Ni–O stretching mode.46,47 Notably, the shoulder of the 500 cm−1 band clearly indicates the non-stoichiometry of nickel oxide.47 These peaks are also observed in all the phosphated NiO samples, but the intensity of the 500 cm−1 peak, which is assigned to the NiO6 octahedra stretching mode, decreases with increasing P content in the NiO catalyst. This result clearly indicates that P interacts with NiO. The 1000 cm−1 band intensity increases with increasing P content in the phosphated samples, suggesting the presence of PO43− groups on the NiO surface. Indeed, the symmetric and asymmetric P–O stretching modes of the free PO43− oxoanion are located at 938 and 1027 cm−1, respectively, and the stretching modes of the surface PO43− groups are expected to have similar frequencies.48 The weak peaks at 435 and 585 cm−1 observed in the 1.0P@NiO spectrum can be assigned to O–P–O symmetric and antisymmetric bending modes, respectively, with a small P vibrational contribution.46 A new band near 770 cm−1 is observed in the 0.5P@NiO and 1.0P@NiO spectra and is more intense in the latter spectrum. This band is attributed to the symmetric stretching mode of P–O–P bridges, which is the fingerprint of P2O74− oxoanions formed from connected PO43− groups.49,50 This result clearly suggests that pyrophosphate groups are present on the NiO surface at higher P contents.
HRTEM images of the catalysts are presented in Fig. 3. NiO lattice fringes are visible on all the grains of bare NiO sample. The TEM images of the P@NiO samples are similar, no phosphate clusters being evidenced even at high P content. This clearly suggests that P is well dispersed on the NiO surface, in line with Raman and XRD data. The NiO lattice fringes are not visible on all the particles in phosphated samples, probably due to the surface coverage with phosphate groups which determine the delimitation of surface NiO domains.
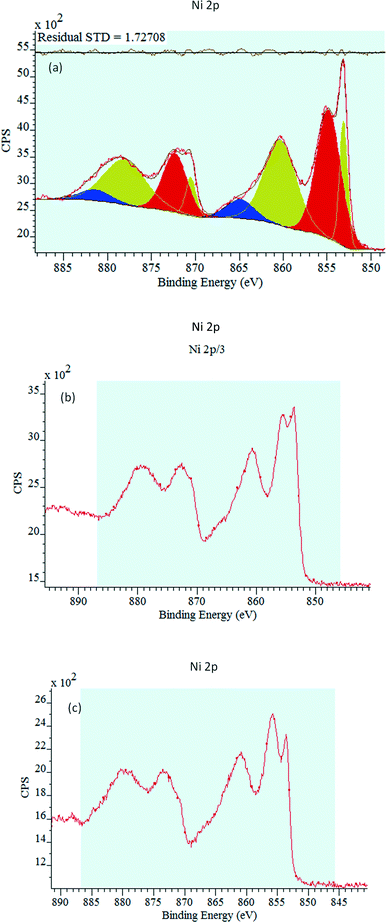
The bare NiO, 0.5P@NiO and 1P@NiO catalysts were analyzed by photoelectron spectroscopy. For each sample, the C 1s, O 1s, Ni 2p and P 2p internal electronic levels were measured. The characteristic Ni 2p3/2 spectra of the catalysts are presented in Fig. 4. Due to the presence of several crystalline domains with different surface charge effects, the XPS peaks of all the samples exhibit complex behavior. The corresponding Ni 2p3/2 binding energies (BEs) are compiled in Table 2. For all the catalysts, two Ni 2p3/2 core-level binding energies are observed, and these energies are very similar, regardless of the P loading. The Ni 2p3/2 binding energies of the 0.5P@NiO and 1.0P@NiO samples are higher than those of the NiO sample. The first BE is approximately 853.2 eV for NiO and 853.6 eV for 0.5P@NiO and 1.0P@NiO, and the second BE is 854.9 eV for NiO and 855.6 eV for 0.5P@NiO and 1.0P@NiO. The observed binding energies can be attributed to Ni2+ (NiO)32,51,52 and Ni2+/Ni3+ (Ni2O3) ions.53–55 These results indicate that two nickel species coexist on the surfaces of the three samples. The Ni2+ peaks of NiO and 0.5P@NiO are more intense than that of 1.0P@NiO. It is interesting to note that the origin of the signal corresponding to Ni3+ can be associated with the Ni atoms with pyramidal Ni symmetries.25,56–58 In same time this peak can be attributed to the Ni2+ species59 or to lattice distortions induced by the presence of Ni2+ vacancies,60,61 or due to Ni2+−OH species.53 However, the controversies remain about the attribution of this peak.62–64 For all the samples, a shake-up satellite peak that is ca. 9–10 eV higher in energy than the main peak is observed at around 863.0 eV. This peak due of multielectron excitation is characteristic of Ni2+ ions in a network of Ni(OH)2,65,66 and its shape (distribution of final molecular states) depends on the P loading, indicating different types of surface interactions. It is interesting to note that the Ni3+ content is higher in the phosphate samples, compared to bare NiO, and increases with P content.
| NiO | 0.5P@NiO | 1.0P@NiO | ||
|---|---|---|---|---|
| B. E. (eV) | B. E. (eV) | B. E. (eV) | ||
| Ni 2p3/2 | Ni2+ | 853.2 (80%) | 853.6 (54%) | 853.6 (23%) |
| Ni3+ | 854.8 (20%) | 855.5 (46%) | 855.6 (77%) | |
| P 2p3/2 | (PO4)3−/(P2O7)4− | — | 133.2 | 133.2 |
| O 1s | NiO | 528.8 (74%) | 529.0 (41%) | 529.0 (33%) |
| Ni2O3 | 530.6 (26%) | 530.8 (52%) | 531.0 (59%) | |
| H2O | — | 532.7 (7%) | 532.7 (8%) | |
| C 1s | C–C/C–H | 284.6 (70%) | 284.6 (47%) | 284.6 (59%) |
| C–O | — | 286.1 (37%) | 286.8 (24%) | |
| COOH/carbonate | 288.1 (30%) | 289.0 (16%) | 289.5 (17%) | |
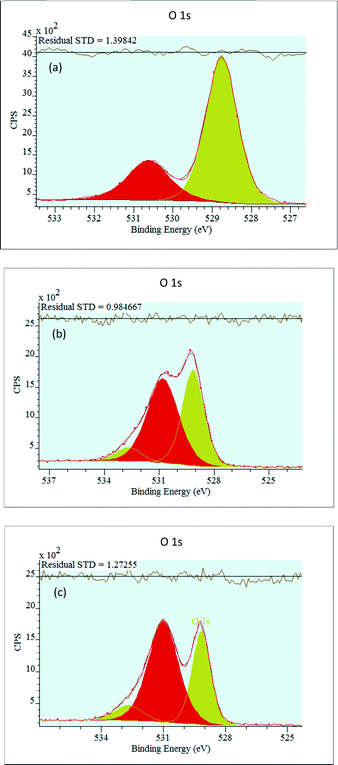
The characteristic O 1s XPS spectra of the catalysts are shown in Fig. 5.
For all the samples, the NiO O 1s spectrum exhibits two peaks, an intense peak at around 529 eV and a weak peak at around 530 eV (Table 2). The lower binding energy, is attributed to the O2− lattice oxygen bounded to Ni2+ in NiO particles.62,67,68 The higher binding energy is assigned to O2− lattice oxygen bounded to Ni3+ but can be ascribed to oxygen from hydroxyl group bounded to nickel or phosphorous62,69 or oxygen from carbonates as observed in the C 1s XPS spectra at around 288 eV. The intensity of the oxygen bounded to Ni2+ peak decreases, and the intensity of the oxygen bounded to Ni3+ peak increases with increasing P content. For the samples containing P, a small peak corresponding to adsorbed water molecules appears at ca. 532.7 eV.
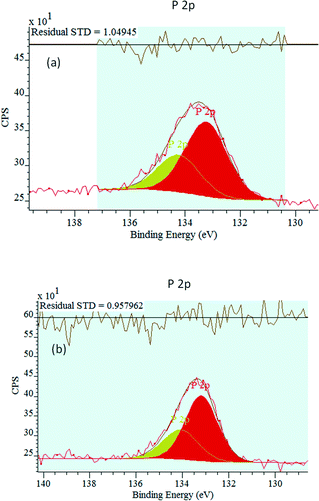
The P 2p XPS spectra are presented in Fig. 6. A P 2p peak is observed for the two phosphated catalysts, providing evidence that they contain surface P. The P 2p peak intensity increases with the P loading. For the two phosphated catalysts, the main P 2p binding energy is 133.2 eV. This peak is attributed to phosphate/pyrophosphate groups, revealing the phosphorus binding state.70
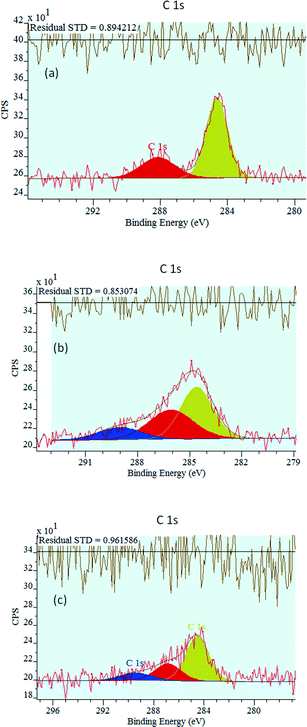
The XPS analysis of the catalysts also provides deeper insight into the type of carbon deposited on the surface. The C 1s core-level spectra of the calcined catalysts are shown in Fig. 7. The main C 1s peaks were deconvoluted into two subpeaks for the NiO catalyst (284.6 and 288.1 eV) and three subpeaks for the 0.5P@NiO (284.6, 286.1, 289.0 eV) and 1P@NiO (284.6, 286.8, 289.5 eV) catalysts to reveal the carbon chemical states on the catalyst surfaces. For all the catalysts, the main C 1s peak is centered at 284.6 eV and can be attributed to graphitized sp2 carbon or adventitious carbon.70 The C 1s peak at 284.6 eV can also be attributed to aliphatic C–H species. The 286.1 and 286.8 eV BEs are assigned to carbon atoms bound to phosphate groups,71 although these peaks can also be attributed to the C 1s BEs of organic species.72 The C 1s peaks at 288.1, 289 and 289.5 eV can be assigned to C–O bonds,73i.e., these peaks are associated with the presence of carbonate groups on the catalyst surfaces. However, the concentration of these species is lower than those of other species.
Moreover, taking into consideration that before each activity test the reactor was heated to the desired temperature in the reaction mixture flow and the system was allowed to equilibrate for ca. 1 h before the first product analysis was performed, these C-containing surface contaminants are obviously removed from the catalyst surface and, therefore, they have no influence on the catalytic performances.
3.2. Catalytic tests
The NiO and phosphated NiO catalytic performances in ethane oxidative dehydrogenation are presented in Fig. 8.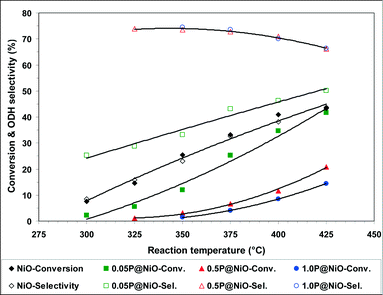 | ||
| Fig. 8 Ethane conversion and ethylene selectivity vs. reaction temperature in ethane ODH over bare NiO and phosphated NiO catalysts. | ||
For all the catalysts, the ethane conversion increases with increasing reaction temperature. At the same time, the ethylene selectivities of the 1.0P@NiO and 0.5P@NiO catalysts decrease to the benefit of carbon oxide selectivities. In contrast, the opposite trends in the selectivities are observed with increasing reaction temperature for the NiO and 0.05P@NiO catalysts. The increase in the ethylene selectivity with increasing reaction temperature was previously observed for bulk NiO (ref. 3, 4, 28) and high surface area MgO-supported NiO catalysts32 and might be due to the higher ethylene formation rate compared to its oxidation rate4,32 on these catalysts. The similar behavior of bare NiO and 0.05P@NiO catalysts is obviously due to the low surface coverage with phosphate groups of the latter (Table 1), 96% of its surface being that of NiO. On the other hand, increasing the phosphorus content in the NiO catalyst leads to a decrease in its catalytic activity both in terms of conversion and intrinsic ethane transformation rate (Table 2). Moreover, the bare NiO and 0.05P@NiO catalysts are active from 300 °C, but the temperature at which the reaction proceeds over the phosphated NiO catalysts increases with increasing P content. At the same time, the ethylene selectivity increases, whereas the total oxidation selectivity decreases when the phosphorus content in the NiO catalyst is increased up to 3.0 wt%. Above this P content, the selectivities reach a plateau. Thus, for the 0.5P@NiO and 1.0P@NiO catalysts, the ethylene selectivity is nearly identical over the entire reaction temperature range studied and is much higher than that of pure NiO. These results clearly suggest that phosphorus lowers the surface density of non-selective active sites on the NiO catalysts.
Notably, over pure Ni2P2O7 the reaction proceeds at temperatures higher than 550 °C (Table S1†) with only very low conversion levels. This clearly suggests that surface phosphate and pyrophosphate species in the phosphated NiO catalysts are inactive in the low-temperature ethane ODH, their role being indeed to diminish the density of non-selective active sites.
According to these catalytic data, most of non-selective active sites are eliminated from the catalyst surface at a coverage with phosphate groups of ca. 35% corresponding to 0.5P@NiO catalyst. Further increasing of surface coverage to 70% for 1.0P@NiO catalyst leads to the formation of pyrophosphate groups, in line with Raman data, and probably decreases the area of surface NiO domains evidenced by TEM, with, therefore, a decrease of the catalytic activity. It is worth noting that the formation of these surface NiO domains by adding P to NiO and by increasing its content is similar to the catalytic site isolation responsible for lower catalytic activity with concomitant increased selectivity.74
The apparent activation energies for ethane transformation over the phosphated NiO catalysts were calculated based on the Arrhenius equation using conversions lower than ca. 10%. For NiO, the linear part of the Arrhenius plot in Fig. S3† was considered to avoid diffusion limitations. The calculated activation energies are listed in Table 3. The apparent activation energy for ethane conversion over the NiO catalysts increases with increasing phosphorus content, indicating that the catalytic sites are less reactive in the presence of phosphorus.
| Catalyst | Reaction temperature (°C) | Intrinsic rate (108 mol m−2 s−1) | Activation energy (kJ mol−1) |
|---|---|---|---|
| NiO | 350 | 9.1 | 72 |
| 400 | 14.6 | ||
| 0.05P@NiO | 350 | 2.2 | 100 |
| 400 | 6.5 | ||
| 0.5P@NiO | 350 | 0.9 | 110 |
| 400 | 3.2 | ||
| 1.0P@NiO | 350 | 0.4 | 122 |
| 400 | 2.5 |
The effects of the conversion on the ODH selectivities of the 0.5P@NiO and 1.0P@NiO catalysts, the most selective in the series, were investigated by varying the W/F ratio from 0.18 to 1.09 g s cm−3. The reactions were performed at 400 °C using an oxygen-to-ethane molar ratio of 1, and the results are shown in Fig. 9. For both catalysts, the ODH selectivity decreases with increasing conversion. This effect is more pronounced for the 0.5P@NiO catalyst; thus, at conversions below ca. 20%, it is slightly more selective than the 1.0P@NiO catalyst, whereas at higher conversions, it becomes less selective than 1.0P@NiO. Extrapolation to zero conversion gives ODH selectivities of ca. 78 and 72% for the 0.5P@NiO and 1.0P@NiO catalysts, respectively, indicating that the carbon dioxide selectivities are non-zero. This result suggests that in addition to ethylene, carbon dioxide is a primary product that forms via parallel ethane combustion reactions over both phosphated NiO catalysts. This means that the non-selective active sites still exist in the surface NiO domains responsible for the catalytic activity of phosphated catalysts.
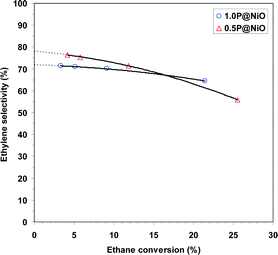 | ||
| Fig. 9 Effect of ethane conversion on the ODH selectivity in the oxidative dehydrogenation of ethane over 0.5P@NiO and 1.0P@NiO catalysts at 400 °C (oxygen-to-ethane molar ratio = 1). | ||
The effect of the oxygen-to-ethane molar ratio on ethane oxidative dehydrogenation over the 0.5P@NiO catalyst was investigated at 400 °C and a W/F ratio of 0.54 g s cm−3, and the results are presented in Fig. 10. The ethane conversion increases from 8.6 to 17.2% when the oxygen-to-ethane molar ratio is increased from 0.5 to 3. At the same time, the ethylene selectivity decreases from 77.8 to 63.3% as the carbon dioxide selectivity increases, which is typical for ODH reactions. These results can be explained by an increase in the available oxygen when the oxygen-to-ethane molar ratio is increased.
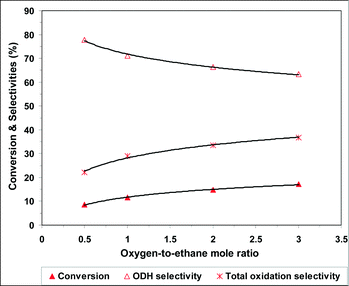 | ||
| Fig. 10 Effect of oxygen-to-ethane molar ratio on the oxidative dehydrogenation of ethane over 0.5P@NiO catalyst at 400 °C (W/F = 0.54 g s cm−3). | ||
To evaluate the stability of the phosphated catalysts, the 0.5P@NiO system was monitored during ethane ODH at 400 °C with an oxygen-to-ethane molar ratio of 1 and W/F ratio of 0.54 g s cm−3 for ca. 42 h on stream. As shown by the evolution of the conversion and ODH selectivity in Fig. 11, the 0.5P@NiO catalytic performance is maintained under the reaction conditions studied for 42 h on stream.
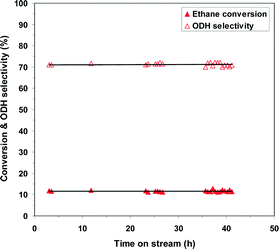 | ||
| Fig. 11 Catalytic performance of 0.5P@NiO system within ca. 42 h of on-stream reaction at 400 °C, oxygen-to-ethane molar ratio = 1 and W/F of 0.54 g s cm−3. | ||
3.3. Electrical conductivity measurements
The semi-log plots of σ as a function of the reciprocal temperature during temperature-programmed heating of the catalysts from 290 to 440 °C (reaction temperature range) in air at atmospheric pressure are presented in Fig. 12. The observed linear dependence shows that all the materials behave like semiconductors with electrical conductivities that vary exponentially with the temperature according to the Arrhenius law: | (3) |
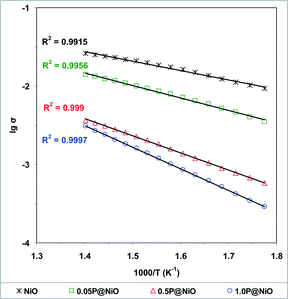 | ||
| Fig. 12 Arrhenius plots for the electrical conductivity σ of NiO and phosphated NiO catalysts under air in the temperature range from 290 to 440 °C (σ in ohm−1 cm−1). | ||
The data in Fig. 12 also show that in the reaction temperature range studied, the electrical conductivity decreases with increasing phosphorus content as follows: NiO > 0.05P@NiO > 0.5P@NiO > 1.0P@NiO. Therefore, according to eqn (2), the charge carrier concentration and/or mobility decrease with increasing phosphorus content. As shown by the plot of the electrical conductivity at 400 °C as a function of the P content in Fig. 13, the electrical conductivities of NiO and 0.05P@NiO differ markedly. Notably, the intrinsic ethane conversion rate at 400 °C as a function of the P content follows the same trend (Fig. 13), clearly suggesting that the charge carriers are involved in the ethane conversion.
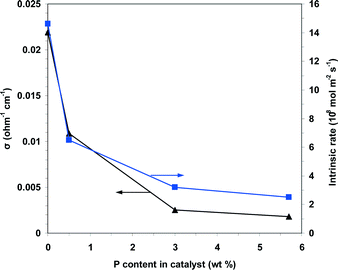 | ||
| Fig. 13 Plots of the electrical conductivity and the intrinsic rate of ethane conversion measured at 400 °C as a function of the P content in the solid. | ||
The Ec values listed in Table 4 were calculated from the slopes of the semi-log plots in Fig. 12. The activation energy of conduction increases with increasing phosphorus content as follows: NiO < 0.05P@NiO < 0.5P@NiO < 1.0P@NiO.
The log–log plots of σ as a function of the oxygen pressure at 350 °C are shown in Fig. S4.† All the samples are p-type oxides under oxygen because ∂σ/∂PO2 > 0. It is generally assumed that the electrical conductivity σ of p-type oxides varies as a function of the oxygen partial pressure PO2 and temperature T according to the equation:
 | (4) |
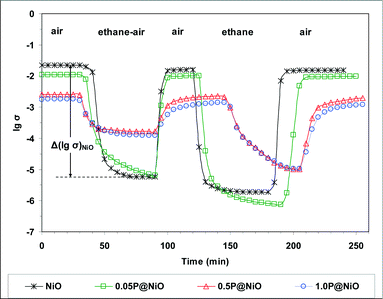
To study the redox behavior of the catalysts under conditions closely resembling the catalytic reaction conditions, electrical conductivity measurements were performed sequentially under air, an ethane–air mixture (reaction mixture) and pure ethane at 400 °C, which is within the reaction temperature range. The results are presented in Fig. 14. The solids were heated from room temperature to 400 °C at a rate of 5 °C min−1 in air at atmospheric pressure. After steady state was achieved under air flow, an ethane–air mixture was passed over the samples.
For all the catalysts, the electrical conductivity under the ethane–air flow is lower than that in air, and the difference between these electrical conductivities depends on the P content. Thus, based on the p-type criterion for oxide semiconductors, i.e. ∂σ/∂PO2 > 0 or, assuming that ethane is a reductant, ∂σ/∂PC2H6 < 0, p-type semiconductor behavior is observed in all these systems. When air is subsequently flowed over the samples, the electrical conductivity immediately increases and reaches a plateau at the initial σ value, showing that the reduced solid can be completely reoxidized. After steady state was again reached under air flow, pure ethane was flowed over the samples. Under a pure ethane flow, the electrical conductivity decreases considerably and reaches a plateau when steady state is achieved. This result confirms the p-type character of all the samples in the presence of ethane. Finally, air was again flowed over the samples to verify the reversibility of the observed phenomena. Indeed, the electrical conductivity increases and reaches a plateau at the initial σ value under air, showing that the solids reduced under pure ethane can be completely reoxidized. The observed decrease in the electrical conductivity of the catalysts in the presence of the ethane–air mixture clearly suggests that ethane is transformed by consuming the positive holes in the p-type oxide catalyst. From a chemical viewpoint, a positive hole corresponds to an electron vacancy in the lattice O×O anion valence band, i.e. the “chemical site” of a positive hole is a lattice O˙O anion75,76 according to the reaction:
| O×O + h˙⇄O˙O | (5) |
In the initial ethane activation step over the pure NiO and phosphated NiO catalysts, a surface lattice O− species (i.e., O˙O) attacks a C–H bond and cleaves it. This mechanism was previously proposed for other NiO-based catalysts.7,16 The reversible redox processes observed for all the solids under different gas flows are consistent with a Mars-van Krevelen-type mechanism.77 Notably, during reduction under the ethane–air mixture, the absolute value of the slope dσ/dt decreases in the following order: NiO > 0.05P@NiO > 0.5P@NiO > 1.0P@NiO (Fig. 14), indicating that the catalyst reduction rate decreases with increasing phosphorus content. This result is consistent with the observed decrease in the ethane ODH catalytic activity.
The difference between the steady-state electrical conductivities in air (for the fully oxidized solid) and under the reaction mixture (ethane–air mixture) was considered in terms of lg(σ) (denoted Δ[lg(σ)]). The electrical conductivity decreases when the reaction mixture is flowed over the sample, showing that the solid is reduced, and therefore, Δ[lg(σ)] can be considered a measure of the number of lattice oxygen species removed from the solid under the reaction mixture flow relative to that under air flow. As shown in Table 4, Δ[lg(σ)] decreases, and consequently, the number of available oxygen species decreases with increasing phosphorus content. Because the surface lattice O− species are involved in the ethane transformation and are quite active in alkane oxidation, ethane combustion is promoted over oxidative dehydrogenation when a high number of these species is available.75,78 Therefore, the ethylene selectivity increases, and the CO2 selectivity decreases when the phosphorus content in the NiO catalyst is increased. Indeed, at 400 °C, the Δ[lg(σ)] value clearly correlates with the ethylene selectivity as shown in Fig. 15, in which these parameters are plotted as a function of the catalyst phosphorus content.
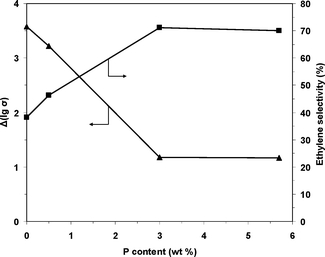 | ||
| Fig. 15 Ethylene selectivity at 400 °C and the number of available oxygen species in the catalyst expressed as Δ[lg(σ)] as a function of the P content in the solid. | ||
4. Conclusions
Phosphorus is highly dispersed on the NiO surface as phosphate and, at higher P contents, as pyrophosphate species where they determined the formation of isolated NiO domains. Surface phosphorus leads to decreases in both the concentration and mobility of the surface lattice O− species in NiO, which affects its catalytic performance in the low-temperature ethane ODH. Thus, adding P to NiO and increasing its content decreases the surface density of non-selective active sites on the NiO catalysts and results in a decrease of ethane conversion with an increase in ODH selectivity at the expense of total oxidation selectivity.Acknowledgements
S. B. Ivan and I. C. Marcu thank UEFISCDI Romania for the Young Researcher Fellowship awarded under the contract no. 5/05.01.2015. The generous support of the CNRS France is acknowledged with gratitude by I. Fechete.References
- F. Cavani, N. Ballarini and A. Cericola, Catal. Today, 2007, 127, 113 CrossRef CAS.
- C. A. Gärtner, A. C. van Veen and J. A. Lercher, ChemCatChem, 2013, 5, 3196 CrossRef.
- V. Ducarme and G. A. Martin, Catal. Lett., 1994, 23, 97 CrossRef CAS.
- Y. Schuurman, V. Ducarme, T. Chen, W. Li, C. Mirodatos and G. A. Martin, Appl. Catal., A, 1997, 163, 227 CrossRef CAS.
- E. Heracleous, A. F. Lee, K. Wilson and A. A. Lemonidou, J. Catal., 2005, 231, 159 CrossRef CAS.
- E. Heracleous and A. A. Lemonidou, J. Catal., 2010, 270, 67 CrossRef CAS.
- I. Popescu, E. Heracleous, Z. Skoufa, A. Lemonidou and I. C. Marcu, Phys. Chem. Chem. Phys., 2014, 16, 4962 RSC.
- E. Heracleous and A. A. Lemonidou, J. Catal., 2006, 237, 162 CrossRef CAS.
- E. Heracleous and A. A. Lemonidou, J. Catal., 2006, 237, 175 CrossRef CAS.
- B. Savova, S. Loridant, D. Filkova and J. M. M. Millet, Appl. Catal., A, 2010, 390, 148 CrossRef CAS.
- E. Heracleous, A. Delimitis, L. Nalbandian and A. A. Lemonidou, Appl. Catal., A, 2007, 325, 220 CrossRef CAS.
- H. Zhu, S. Ould-Chikh, D. H. Anjum, M. Sun, G. Biausque, J. M. Basset and V. Caps, J. Catal., 2012, 285, 292 CrossRef CAS.
- P. Laveille, G. Biausque, H. Zhu, J. M. Basset and V. Caps, Catal. Today, 2013, 203, 3 CrossRef CAS.
- X. Y. Sun, B. Li and H. Metiu, J. Phys. Chem. C, 2013, 117, 23597 CAS.
- Z. Skoufa, E. Heracleous and A. A. Lemonidou, J. Catal., 2015, 322, 118 CrossRef CAS.
- I. Popescu, Z. Skoufa, E. Heracleous, A. A. Lemonidou and I. C. Marcu, Phys. Chem. Chem. Phys., 2015, 12, 8138 RSC.
- H. Zhu, D. C. Rosenfeld, D. H. Anjum, V. Caps and J. M. Basset, ChemSusChem, 2015, 8, 1254 CrossRef CAS PubMed.
- H. Zhu, H. Dong, P. Laveille, Y. Saih, V. Caps and J. M. Basset, Catal. Today, 2014, 228, 58 CrossRef CAS.
- J. M. López Nieto, B. Solsona, R. K. Grasselli and P. Concepción, Top. Catal., 2014, 57, 1248 CrossRef.
- Z. Skoufa, G. Xantri, E. Heracleous and A. A. Lemonidou, Appl. Catal., A, 2014, 471, 107 CrossRef CAS.
- S. Agouram, A. Dejoz, F. Ivars, I. Vázquez, J. M. López Nieto and B. Solsona, Fuel Process. Technol., 2014, 119, 105 CrossRef CAS.
- Q. Zhou, D. Zhou, Y. Wu and T. Wu, J. Rare Earths, 2013, 31, 669 CrossRef CAS.
- B. Solsona, P. Concepción, B. Demicol, S. Hernández, J. J. Delgado, J. J. Calvino and J. M. López Nieto, J. Catal., 2012, 295, 104 CrossRef CAS.
- Y. Wu, J. Gao, Y. He and T. Wu, Appl. Surf. Sci., 2012, 258, 4922 CrossRef CAS.
- B. Solsona, P. Concepción, S. Hernández, B. Demicol and J. M. López Nieto, Catal. Today, 2012, 180, 51 CrossRef CAS.
- B. Solsona, J. M. López Nieto, P. Concepción, A. Dejoz, F. Ivars and M. I. Vázquez, J. Catal., 2011, 280, 28 CrossRef CAS.
- L. Smoláková, L. Čapek, Š. Botková, F. Kovanda, R. Bulánek and M. Pouzar, Top. Catal., 2011, 54, 1151 CrossRef.
- J. Li, R. Li, C. Wang, C. Huang, W. Weng and H. Wan, Chin. J. Catal., 2009, 30, 714 CrossRef CAS.
- J. P. Bortolozzi, T. Weiss, L. B. Gutierrez and M. A. Ulla, Chem. Eng. J., 2014, 246, 343 CrossRef CAS.
- K. Sakitani, K. Nakamura, N. Ikenaga, T. Miyake and T. Suzuki, J. Jpn. Pet. Inst., 2010, 53, 327 CrossRef CAS.
- B. Solsona, F. Ivars, A. Dejoz, P. Concepción, M. I. Vázquez and J. M. López Nieto, Top. Catal., 2009, 52, 751 CrossRef CAS.
- K. Nakamura, T. Miyake, T. Konishi and T. Suzuki, J. Mol. Catal. A: Chem., 2006, 260, 144 CrossRef CAS.
- A. Maiti, N. Govind, P. Kung, D. King-Smith, J. E. Miller, C. Zhang and G. Whitwell, J. Chem. Phys., 2002, 117, 8080 CrossRef CAS.
- J. El-Idrissi, M. Kacimi, F. Bozon-Verduraz and M. Ziyad, Catal. Lett., 1998, 56, 221 CrossRef CAS.
- S. J. Khatib, J. L. G. Fierro and M. A. Banares, Top. Catal., 2009, 52, 1459 CrossRef CAS.
- R. P. Singh, M. A. Bañares and G. Deo, J. Catal., 2005, 233, 388 CrossRef CAS.
- N. Haddad, E. Bordes-Richard, L. Hilaire and A. Barama, Catal. Today, 2007, 126, 256 CrossRef CAS.
- N. Haddad, E. Bordes-Richard and A. Barama, Catal. Today, 2009, 142, 215 CrossRef CAS.
- X. Z. Lin, G. C. Li, C. J. Huang, W. Z. Weng and H. L. Wan, Chin. Chem. Lett., 2013, 24, 789 CrossRef CAS.
- I. C. Marcu, M. N. Urlan, Á. Rédey and I. Săndulescu, C. R. Chim., 2010, 13, 365 CrossRef CAS.
- I. T. Trotuş, C. M. Teodorescu, V. I. Pârvulescu and I. C. Marcu, ChemCatChem, 2013, 5, 757 CrossRef.
- I. Popescu, I. T. Trotuş and I. C. Marcu, Appl. Catal., B, 2012, 128, 55 CrossRef CAS.
- J. M. Herrmann, in: Catalyst Characterization, Physical Techniques for Solid Materials, ed. B. Imelik and J. C. Védrine, Plenum Press, New York, 1994, ch. 20 Search PubMed.
- S. J. Gregg and K. S. W. Sing, Adsorption, Surface Area and Porosity, Academic Press, London, 1982 Search PubMed.
- J. P. Attfield, Phosphates: Solid-state Chemistry in Encyclopedia of Inorganic Chemistry, ed. R. Bruce King, Wiley, 2nd edn, 2005 Search PubMed.
- X. Liu, L. Xu and B. Zhang, J. Solid State Chem., 2014, 212, 13 CrossRef CAS.
- S. H. Lee, H. M. Cheong, N. G. Park, C. E. Tracy, A. Mascarenhas, D. K. Benson and S. K. Deb, Solid State Ionics, 2001, 140, 135 CrossRef CAS.
- C. V. Ramana, A. Ait-Salah, S. Utsunomiya, U. Becker, A. Mauger, F. Gendron and C. M. Julien, Chem. Mater., 2006, 18, 3788 CrossRef CAS.
- L. Zhang and R. K. Brow, J. Am. Ceram. Soc., 2011, 94, 3123 CrossRef CAS.
- C. V. Ramana, A. Ait-Salah, S. Utsunomiya, J. F. Morhange, A. Mauger, F. Gendron and C. M. Julien, J. Phys. Chem. C, 2006, 111, 1049 CrossRef.
- M. Garcıa-Dieguez, I. S. Pieta, M. C. Herrera, M. A. Larrubia and L. J. Alemany, Appl. Catal., A, 2010, 377, 191 CrossRef.
- J.-T. Feng, Y.-J. Lin, D. G. Evans, X. Duan and D.-Q. Li, J. Catal., 2009, 266, 351 CrossRef CAS.
- J. C. Vedrine, G. Hollinger and T. M. Duc, J. Phys. Chem., 1978, 82, 1515 CrossRef CAS.
- A. F. Carley, S. D. Jackson, M. W. Roberts and J. O'Shea, Surf. Sci., 2000, 454, 141 CrossRef.
- C. N. R. Rao, V. Vijayakrishman, M. K. Rajumon and G. U. Kulkarni, Appl. Surf. Sci., 1995, 84, 285 CrossRef CAS.
- L. Soriano, I. Preda, A. Gutiérrez, S. Palacín, M. Abbate and A. Vollmer, Phys. Rev. B: Condens. Matter Mater. Phys., 2007, 75, 233417 CrossRef.
- S. Palacín, A. Gutiérrez, I. Preda, M. Hernández-Vélez, R. Sanz, J. A. Jiménez and L. Soriano, Appl. Surf. Sci., 2007, 254, 278 CrossRef.
- I. Preda, R. J. O. Mossanek, M. Abbate, L. Alvarez, J. Méndez, A. Gutiérrez and L. Soriano, Surf. Sci., 2012, 606, 1426 CrossRef CAS.
- U. Izquierdo, V. L. Barrio, K. Bizkarra, A. M. Gutierrez, J. R. Arraibi, L. Gartzia, J. Bañuelos, I. Lopez-Arbeloa and J. F. Cambra, Chem. Eng. J., 2014, 238, 178 CrossRef CAS.
- V. Biju and M. AbduKhadar, J. Nanopart. Res., 2002, 4, 247 CrossRef CAS.
- D. Alders, F. C. Voogt, T. Hibma and G. A. Sawatzky, Phys. Rev. B: Condens. Matter Mater. Phys., 1996, 54, 7716 CrossRef CAS.
- B. Savova, S. Loridant, D. Filkovaa and J. M. M. Millet, Appl. Catal., A, 2010, 390, 148 CrossRef CAS.
- S. Oswald and W. Bruckner, Surf. Interface Anal., 2004, 36, 17 CrossRef CAS.
- M. S. P. Francisco, R. Landers and Y. Gushikem, J. Solid State Chem., 2004, 177, 2432–2439 CrossRef CAS.
- S. Echeandia, P. L. Arias, V. L. Barrio, B. Pawelec and J. L. G. Fierro, Appl. Catal., B, 2010, 101, 1 CrossRef CAS.
- Z. Boukha, M. Kacimi, M. F. R. Pereira, J. L. Faria, J. L. Figueiredo and M. Ziyad, Appl. Catal., A, 2007, 317, 299 CrossRef CAS.
- L. Pino, A. Vita, M. Laganà and V. Recupero, Appl. Catal., B, 2014, 148–149, 91 CrossRef CAS.
- J. F. Moulder, W. F. Stickle, P. E. Sobol and K. D. Bomben, Handbook of X-ray Photoelectron Spectroscopy, ed. J. Chastain and R. C. King, Physical Electronics, Minnesota, 1995, p. 45 Search PubMed.
- G. C. Allen, E. Ciliberto, I. Fragala and G. Spoto, Nucl. Instrum. Methods Phys. Res., Sect. B, 1996, 116, 457 CrossRef CAS.
- L. Zhang and F. Li, Appl. Clay Sci., 2010, 50, 64 CrossRef CAS.
- M. Textor, L. Ruiz, R. Hofer, A. Rossi, K. Feldman, G. Hahner and N. D. Spencer, Langmuir, 2000, 16, 3257 CrossRef CAS.
- S. Kaciulis, G. Mattogno, L. Pandolfi, M. Cavalli, G. Gnappi and A. Montenero, Appl. Surf. Sci., 1999, 44, 133 Search PubMed.
- P. G. Rouxhet, N. Mozes, P. B. Dengis, Y. F. Dufrene, P. A. Gerin and M. J. Genet, Colloids Surf., B, 1994, 2, 347 CrossRef CAS.
- R. K. Grasselli, Top. Catal., 2001, 15, 93 CrossRef CAS.
- J. M. Herrmann, P. Vernoux, K. E. Béré and M. Abon, J. Catal., 1997, 167, 106 CrossRef CAS.
- J. M. M. Millet, Top. Catal., 2006, 38, 83 CrossRef CAS.
- S. Mars and N. van Krevelen, Chem. Eng. Sci., 1954, 9(special suppl.), 41 CrossRef.
- Z. Skoufa, E. Heracleous and A. A. Lemonidou, Catal. Today, 2012, 192, 169 CrossRef CAS.
Footnote |
| † Electronic supplementary information (ESI) available. See DOI: 10.1039/c6cy00946h |
| This journal is © The Royal Society of Chemistry 2016 |

