
 Open Access Article
 This Open Access Article is licensed under a Creative Commons Attribution-Non Commercial 3.0 Unported Licence
Catalytic hydrotreatment of fast pyrolysis liquids in batch and continuous set-ups using a bimetallic Ni–Cu catalyst with a high metal content†
Wang
Yin
a,
Arjan
Kloekhorst
a,
Robertus H.
Venderbosch
b,
Maria V.
Bykova
c,
Sofia A.
Khromova
c,
Vadim A.
Yakovlev
c and
Hero J.
Heeres
*a
aDepartment of Chemical Engineering, University of Groningen, Nijenborgh 4, 9747 AG, Groningen, The Netherlands. E-mail: h.j.heeres@rug.nl; Tel: +31 50 3634174
bBiomass Technology Group BV, Josink Esweg 34, 7545 PN Enschede, The Netherlands
cBoreskov Institute of Catalysis, 5, pr. Akad. Lavrentieva, 630090 Novosibirsk, Russia
First published on 3rd May 2016
Abstract
In this paper, an experimental study on the hydrotreatment of fast pyrolysis liquids is reported in both batch and continuous set-ups using a novel bimetallic Ni–Cu based catalyst with high Ni loading (up to 50%) prepared by a sol–gel method. The experiments were carried out in a wide temperature range (80–410 °C) and at a hydrogen pressure between 100–200 bar to determine product properties and catalyst performance as a function of process conditions. To gain insight into the molecular transformations, the product oils were analysed by GC × GC, 1H-NMR and GPC and reveal that the sugar fraction is reactive in the low temperature range (<200 °C), whereas the lignin fraction is only converted at elevated temperatures (>300 °C). In addition, the organic acids are very persistent and reactivity was only observed above 350 °C. The results are rationalized using a reaction network involving competitive hydrogenation of reactive aldehydes and ketones of the sugar fraction of fast pyrolysis liquids and thermal polymerisation. In addition, relevant macro-properties of the product oils including flash point (30 to 80 °C), viscosity (0.06 to 0.93 Pa s) and TG residue (<1 to about 8 wt%) were determined and compared. Product oils with the lowest oxygen content (<13 wt%) were obtained in the continuous set-up at 410 °C.
1. Introduction
In the past decade, environmental concerns have boosted research and development activities on biomass conversions to biofuels and bio-based chemicals.1 Fast pyrolysis is a very versatile biomass conversion technology. Process development activities in the field of fast pyrolysis culminated in the construction of successful commercial scale plants in the US and Canada (for example by Ensyn), Finland (Valmet) and the Netherlands (EMPYRO). The technology is on the verge of commercial exploitation, and large quantities of pyrolysis liquids will thus become available. Fast pyrolysis is carried out in the absence of oxygen, at atmospheric pressure and at a temperature ranging from 450 to 600 °C. The main product (up to 70 wt% on feed) is a liquid, which is known as a pyrolysis liquid or bio-oil.2 However, the product does not resemble a typical crude oil, as it is polar in nature, contains up to 30 wt% of water and as such is better referred to as a pyrolysis liquid (PL).3 PLs are complex mixtures with over several hundreds of organic compounds as identified by analytical techniques like GC, although they also contain higher molecular weight, non GC detectable compounds.4Pyrolysis liquids are acidic in nature (pH below 3),5 non-volatile and immiscible with hydrocarbons. In addition, they are not stable, and especially at elevated temperature, polymerization occurs leading to an increase in viscosity over time. PLs cannot be used as e.g. transportation fuels and require upgrading to increase their thermal stability and volatility and to decrease their viscosity and acidity.3
Catalytic hydrotreatment is an attractive upgrading technology to improve the product properties of PLs. It is typically carried out at elevated temperatures with high hydrogen pressure and in the presence of a hydrogenation catalyst.6 Catalyst requirements are stringent; they should be stable in the acidic, aqueous PL at elevated temperatures and should be highly active for a broad range of organic compound classes such as aldehydes and ketones, organic acids, lignin derived phenolic monomers, etc.7
Developments on the hydrotreatment of pyrolysis liquids already started in the nineties and was reinitiated in 2001 with a breakthrough in the FP6 project BIOCOUP, where it was shown that hydrotreated pyrolysis liquids with Ru/C could be very well co-fed in a fluid catalytic cracking (FCC) unit.3 In addition, it was demonstrated that catalytic hydrotreatment allows the efficient conversion of biomass into transport fuels, potentially reaching 40 to 50 wt% carbon yield.
Various types of supported catalysts have been reported for the hydrotreatment of PLs. For instance, noble metal catalysts (Ru, Rh, Pt, Pd) on various supports have been used extensively.6,8–14 Supports include activated carbon and inorganic materials like Al2O3, SiO2, TiO2, ZrO2 and CeO2. These catalysts exhibit good hydro(deoxy)genation activity for compounds with a wide variety of functional groups. However, the high costs of particularly the metal components limit their application potential, so there is a strong incentive to identify cheap metal catalysts for the catalytic hydrotreatment of pyrolysis liquids.
Among these, nickel based catalysts have been proposed, and different types of nickel based catalysts have been reported for the catalytic hydrotreatment of PLs (Table S1, ESI†). Sulfided Ni–Mo catalysts were successfully used for the full hydrodeoxygenation of PLs (Table S1, entries 1–5, ESI†). In continuous runs, up to 100 h times on stream were reported with conventional PLs. However, upon longer runtimes, pressure drop increases were observed due to char formation. Besides, a certain amount of sulfur is required in the reactor to maintain a steady high activity of the catalysts. Unfortunately, the sulfur content in the PL is low and the addition of sulfiding agents is required, which limits the attractiveness for commercial operation. Non-sulfided nickel based catalysts, including RANEY® nickel, and supported bimetallic and trimetallic nickel catalysts were also tested for pyrolysis liquid hydrogenation (Table S1, entries 6–17, ESI†). Improved product properties were reported, e.g. higher pH values, lower oxygen contents, and higher heating values. However, coke/char formation has been observed in some cases, which may lead to operational issues in continuous reactors. In addition, deep deoxygenation requires a two step-process, one at low temperature (about 200 °C) and one at high temperature, often up to 400 °C. Besides, catalyst deactivation (e.g. by coke deposition)15,16 and nickel leaching have been mentioned.17
We reported the use of bimetallic Ni–Cu catalysts on δ-Al2O3, CeO2–ZrO2, ZrO2, SiO2, TiO2, rice husk carbon and sibunite prepared using wet impregnation techniques for the catalytic hydrotreatment of PLs (Table S1, entries 18 and 19, ESI†). However, undesirable char formation by thermal polymerization was reported and is a major drawback for continuous operation. Recently, we have reported an exploratory catalyst screening study on the use of Ni catalysts with high metal loading promoted by Cu and Pd for the catalytic hydrotreatment of fast pyrolysis oil and showed the potential of this class of catalysts. This study was exploratory in nature and was performed in batch reactors only, and a systematic study on the effect of process conditions on product properties was not part of this investigation.18
Here, we report a systematic study on the use of a bimetallic Ni–Cu based catalyst stabilized by SiO2–ZrO2 with high Ni loading prepared by a sol–gel method for the catalytic hydrotreatment of PLs in both a batch-slurry set-up and a continuous packed bed set-up. The objectives of this study are to gain insight into i) the relevant product properties of the upgraded oils (such as flash point, viscosity, acidity and coking tendency) as a function of the reaction temperature and ii) the molecular transformations taking place at various temperatures to assess the reactivity of various component classes in the PLs. For the latter, the product oils were analysed using a range of (analytical) techniques, including advanced GC × GC, 1H-NMR, GPC, CAN, TAN and IR spectroscopy. The results for the batch and continuous experiments will be compared and differences will be discussed. Finally, catalyst characterization studies (BET, XRD, TEM, etc.) will be reported for the catalyst.
2. Experimental
2.1 Materials
The fast pyrolysis liquids (PLs) were supplied by Biomass Technology Group (BTG, Enschede, the Netherlands) and are derived from pine wood. Relevant properties are given in Table 1. Hydrogen, nitrogen and helium were obtained from Linde and were of analytical grade (>99.99%). Hydroxylamine hydrochloride (Fluka, ≥99.0%), potassium hydroxide (Fluka, 1.0 M), 2-propanol (anhydrous, 99.5%), and absolute ethanol (>99.8%) were obtained from Sigma-Aldrich. A reference gas containing H2, CH4, ethylene, ethane, propylene, propane, CO and CO2 with known composition for GC gas phase calibrations was purchased from Westfalen AG, Münster, Germany.| Properties | Batch experiments | Continuous experiments |
|---|---|---|
| Water content (wt%) | 32.8 | 22.6 |
| Elemental composition on dry basis (wt%) | ||
| C | 56.5 | 55.6 |
| H | 6.6 | 6.5 |
| O (by difference) | 36.9 | 38.0 |
| N | <0.01 | <0.01 |
2.2 Catalyst synthesis
The bimetallic Ni–Cu catalyst with a high Ni content of 46 wt% (58 wt% NiO) and a Cu content of 5 wt% (6.3 wt% CuO) with the remainder being SiO2 (25 wt%) and ZrO2 (10.7 wt%) was prepared using a catalyst preparation protocol given by Bykova et al.19,20 The catalyst was crushed to 25–75 μm particles before use in batch experiments. Larger particles (2–5 mm) were applied for the continuous experiments in the packed bed reactor set-up. The catalyst was reduced in situ prior to the experiments according to the procedures specified in section 2.3 (batch mode experiments) and section 2.4 (continuous flow experiments).Before catalyst characterization by a number of physicochemical methods (XPS, XRD, TEM, BET), the catalyst was reduced ex situ in a quartz reactor in a hydrogen flow of 200 cm3 min−1 at 0.1 MPa. 400 °C was selected as the reduction temperature based on TPR analysis of the catalyst (see section 3.6). After 2 h of reductive treatment at 400 °C, the catalyst was cooled under a hydrogen flow. Upon reaching room temperature, the hydrogen gas flow was changed to argon, and the catalyst was passivated by ethanol and dried under ambient conditions.
2.3 Catalytic hydrotreatment of pyrolysis liquids in a batch set-up
For the batch reactions using the Ni–Cu catalyst, the reactor (100 ml, Parr) was charged with 1.25 g of catalyst (5 wt% with respect to pyrolysis liquids). The catalyst was pre-reduced using 20 bar of H2 at 350 °C for 1 h. Subsequently, 25.0 g of pyrolysis liquid was injected from a feed vessel using nitrogen gas. The reactor was flushed 3 times with hydrogen (10 bar) and then pressurized to 140 bar at room temperature. The reactor was heated to the intended reaction temperature with a heating rate of around 10 °C min−1, and the reactor content was maintained at the predetermined reaction temperature for 4 h. Experiments were performed at five different temperatures, ranging from 80 to 350 °C. After reaction, the reactor was cooled to ambient temperature, the pressure was recorded for mass balance calculations and the gas phase was sampled using a 3 L gas bag. The reactor content was collected and transferred to a centrifuge tube and weighed. The aqueous phase and the oil phase were separated by centrifugation (4500 rpm, 30 min), and both phases were collected and weighed. The reactor was thoroughly rinsed with acetone. The acetone was removed by evaporation in air, and the resulting product was weighed and added to the oil phase for mass balance calculation. The aqueous phase was evaporated (120 °C, atmospheric pressure), and the residue was added to the oil phase (together they form the total organic product oil) for mass balance calculations and further analysis. The remaining solid residue in the reactor combined with the solid residue in the centrifuge tube was washed with acetone, filtered over filter paper and dried at 100 °C overnight until constant weight. The amount of char formed was defined as the amount of solid residue minus the original catalyst intake. The amount of gas phase after reaction was determined by the pressure difference in the reactor before and after reaction at room temperature using the ideal gas law, assuming that the gas hold-up in the reactor before and after reaction is constant.2.4 Catalytic hydrotreatment of pyrolysis liquids in a continuous set-up
The experiments were carried out in a continuous operation reactor system (see Fig. S1, ESI†). The unit consists of three reactors, with volumes between 0.5 L (1st and 3rd reactors) and 1 L for the 2nd reactor. A temperature profile was used, and a typical experiment was carried out at temperatures of 60–90 °C in the first reactor, 150–200 °C in the second reactor and a higher temperature in the third reactor (max. 410 °C). The reactors were pressurized to 200 bar by feeding hydrogen, and the pressure was controlled with a backpressure valve in the outlet of the last reactor (±1 bar). Gas and liquids were depressurised and separated in a gas–liquid separator. The liquid phase was collected and weighed, and the amount of gas phase was determined using a flow meter; its composition was determined using a GC. The catalyst was typically pre-reduced in the set-up at 500 °C and atmospheric pressure before starting an actual experiment.2.5 Product analyses
![[thin space (1/6-em)]](https://www.rsc.org/images/entities/char_2009.gif) :1 volume), and titration was performed using a 1.0 M KOH solution. The TAN was calculated using eqn (1):
:1 volume), and titration was performed using a 1.0 M KOH solution. The TAN was calculated using eqn (1): | (1) |
 | (2) |
2.6 Catalyst characterization
Two types of samples were examined by XPS – the catalyst in the initial oxide form and the one after reductive treatment in hydrogen at 400 °C (section 2.2). The reduced catalyst was pressed into thin self-supporting wafers with a diameter of 9 mm and a thickness of 1 mm. Then, the sample was reduced in the high-pressure cell of the XPS machine at a hydrogen pressure of 0.1 MPa at 350 °C for 1 h. Thereafter, the catalyst was cooled to the room temperature, vacuumized and transferred to the analysis chamber without contact with air.
3. Results and discussion
3.1 Batch experiments
The catalytic hydrotreatment reactions were initially carried out in a batch set-up using 5 wt% catalyst on feed and a reaction time of 4 h. Experiments were performed at five different temperatures, ranging from 80 to 350 °C. For all experiments, the initial hydrogen pressure at room temperature was 140 bar H2, the actual pressure at reaction temperature was temperature dependent and the highest pressure was up to 200 bar at 350 °C.After reaction, two distinct liquid phases were formed for experiments at and above 180 °C, whereas one liquid phase was present at lower temperature (80 °C). The hydrogen consumption, amount of various product phases and mass balance are given in Table 2. The yield of the organic oil phase after reaction ranged from 27 to 33 wt% on feed (wet basis). The water phase also contains organics. These were isolated after removal of the water by evaporation, and this organic fraction was added to the organic phase after reaction. The amounts of the combined organic phases (the total organic product oil) ranged from 66.9 to 35.7 wt% (dry basis). The oxygen content of the product oils (wt%, dry basis) was between 34.1 at 80 °C and 16.2 wt% at 350 °C. Thus, hydrodeoxygenation reactions occur to a significant extent, although it is not possible to achieve a fully hydrodeoxygenated product under the most severe reaction conditions.
| Reaction temperature | |||||
|---|---|---|---|---|---|
| 80 °C | 180 °C | 250 °C | 300 °C | 350 °C | |
| a Excluding the catalyst. b Duplicate experiment. c The total organic product is the combined oil phase and organic residue after evaporation of water from the aqueous product phase. | |||||
| Hydrogen uptake, NL per kg PL | 35 | 120 (122)b | 175 | 210 | 250 |
| Oil phase, wt% on feed (wet basis) | 100 | 27 (29)b | 32 | 31 | 33 |
| Aqueous phase, wt% on feed | 0 | 61 (62)b | 61 | 55 | 49 |
| Solidsa, wt% on feed | 1.1 | 0.7 (0.8)b | 2.1 | 3.0 | 2.4 |
| Gas, wt% on feed | 0.2 | 0.6 (0.5)b | 1.2 | 3.2 | 7.5 |
| Mass balance closure, wt% | 101 | 90 (92)b | 96 | 92 | 92 |
| Total organic productc, wt% on feed (dry basis) | 66.9 | 53.6 (54.0)b | 49.6 | 42.0 | 35.7 |
| Oxygen content of product oil (wt%, dry) | 34.1 | 33.8 (33.6)b | 31.1 | 27.2 | 16.2 |
| Water content of product oil (wt%) | 32.1 | 11.5 (11.5)b | 9.7 | 7.2 | 4.4 |
The hydrogen consumption is a function of temperature and ranged from 35 NL per kg PL at 80 °C to 250 NL per kg PL at 350 °C. The hydrogen uptake at 80 °C indicates that the catalyst is already active at this temperature. Likely the hydrogen is consumed by the hydrogenation reaction of reactive aldehydes and ketones, which are known to be very reactive when using Ni based catalysts, to the corresponding alcohols (vide infra).
The solid formation is in the range from 0.7 to 3.0 wt%, which is lower than that for the noble metal catalysts tested in our previous studies, e.g. home-made Ru/C (3.0 wt%),9 mono- and bimetallic (Pt, Pd, Rh) catalysts (2.1–6.9 wt%)8 and the bimetallic Ni–Cu/δ-Al2O3 (1.0–4.6 wt%).21
Mass balance closures are satisfactorily (>90%), although in some cases they are hampered by the isolation of liquid products in the feed lines and dead zones in the top part of the reactor (e.g. stirring house) and losses in the evaporation step of the work-up procedure. To gain insight into the reproducibility, a duplicate experiment was performed at 180 °C and the values were in good agreement with the first experiment (see Table 2 for details).
The main components in the gas phase are unreacted hydrogen, methane, C2–C3 alkanes, CO, and CO2 (see Fig. 1 for details). For all experiments, hydrogen is still present in the gas phase at the end of the reaction, indicating that the experiments were not performed under hydrogen starvation conditions. The amounts of components other than hydrogen are temperature dependent and show an exponential increase (from 0.2 (80 °C) to 7.5 wt% (350 °C) on feed). The main gas phase component below 250 °C is CO2, likely from the decarboxylation of organic acids22 and particularly formic acid.23 This acid is present in pyrolysis liquids in significant amounts and is the most reactive organic acid, particularly when noble metal catalysts are present.24 The gas phase distribution shifts from CO2 to hydrocarbons and particularly to methane when the temperature is increased. Methane formation is either due to liquid phase reactions (e.g. catalytic removal of –OMe groups from lignin fragments) or due to gas phase hydrogenation reactions of CO and CO2 with hydrogen by methanation reaction.25
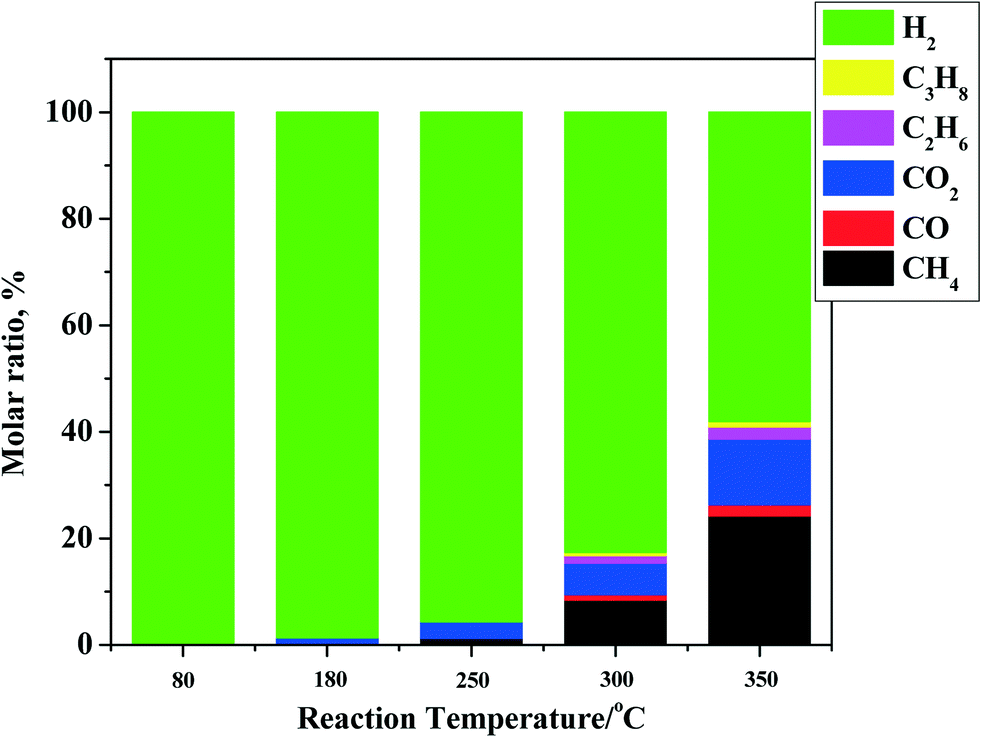 | ||
| Fig. 1 Gas phase composition after reaction for the hydrotreatment of pyrolysis liquids using the Ni–Cu catalyst in the batch set-up. | ||
For all reactions, the amount of gas phase components increases with temperature, although the increase is by far less than that for Ru/C.26 For instance, the amount of gas phase components for Ru/C is about 25 wt% (on feed), which is 3 times as high as for the Ni–Cu catalyst used here (7.5 wt% on feed) at 350 °C. Thus, the use of the bimetallic Ni–Cu catalyst is advantageous when considering its lower formation rate of gas phase components and particularly methane.
3.2 Continuous catalytic hydrotreatment experiments
The catalytic hydrotreatment of PLs in a continuous set-up with the Ni–Cu catalyst was performed in a reactor configuration with three fixed bed reactors in series (Fig. S1, ESI†). A total of five experiments were performed at 200 bar pressure and different temperature profiles in the reactor section for each experiment. The WHSV values were between 0.2 and 0.3 h−1 (Table 3). All experiments were performed with one batch of catalyst, with a cumulative runtime of about 40 h. Each experiment was performed for a minimum of 5 h.| Unit | Experiment | |||||
|---|---|---|---|---|---|---|
| 1 | 2 | 3 | 4 | 5 | ||
| a The pressure was 200 bar for all experiments. b The temperatures in the 1st and 2nd stage reactors are 75 and 180 °C, respectively, and the temperature in the 3rd stage is given in the table. c The total organic product is the combination of the oil phase and the organic residue after vacuum evaporation of the aqueous phase at 75 °C and 0.1 bar. | ||||||
| Temperatureb | °C | 180 | 230 | 310 | 370 | 410 |
| WHSV | gPL gcat−1 h−1 | 0.3 | 0.3 | 0.3 | 0.3 | 0.2 |
| H2 consumption | NL kg−1 | 120 | 130 | 160 | 210 | 320 |
| Total organic product oil yieldc | wt% on feed | 86 | 72 | 57 | 59 | 42 |
| Water content of organic phase | wt% | 15.9 | 12.6 | 7.8 | 7.1 | 3.1 |
Mass balance closure was excellent and was between 97 and 102%. The visual appearance of the liquid phase is a clear function of the process severity. In all experiments, two liquid product phases were obtained with an organic product phase yield between 42 and 86 wt% on feed. The hydrogen consumption is dependent on the temperature and increased from about 120 for the low temperature experiment to 320 NL per kg PL at the highest temperature.
3.3 Elemental composition of the product oils
A van Krevelen diagram for the initial PL (Table 1) and total organic product oils in batch and continuous set-ups is given in Fig. 2. The typical trend as observed for Ru/C27 is also seen for the Ni–Cu catalyst: an increase in the H/C ratio at the lowest temperature compared to the pyrolysis feed, followed by a strong reduction of both the H/C and O/C ratios and again a slight increase in the H/C ratio. The initial increase in the H/C ratio (from 1.40 to 1.55 for the continuous set-up and to 1.63 for the batch set-up) is a strong indication of hydrogenation of reactive components like aldehydes, ketones and sugars to the corresponding alcohols. Examples are the hydrogenation of hydroxyacetaldehyde and dihydroxyacetone, both present in PLs in considerable amounts. Pyrolysis liquids also contain large amounts of mono- and oligomeric sugars, derived from the cellulose and hemicellulose fractions of the lignocellulosic biomass, and the aldehyde/ketone moieties of the sugars are likely hydrogenated in this phase. For example, hydrotreatment of D-glucose over Ni, Ru and Pd based heterogeneous catalysts28–30 at 80–200 °C and 80 bar is known to give high yields of D-sorbitol.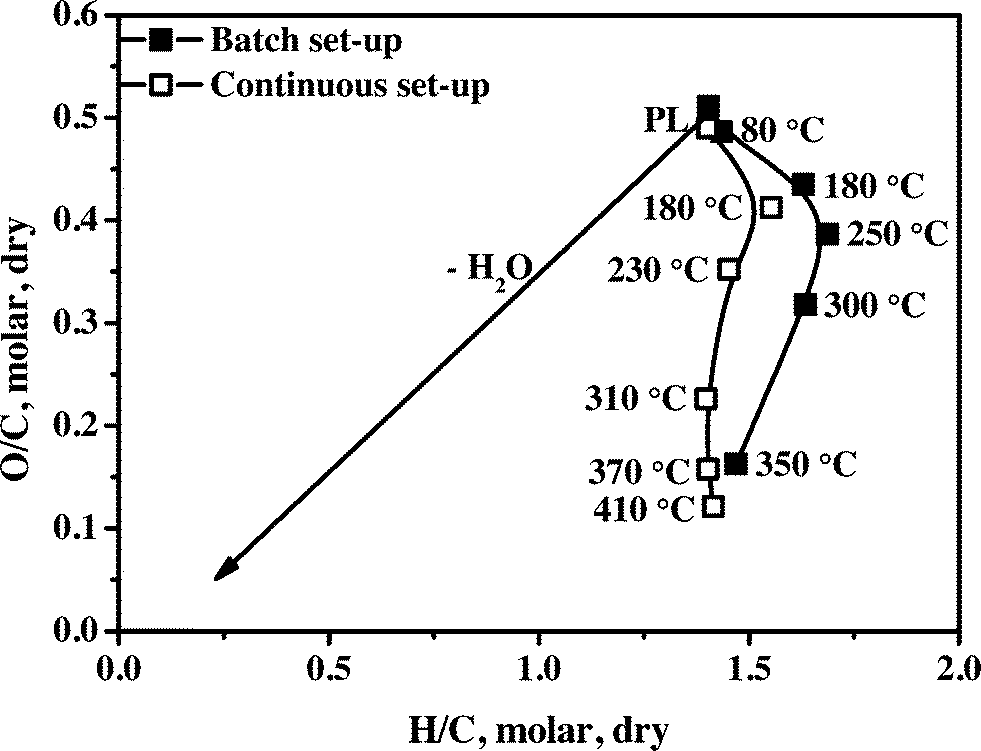 | ||
| Fig. 2 The van Krevelen plot for the pyrolysis feed and product oils from the hydrotreatment reaction using the Ni–Cu catalyst in the batch and continuous set-ups (continuous set-up: the temperatures in the 1st and 2nd stage reactors are 75 and 180 °C, respectively, and the temperature in the 3rd stage is as indicated in the figure). | ||
Upon mild hydrotreatment (reaction temperature between 200–350 °C), the H/C ratio decreases. This is likely due to the formation of considerable amounts of water by condensation and elimination reactions e.g. alcohol dehydrations. Examples of the latter are sorbitol dehydration reactions to form anhydrosorbitols including 1,4-anhydrosorbitol, 2,5-anhydrosorbitol, and 1,5-anhydrosorbitol, which are known to occur for high sorbitol conversions at 250 °C.31 At the upper limit of the temperature range, the H/C ratio increases again, only for the experiments in the continuous set-up, which is indicative of the subsequent hydro(deoxy)genation of reactive components from for example the lignin fraction (alkylphenolics, aromatics).
The H/C ratio for the total organic product oils obtained in the batch set-up is always higher than that of the continuous set-up. It indicates a lower hydro(deoxy)genation activity in the continuous set-up, likely due to mass transfer limitations, e.g. intra-particle mass transfer of hydrogen or other liquid phase components. This is rationalized by considering the use of mm sized catalyst particles in the continuous unit versus micrometer size particles in the batch set-up.
3.4 Product analyses
The relevant product properties of the organic product phases were determined. These include analyses to gain insight into the molecular composition (GC × GC, 1H-NMR, GPC, CAN, TAN and IR) as well as the important macro-properties for product applications (TG residue, a measure for the thermal stability of the oil, viscosity and flash point). Some of these properties were determined for products from both batch and continuous experiments while others only for products from the continuous experiments.3.4.1.1 Two-dimensional gas chromatography (GC × GC). GC × GC spectra of the pyrolysis feed and an upgraded oil at 410 °C obtained in the continuous set-up are shown in Fig. 3 (additional chromatograms at different temperatures are given in Fig. S2, ESI†). Various component groups may be discriminated; examples are organic acids, aldehydes, alcohols, ketones, phenolics, aromatics, hydrocarbons, etc. The spectra are a function of the hydrotreatment temperature, and distinct differences in the molecular composition are visible in the spectra.32,33 For instance, the amounts of hydrocarbons, aromatics and phenolics increase at higher temperatures at the expense of sugars and aldehydes. Furthermore, organic acids are still present in the product oil obtained at 410 °C, indicating that these are rather persistent, in line with the total acid number analyses (vide infra).
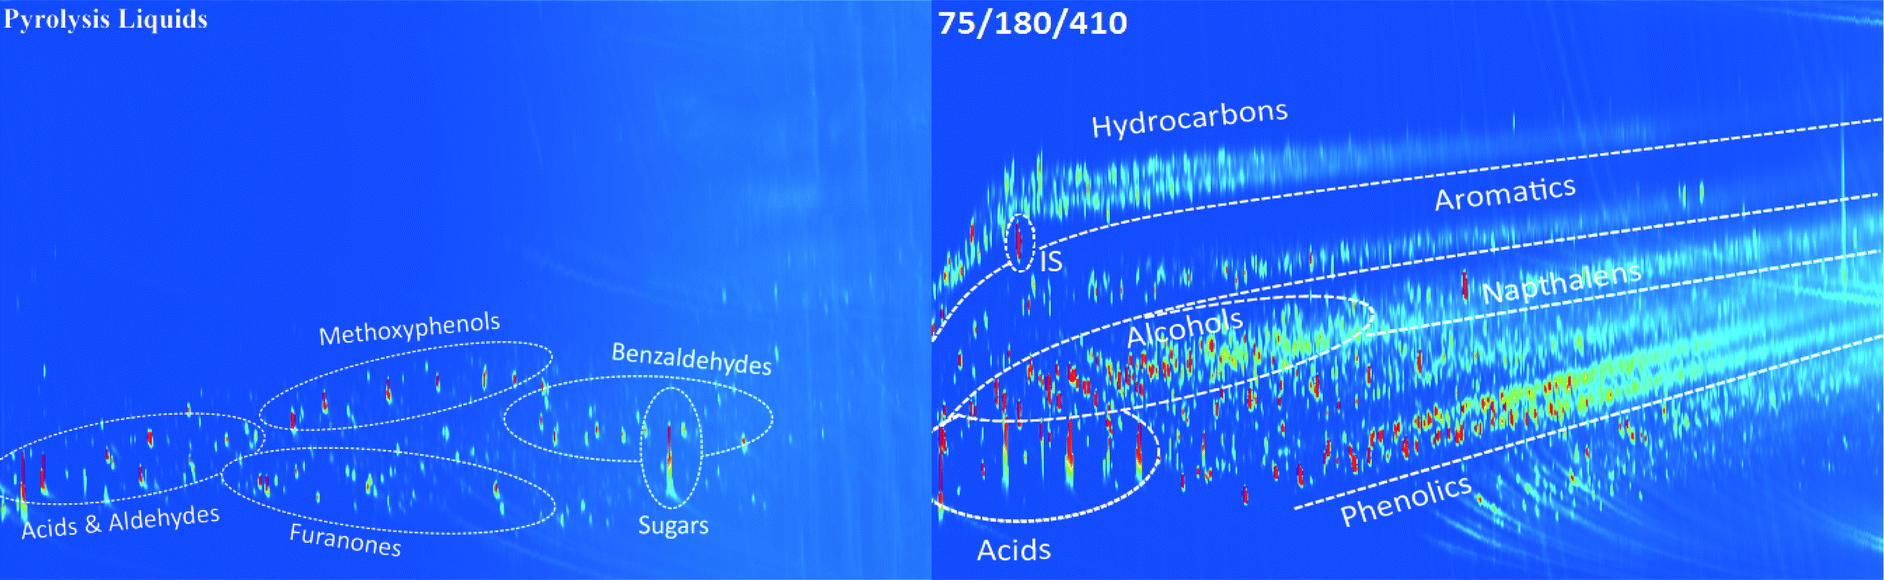 | ||
| Fig. 3 GC × GC spectra of a pyrolysis liquid and an upgraded oil obtained in the continuous set-up using the Ni–Cu catalyst (IS: internal standard, di-n-butyl ether). | ||
The amount of phenolic compounds increased at higher temperatures, particularly when comparing experiments at 310 and 410 °C (Fig. S2, ESI†), likely due to depolymerization reactions of the pyrolytic lignin fraction in the pyrolysis oil feed.
3.4.1.2 Molecular weight determination by GPC. The molecular weight distributions of the pyrolysis feeds and upgraded oils as determined by GPC are shown in Fig. 4 (continuous set up) and Fig. S3† (batch set-up). Particularly informative is the intensity of the long molecular weight tail. It is a distinct function of the hydrotreatment temperature and increases when the temperature is increased from 80 to 250 °C for the batch set-up and 180 to 310 °C for the continuous set-up. This is an indication of the formation of higher molecular weight products in this temperature range. At higher hydrotreatment temperatures (370–410 °C), the intensity of the higher molecular weight tail decreases, implying molecular weight breakdown as shown in Fig. 4 and S3.† The experimental trend is explained by the occurrence of limited polymerisation during the hydrotreatment between 80–250 °C for the batch set-up and 180–310 °C for the continuous set-up, followed by molecular weight breakdown by catalytic hydrocracking at elevated temperatures. However, the rate of polymerization is considerably lower than that for the benchmark Ru/C catalyst. For Ru/C, the Mw of the upgraded oil at 225 °C is 1050 g mol−1 (compared to 380 g mol−1 for the pyrolysis liquid feed).34 For the Ni–Cu catalyst, the Mw increased from 460 g mol−1 for the pyrolysis feed to a maximum of 610 g mol−1 for the upgraded oil at 230 °C. This suggests that the hydrogenation activity of the Ni–Cu catalyst is higher than that of the benchmark Ru/C at temperatures below 230°C, leading to less polymerisation (vide infra).
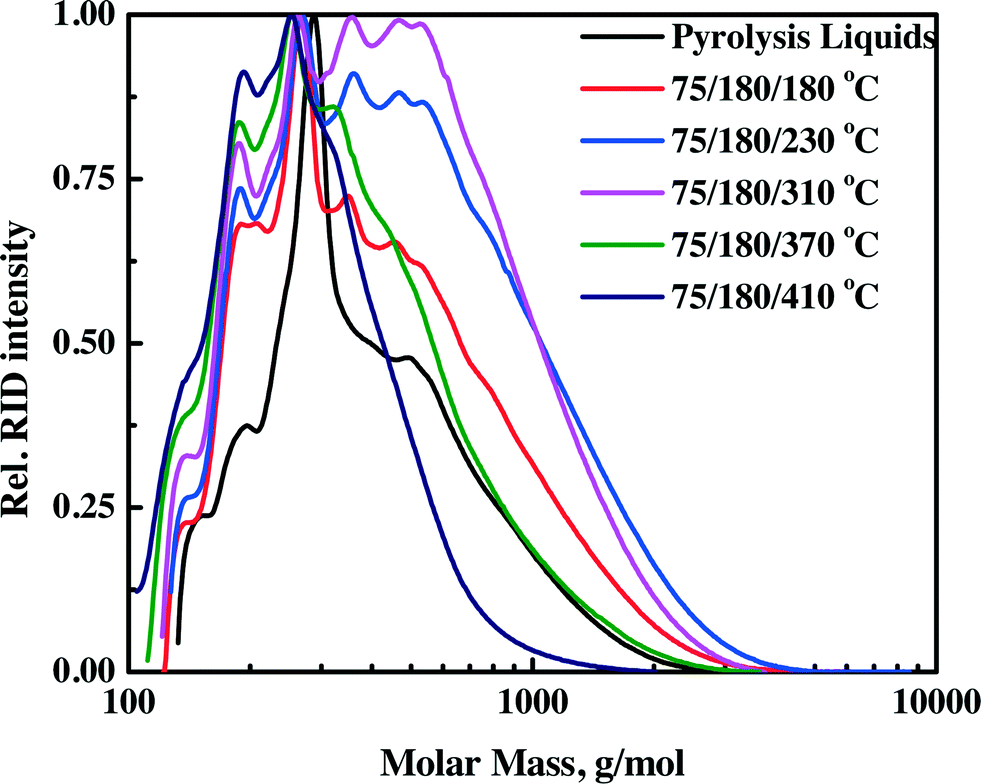 | ||
| Fig. 4 Molecular weight distributions by GPC analysis for pyrolysis liquids and upgraded oils in the continuous set-up. | ||
3.4.1.3 FT-IR spectroscopy. FT-IR spectra for the feed and the product oils obtained by the catalytic hydrotreatment over the Ni–Cu catalyst in the continuous set-up are presented in Fig. 5. The spectra are a clear function of the hydrotreatment temperature. The intensity of the absorption bands centered at about 3400 cm−1, assigned to hydroxyl groups and water, is reduced considerably for the products obtained at higher hydrotreatment temperatures, likely due to both the reduction of the amount of alcohols in the oils by deoxygenation/dehydration reactions and the lowering of the amount of water (from 22.6 down to 3.1 wt%) in the samples obtained at higher temperatures.
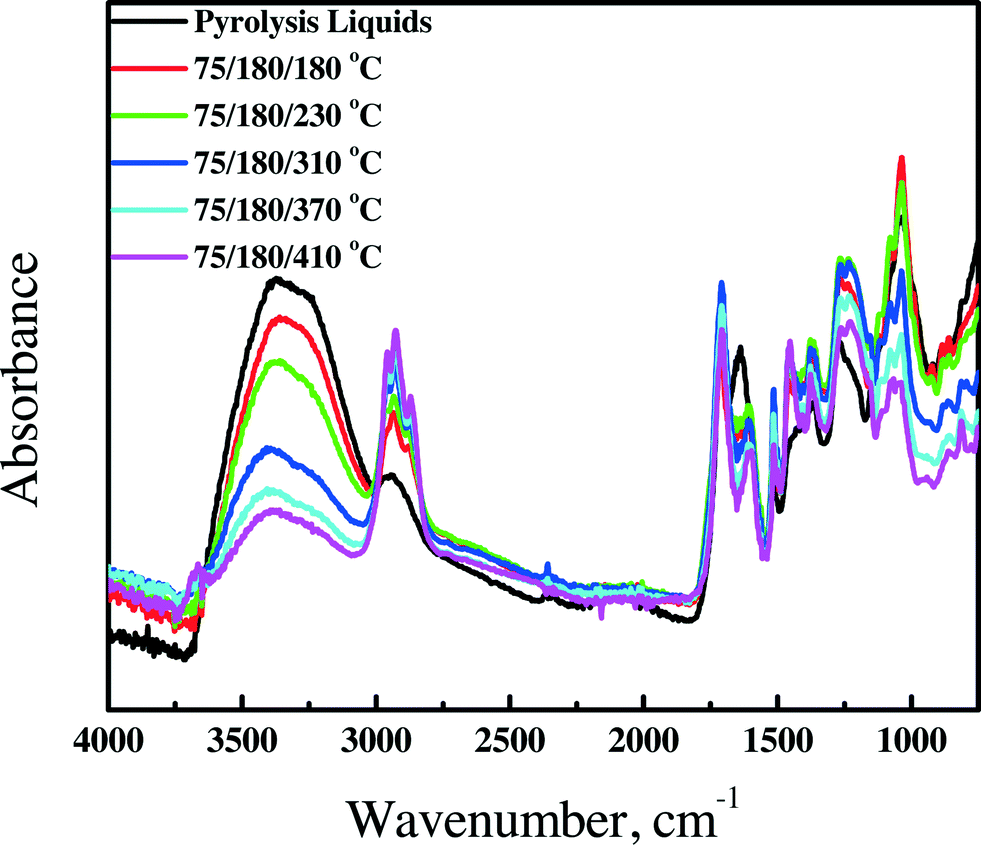 | ||
| Fig. 5 FT-IR spectra of pyrolysis liquids and upgraded oils using the Ni–Cu catalyst in the continuous set-up. | ||
The intensity of the C–H stretching vibrations between 3000 cm−1 and 2800 cm−1 and C–H deformation vibrations between 1450 cm−1 and 1350 cm−1 strongly increases as a function of hydrotreatment temperature, an indication of the formation of hydrocarbons at elevated temperatures, in line with the GC × GC data.
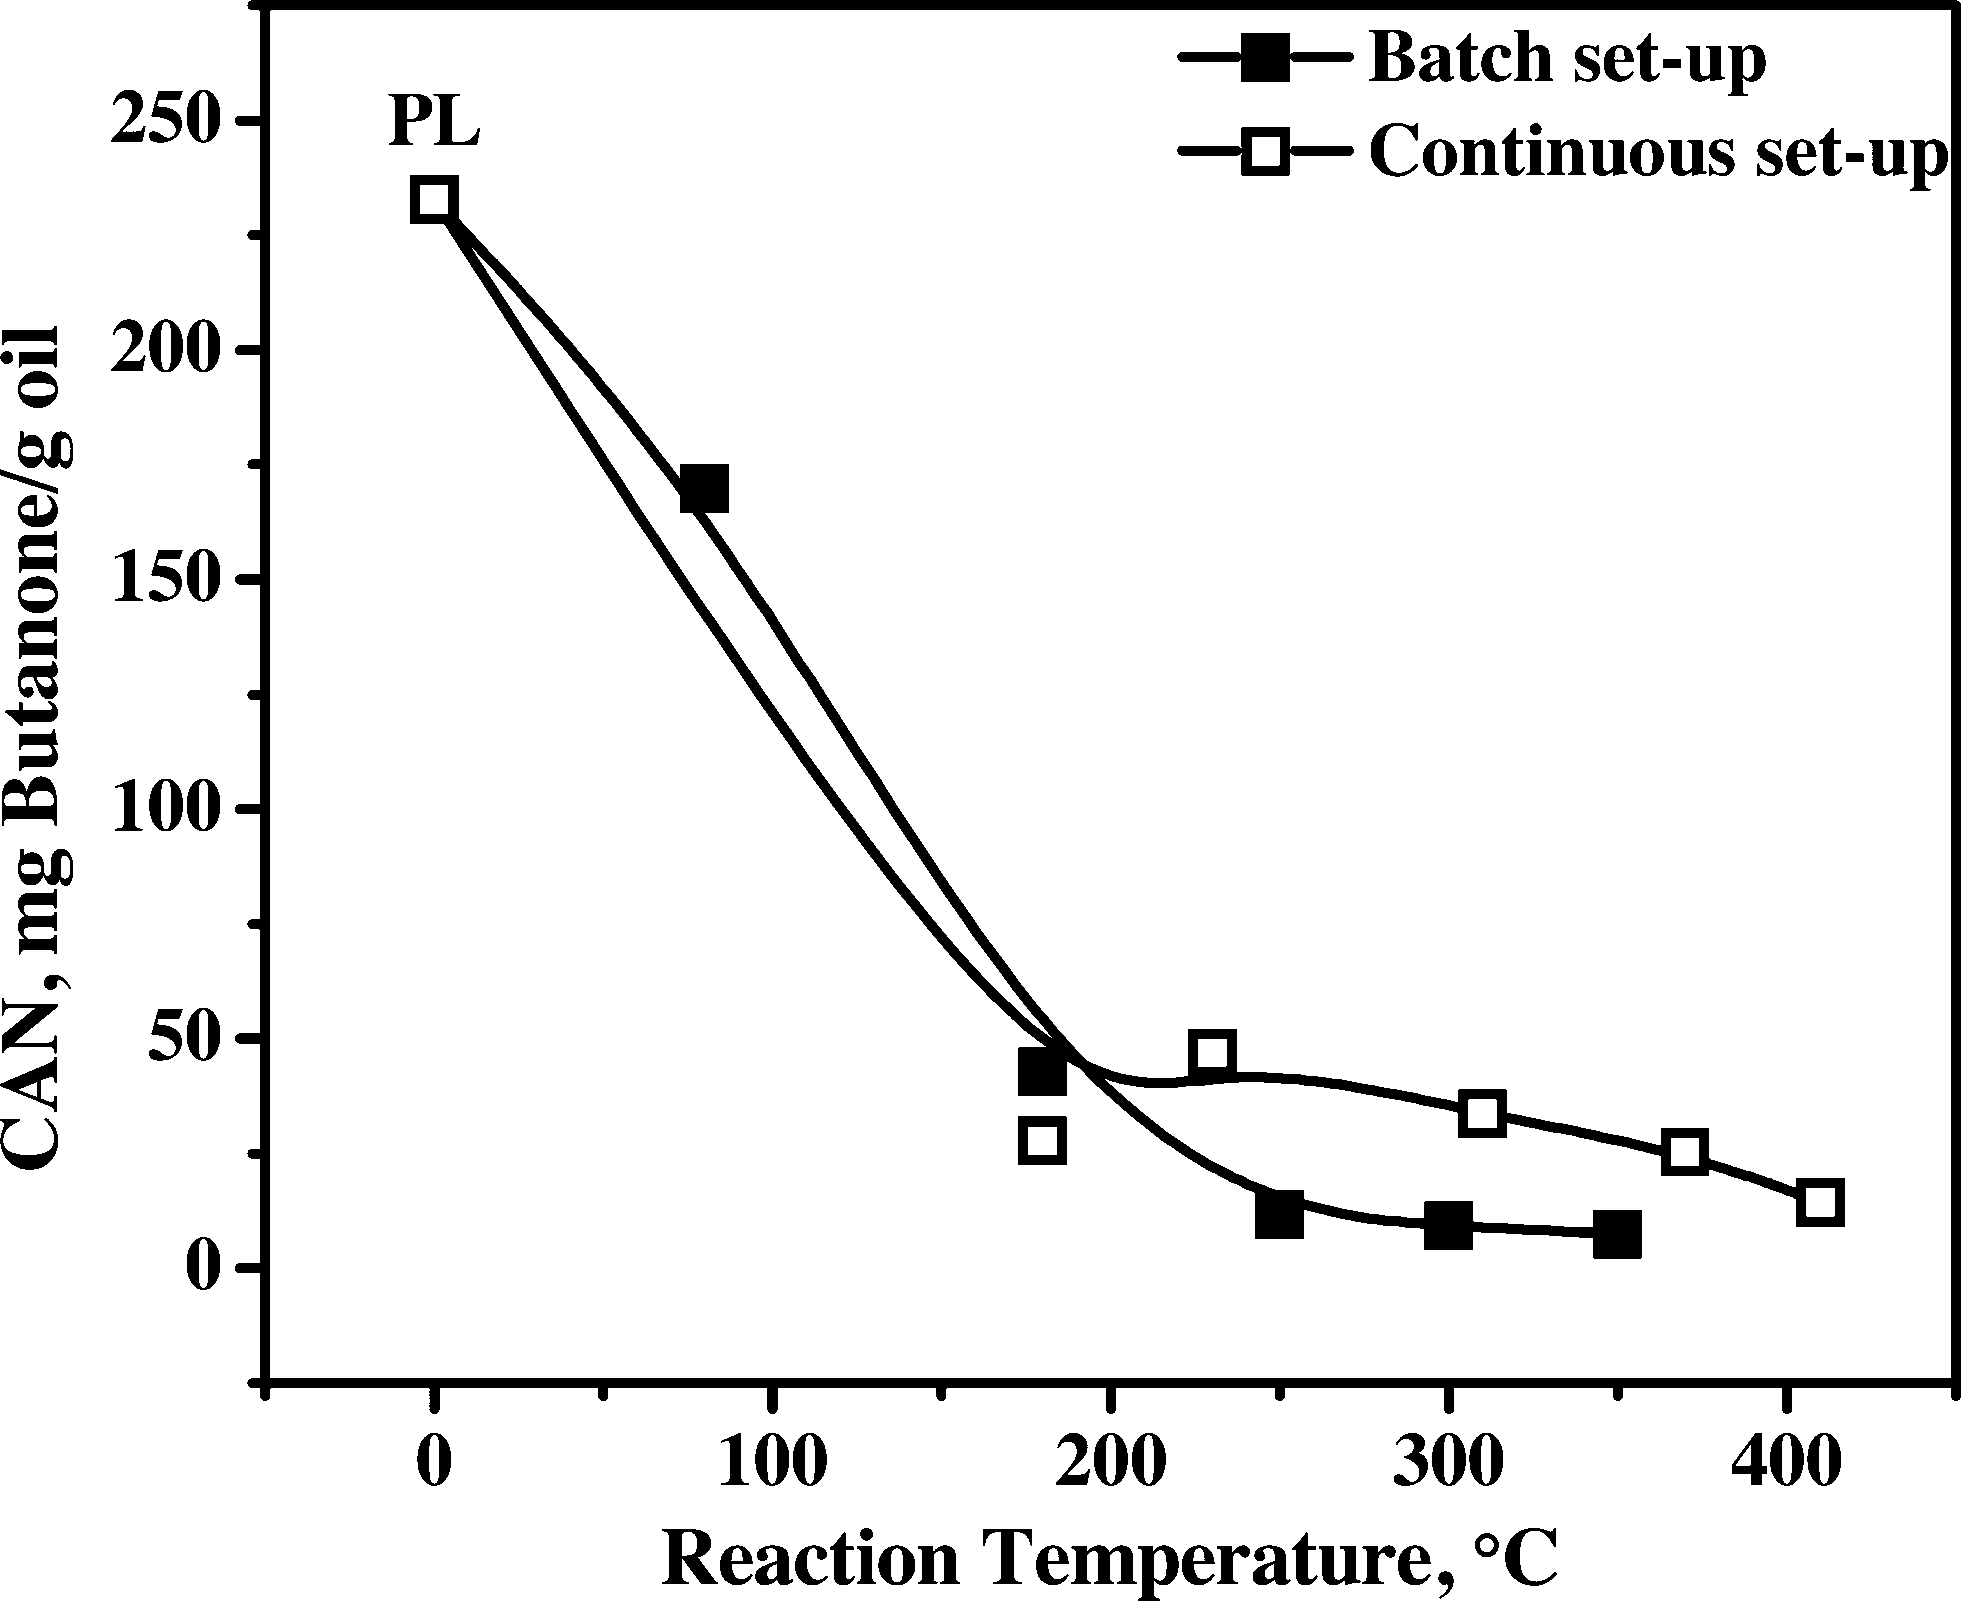
3.4.1.4 Carbonyl number (CAN). The carbonyl number (CAN) of all samples was determined by a titration procedure (see experimental details), and the results are presented in Fig. 6. The CAN for the feed is the highest (230 mg butanone per g oil), indicative of the presence of significant amounts of aldehydes (formaldehyde, hydroxyacetaldehyde) and ketones (dihydroxyacetone, furanones).
 | ||
| Fig. 6 Carbonyl number (CAN) of pyrolysis liquids and upgraded oils using the Ni–Cu catalyst. | ||
The CAN sharply decreases when the temperature is increased from 80 to about 180 °C for product oils obtained in the batch and continuous set-ups. Apparently, hydrogenation of carbonyl groups is occurring already at a hydrotreatment temperature as low as 80 °C, indicative of the high activity of the Ni–Cu catalyst for such carbonyl groups. At elevated hydrotreatment temperatures, the CAN number remains almost constant for oils obtained in the batch set-up, whereas it shows a slightly different trend in the continuous set-up. A possible explanation for these difference is the by far higher mass transfer rates in the batch set-up, leading to a lower possibility for mass transfer limitations, which will have a positive effect on the overall reaction rate and product selectivity of the process (see also Fig. 2).
3.4.1.5 Total acid number (TAN). The acidity of various samples gives valuable information on the reactivity of the organic acids as a function of the hydrotreatment temperature. In addition, a low acidity is an important product requirement, particularly to reduce corrosion rates of feed lines and storage vessels. The acidity of the product oils was determined by titration with a base, and the results are given in Fig. 7 for the oils obtained both in the batch and continuous set-ups.
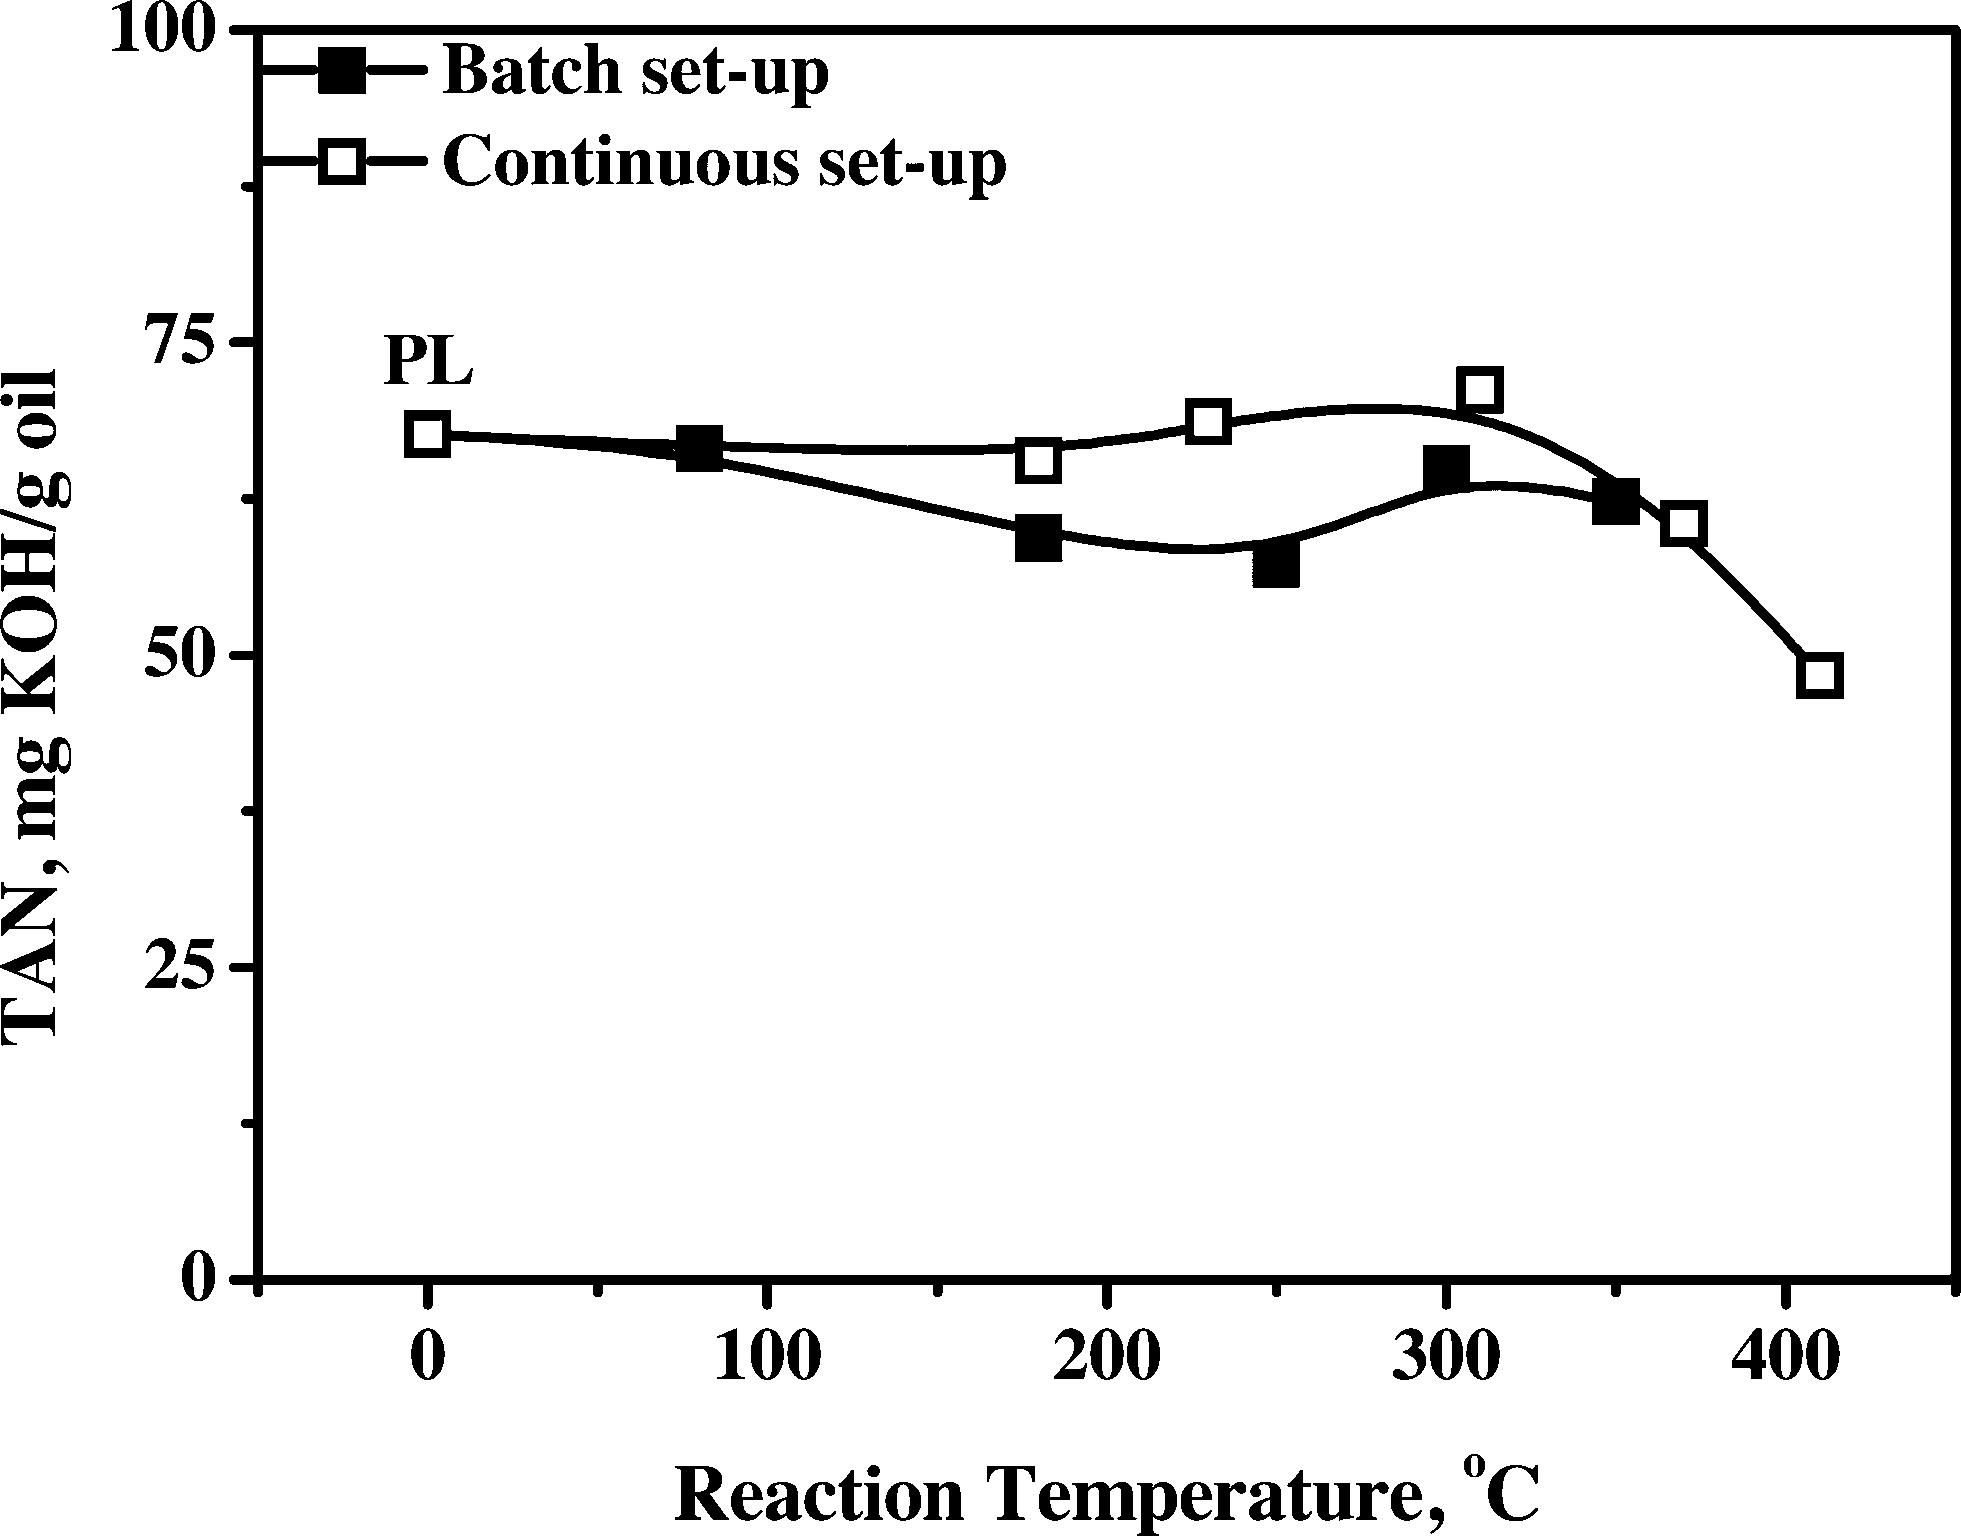 | ||
| Fig. 7 Total acid number (TAN) versus temperature of pyrolysis liquids and product oils obtained using the Ni–Cu catalyst. | ||
Product acidity is essentially constant until about 350 °C, indicative of the low reactivity of the organic acids. This is in line with the literature data showing that hydrogenation of organic acids, especially acetic acid, is a relatively slow reaction when using transition metal catalysts at temperatures between 110 and 290 °C with Ru > Rh ≈ Pt > Pd ≈ Ir > Ni > Cu.35 A slight reduction in the acid concentration, particularly for the batch data, is observed when going from 80 to 250 °C, followed by an increase when the temperature is further increased to 300 °C. It suggests the occurrence of an acid decomposition and acid formation pathway. The initial lowering can be due to the thermal and/or catalytic decomposition of particularly formic acid, which is known to be decomposed readily in the presence of Ni catalysts.24 The subsequent increase indicates the formation of organic acids, presumably due to catalytic conversion of carbohydrates and/or polyols, which are known to produce acids upon heating in the presence of catalysts.36 Thus, when aiming for oils with a low acidity, either elevated temperatures are required, beyond the range studied in this paper, or downstream processing of the product oil is required to remove organic acids, e.g. by liquid–liquid extraction37 or membrane separation.38
3.4.1.6 1H-NMR measurements. 1H-NMR measurements were performed on product oils from both batch and continuous experiments. The amounts of various classes of organic products in the oils were classified using a procedure reported by Ingram39 (see Tables 4 and S2† for details). Low field aldehyde protons, found in the region δ 10.0–8.0 ppm, were absent when the reaction temperature was above 200 °C. These findings are in line with the CAN measurements; aldehydes are very reactive at relatively low temperatures and hydrogenated to alcohols. The proton resonances in the region δ 4.2–6.4 ppm arising from carbohydrate-like molecules decrease significantly as the reaction temperature is increased, indicative of considerable conversion of sugars in the intermediate temperature regime. Of interest is also the increase in the intensity of the aliphatic protons between δ 0.0–1.6 ppm at higher hydrotreatment temperatures, due to the formation of hydrocarbons, in line with GC × GC and IR spectroscopy data (Fig. S2 and 5†).
| Chemical shift region (ppm) | Proton assignments | PL (% H) | 180 °C (% H) | 230 °C (% H) | 310 °C (% H) | 370 °C (% H) | 410 °C (% H) |
|---|---|---|---|---|---|---|---|
| a The temperatures in the 1st and 2nd stage reactors are 75 and 180 °C, respectively, and the temperature in the 3rd stage is given in the table. | |||||||
| 10.0–8.0 | –CHO, –COOH, downfield ArH | 1 | 0 | 0 | 0 | 0 | 0 |
| 8.0–6.8 | ArH, HC![[double bond, length as m-dash]](https://www.rsc.org/images/entities/char_e001.gif) C (conjugated) C (conjugated) |
4 | 2 | 3 | 3 | 4 | 4 |
| 6.8–6.4 | HCC (nonconjugated) |
3 | 5 | 4 | 4 | 4 | 4 |
| 6.4–4.2 | –CHn–O–, ArOH, HCC (nonconjugated) |
18 | 6 | 7 | 7 | 3 | 5 |
| 4.2–3.0 | CH3O–, –CH2O–, –CHO– | 28 | 30 | 26 | 13 | 7 | 4 |
| 3.0–2.2 | CH3(O)–, CH3–Ar, –CH2Ar |
12 | 15 | 14 | 17 | 18 | 20 |
| 2.2–1.6 | –CH2–, aliphatic OH | 22 | 17 | 18 | 21 | 21 | 21 |
| 1.6–0.0 | –CH3, –CH2– | 12 | 25 | 28 | 35 | 43 | 42 |
3.4.2.1 TG residue. The TG residue, obtained from TGA measurements on product oils, is a good indicator of the thermal stability of the product oil. It involves heating a sample to elevated temperatures (900 °C under nitrogen) and determination of the amount of solid residue at the final temperature. This value is a measure of the coking tendency of the oil, and a higher value indicates a lower thermal stability. As such, it is an alternative for the widely used Conradson Carbon Residue (CCR) or Micro Carbon Residue Test (MCRT) method in the petrochemical industry.40 The TG residues for the pyrolysis liquid feed and product oils are shown in Fig. 8 (continuous set-up) and Fig. S5† (batch set-up).
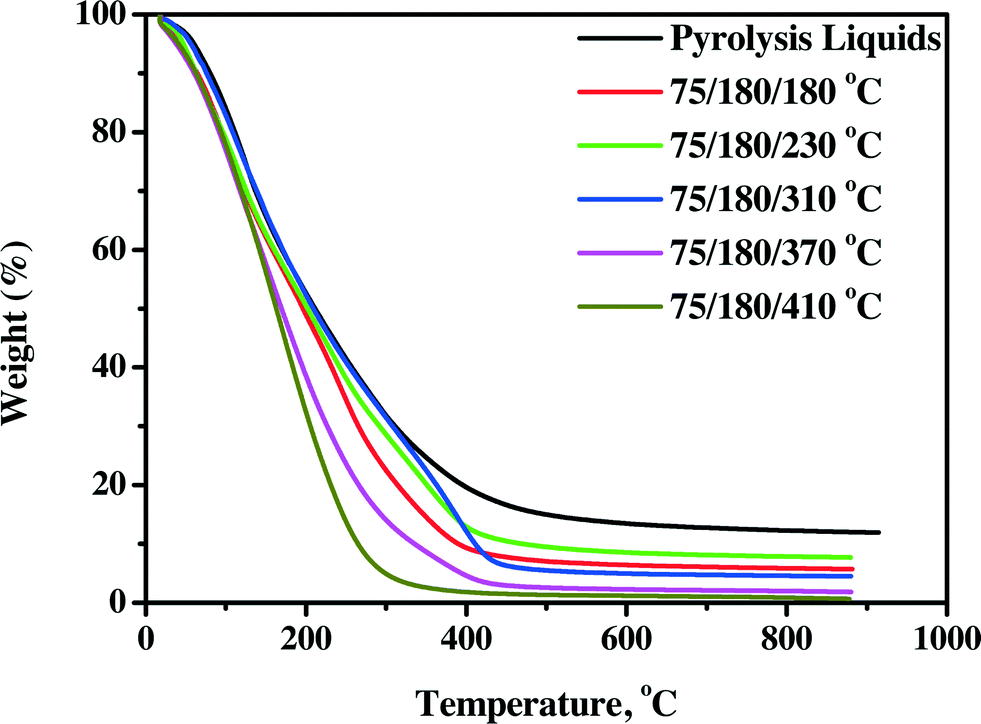 | ||
| Fig. 8 TG residues of pyrolysis liquids and product oils using the Ni–Cu catalyst in the continuous set-up. | ||
The TG residues are a clear function of the product oils, with product oils treated at the highest temperatures giving the lowest residue. Furthermore, it appears that all oils have a higher stability than the feed, which is a positive feature of the hydrotreatment process.
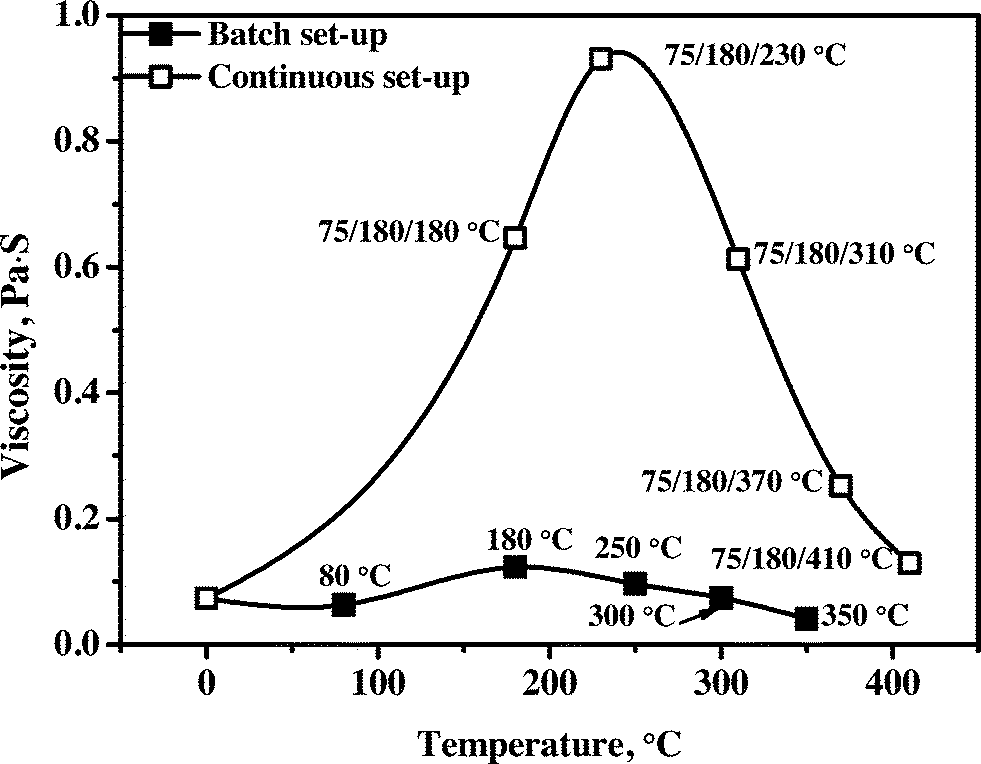
3.4.2.2 Viscosity. Viscosity is a very important product property for upgraded pyrolysis liquids and determines among others the ease of transportation and atomization in combustion engines. The viscosity versus hydrotreatment temperature profile for the product oils obtained in the batch and continuous set-ups are given in Fig. 9. A clear trend is visible, an initial increase to about 230 °C for the continuous (180 °C for the batch) set-up, followed by a sharp decrease when the hydrotreatment temperature is further increased to 410 °C (350 °C for the batch set-up), and the results are in good agreement with our previous studies using the Ru/C catalyst reported by Ardiyanti et al.34 This trend supports the reaction pathways proposed for the catalytic hydrotreatment of pyrolysis liquids,27 an initial increase due to polymerisation reactions followed by catalytic cracking of larger molecules at elevated temperatures (e.g. repolymerised products as well as the larger lignin fractions) leading to lower viscosities. The initial repolymerisation reactions are supported by molecular weight distributions of the product oils from both set-ups as shown in Fig. 4 and S3.† The oils obtained in the continuous set-up show a much higher viscosity when compared to those in the batch reactor. It indicates that the rate of the hydrogenation reaction was lower to some extent in the continuous set-up than that in the batch set-up, possibly due to mass transfer limitations as a result of the larger catalyst particle sizes used in the continuous set-up and lower mass transfer rates of hydrogen from the gas phase to liquid due to less efficient mixing.
 | ||
| Fig. 9 Viscosity of pyrolysis liquids and upgraded product oils using the Ni–Cu catalyst in the batch and continuous set-ups. | ||
3.5 Reaction network
Based on process studies using the Ru/C catalyst, a simplified reaction network for the catalytic hydrotreatment of fast pyrolysis liquids has been proposed by Venderbosch et al.27 (Scheme 1). In the initial phase of the hydrotreatment process, catalytic hydrogenation and thermal, non-catalytic polymerisation occur in parallel mode.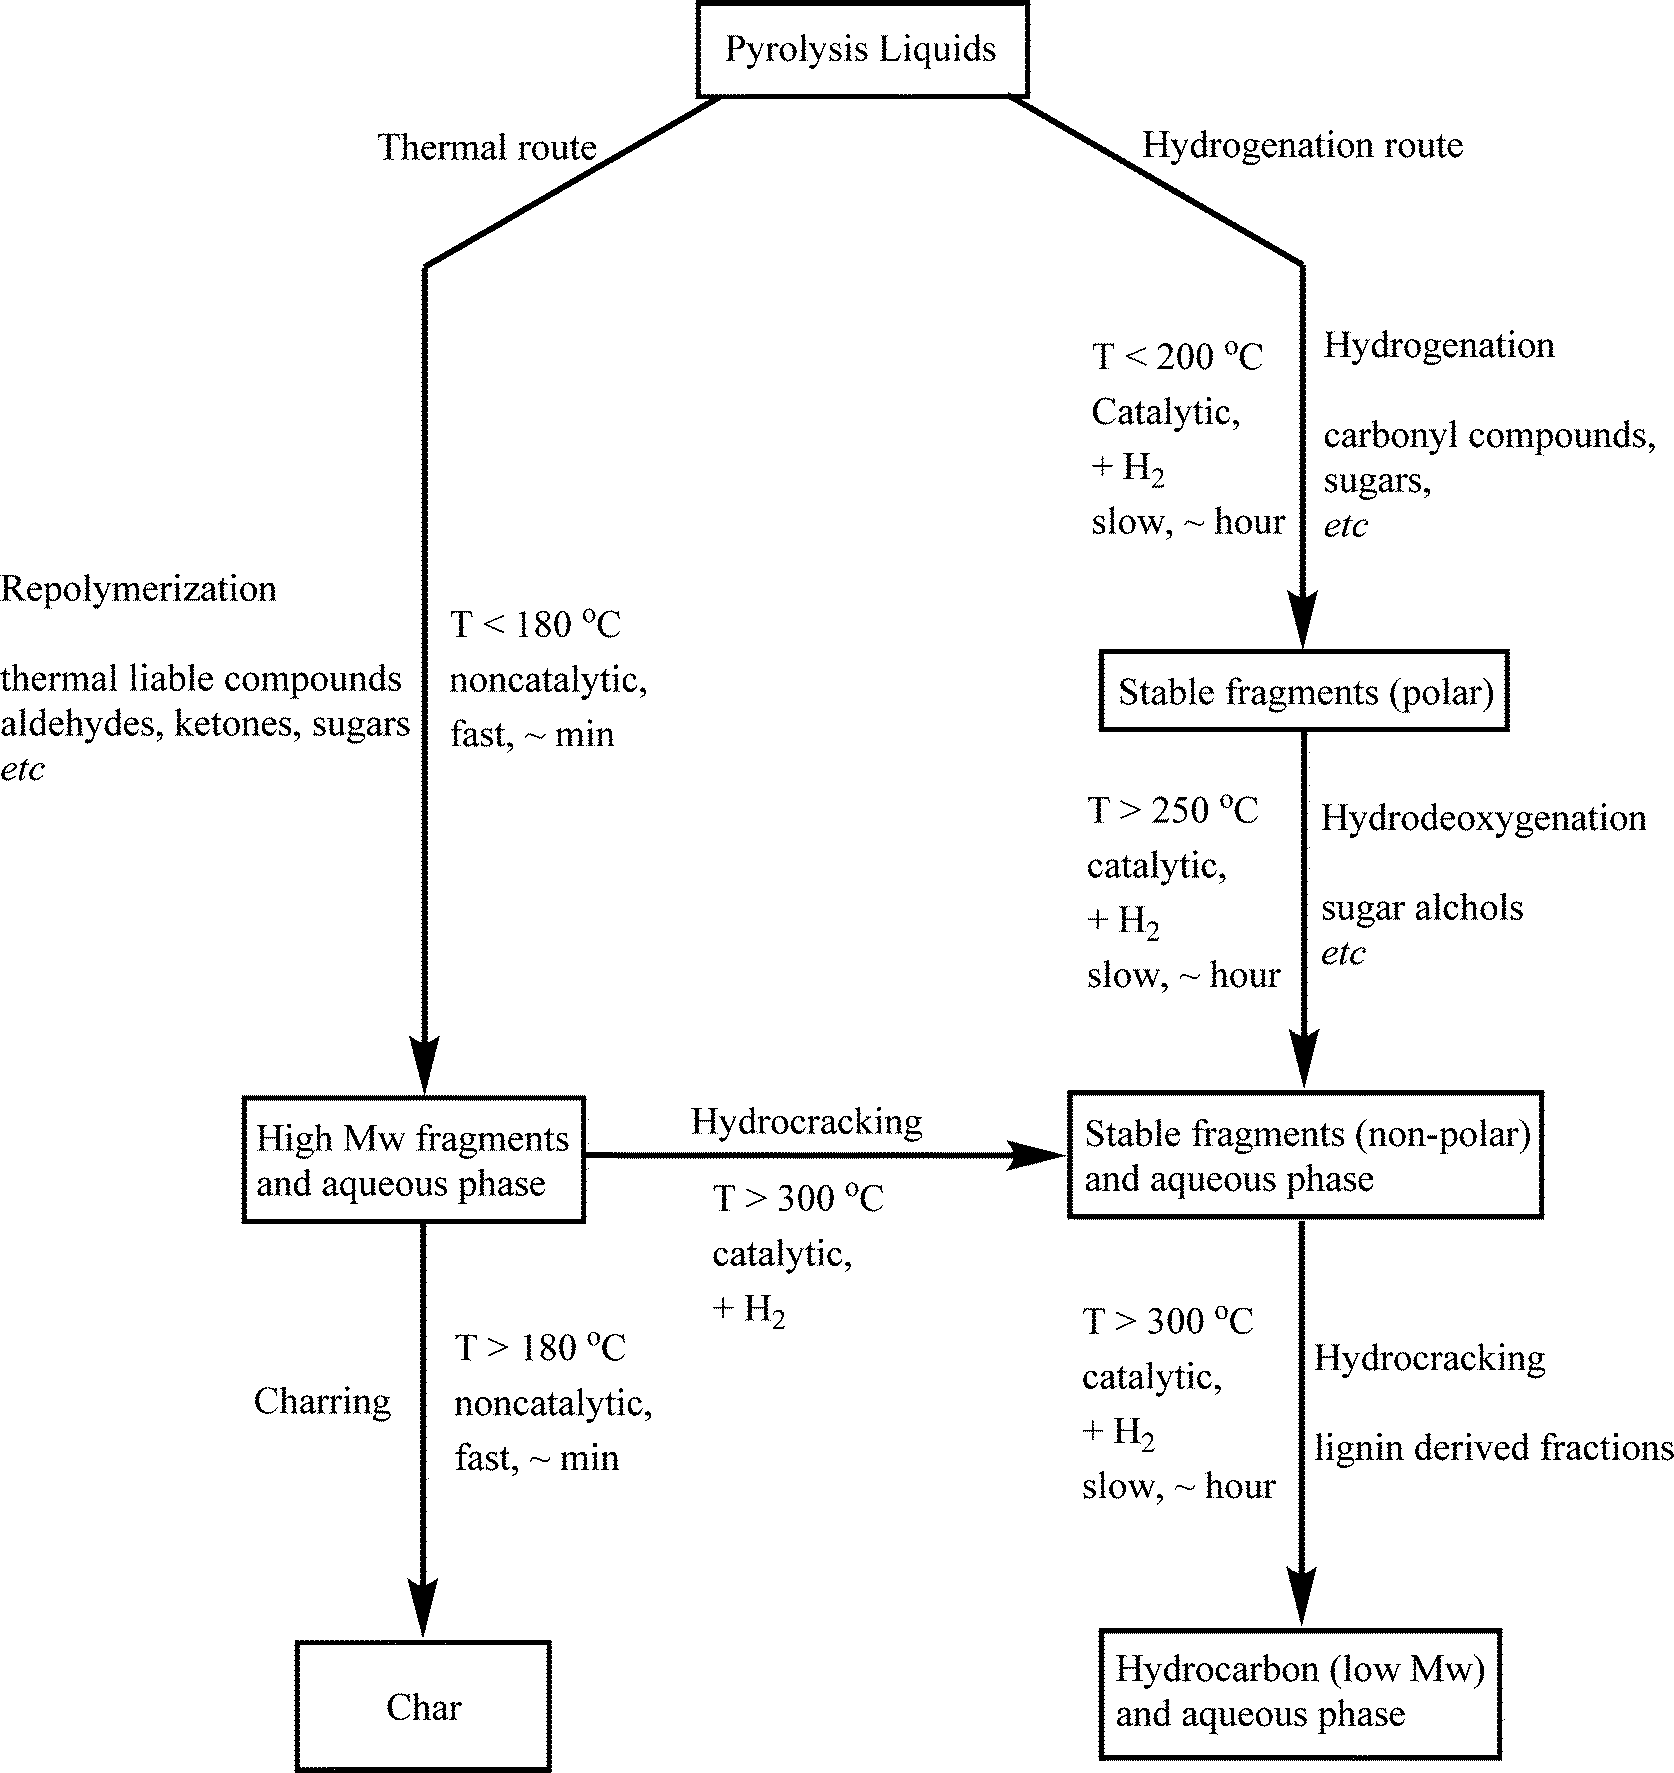 | ||
| Scheme 1 Proposed reaction pathway for the catalytic hydrotreatment of pyrolysis liquids.27 | ||
Thermal polymerisation leads to the formation of higher molecular weight fragments which may give char upon further condensation reactions. This route is as such not preferred, and the rate of polymerisation should be reduced as much as possible. The preferred pathway involves hydrogenation of the thermally labile components in the pyrolysis liquid feed to stable molecules that are not prone to polymerisation. Subsequent reactions (hydrodeoxygenation and hydrocracking) on a time scale of hours lead to products with reduced oxygen contents and ultimately to higher H/C ratios.
Compared to benchmark Ru/C, the use of the Ni–Cu/SiO2–ZrO2 catalyst leads to lower amounts of polymerisation products, as is evident from the GPC and viscosity data. This indicates that the Ni–Cu catalyst displays a higher hydrogenation activity, especially at low temperatures. The results obtained in this study also provide insight into the reactivity of various component classes in pyrolysis liquids versus temperature for the catalytic hydrotreatment. An overview is given in Fig. 10. Among all the organic classes, small aldehydes and ketones are readily converted, most likely hydrogenated to the corresponding alcohols at the temperature range lower than 180 °C, e.g. glycolaldehyde to ethylene glycol and hydroxyacetone to 1,2-propanediol. However, sugar fractions include monomeric and oligomeric compounds. Sugar monomers like glucose are known to be hydrogenated at temperatures as low as 80 °C to, among others, sorbitol, but a higher temperature of around 250 °C is required for the full conversion of anhydrosugars, e.g. levoglucosan, and sugar oligomers. Hydrocracking of the lignin fraction, especially the water insoluble pyrolytic lignin fraction, starts at temperatures higher than 300 °C, resulting in mono-phenolics followed by hydrocarbon formation upon further hydrodeoxygenation reactions. Among all the components in pyrolysis liquids, organic acids are the most persistent, and temperatures higher than 400 °C are required to observe reactivity.
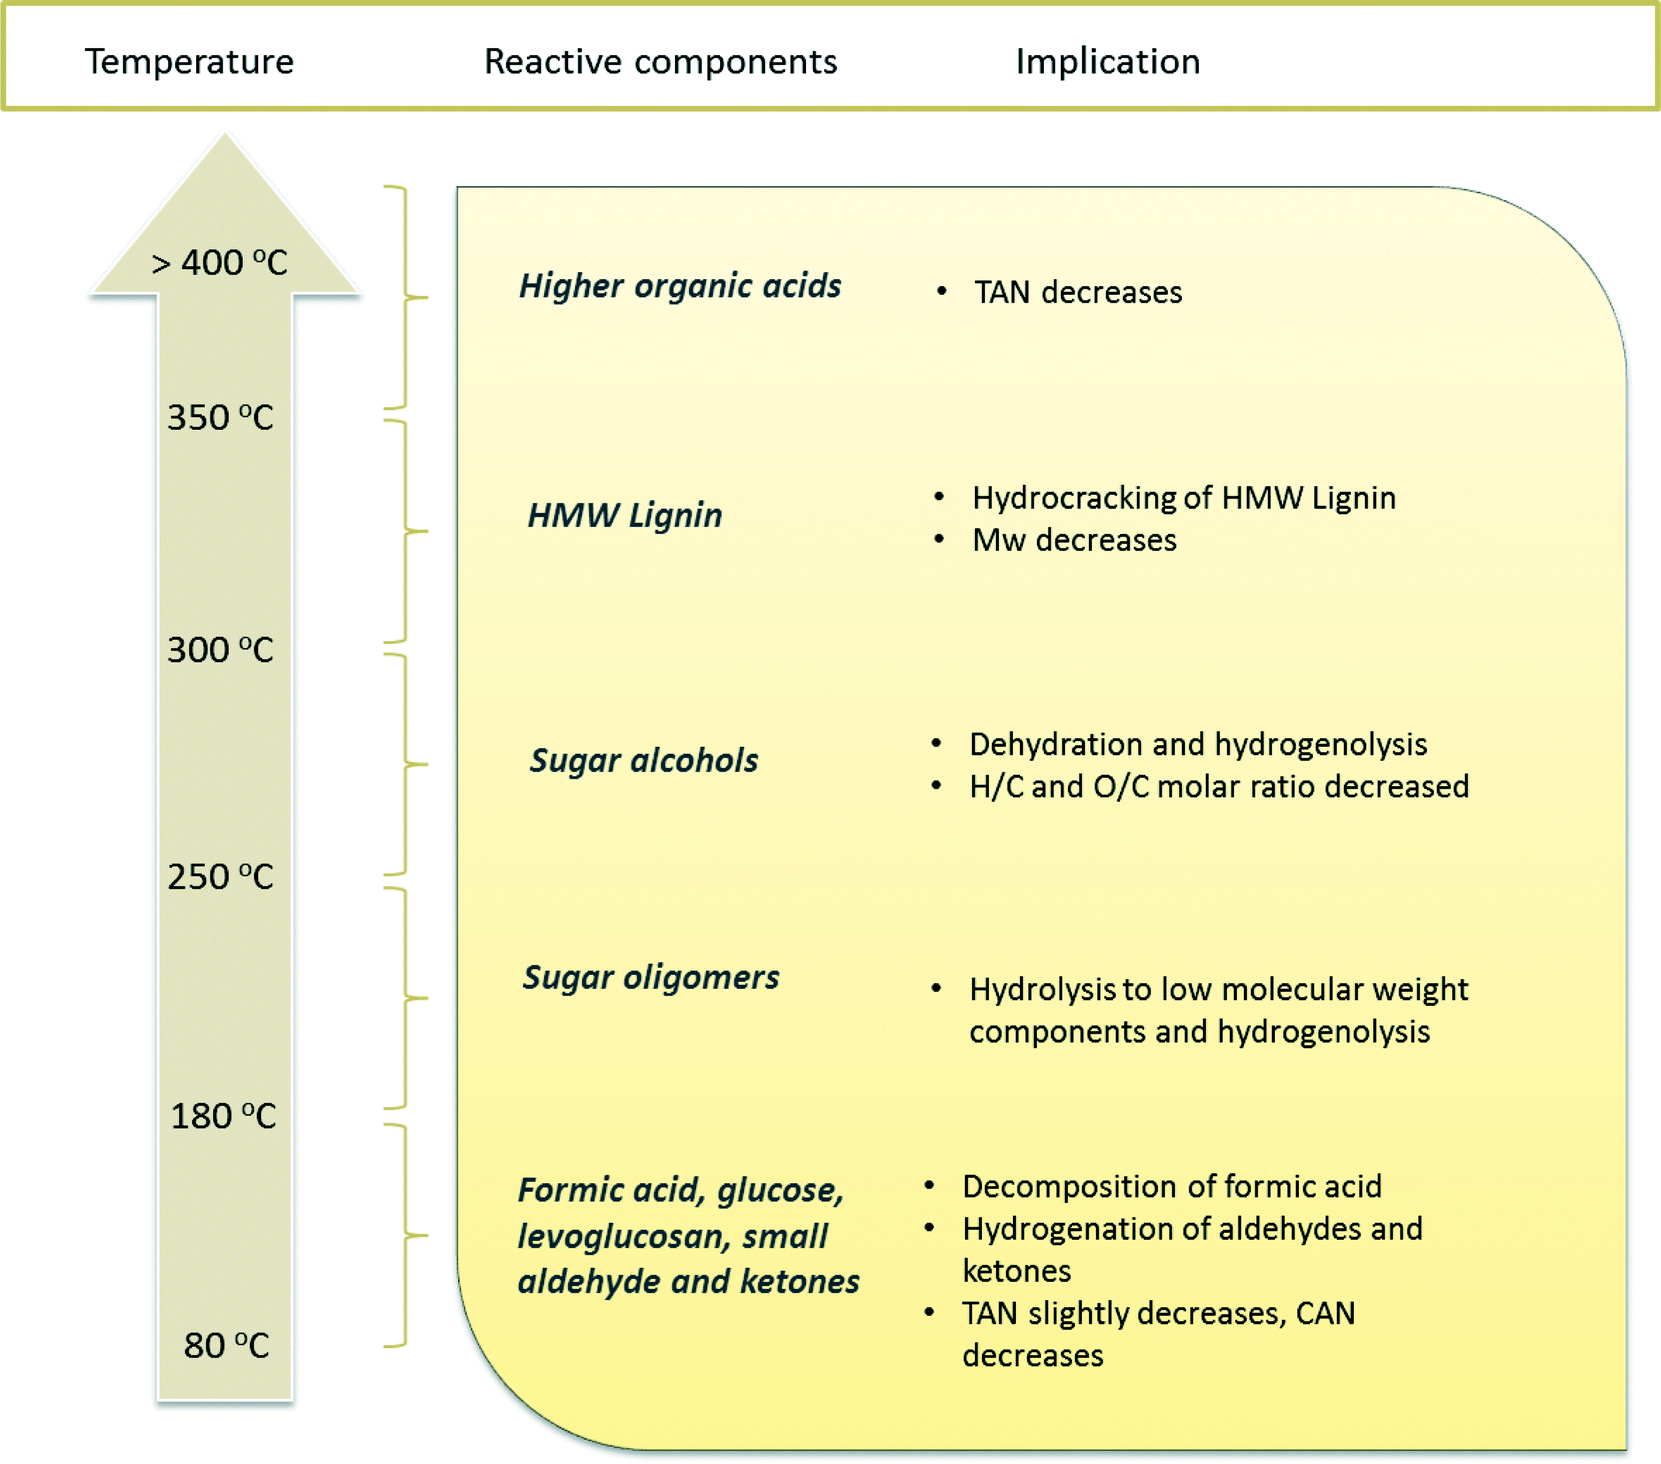 | ||
| Fig. 10 Reactivity of various organic component classes in pyrolysis liquids versus reaction temperature. | ||
3.6 Catalyst characterization
The fresh Ni–Cu/SiO2–ZrO2 catalyst was analyzed using TPR, nitrogen physisorption, CO chemisorption, XRD, XPS and TEM.Temperature-programmed reduction was used to determine the optimal temperature for the reduction of the NiCu/SiO2–ZrO2 catalyst prior to the reactions. The TPR profile recorded is given in Fig. 11 and reveals several reduction peaks. Those in the temperature range of 225–300 °C correspond to reduction of Cu(II) into metallic Cu(0).41 Besides, part of the Ni(II) is also reduced in this temperature region due to the presence of copper, and this effect was discussed in detail previously.18 Additionally, the reduction of weakly bound NiO with a defect structure is also possible at these temperatures, and in this case, the reduction is facilitated and takes place at lower temperatures as compared to well-crystallized bulk NiO.42 A broad reduction peak with a maximum at 400 °C (Fig. 11) is typical for catalysts prepared by the sol–gel technique and most likely indicates the presence of strong metal–support interactions as a result of the formation of hardly reducible nickel silicates.19,43
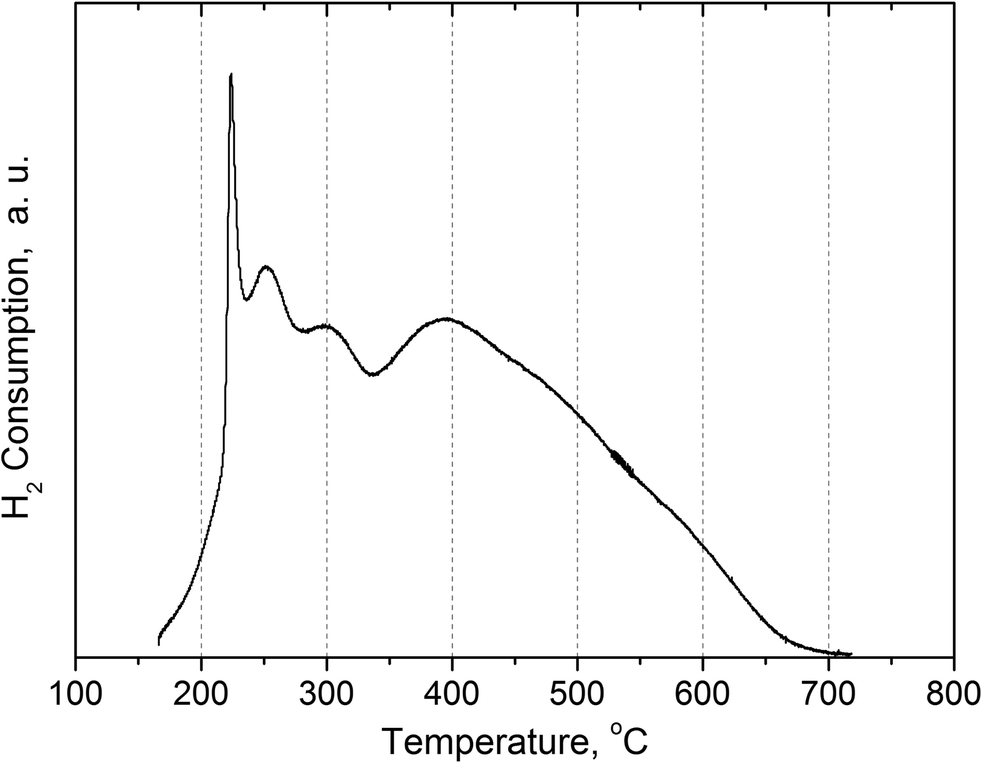 | ||
| Fig. 11 Temperature programmed reduction of the Ni–Cu/SiO2–ZrO2 catalyst. | ||
Table 5 presents the structural characteristics of the Ni–Cu/SiO2–ZrO2 catalyst determined by N2 physisorption and an estimation of the specific surface area of the active component by CO chemisorption. Prior to analyses, the catalyst was reduced and passivated according to the procedure given in section 2.2. For the active surface measurements by CO chemisorption, the sample was additionally reduced in situ (section 2.6) to remove a potentially passivating film layer.
| Texture characteristics (by BET method) | Active component (AC) surface measurement (by CO chemisorption) | |||
|---|---|---|---|---|
| A BET, m2 gcat−1 | V pore, cm3 gcat−1 | Average pore diameter, Å | μmol CO gcat−1 | A AC, m2 gcat−1 |
| a Prior to analysis, the catalyst was reduced in a flow of H2 (200 cm3 min−1, 0.1 MPa) for 2 h and passivated by ethanol (section 2.2). | ||||
| 188 | 0.19 | 41 | 378 | 13 |
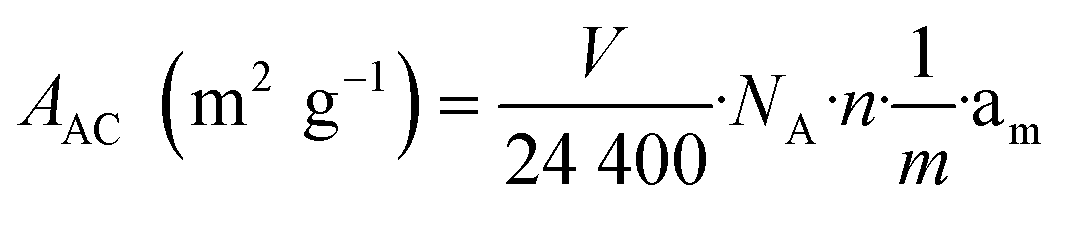
The data in Table 5 show that the catalyst possesses a rather high specific surface area of around 188 m2 gcat−1, which is in agreement with previous studies20 and is accounted for by the formation of highly dispersed metallic particles and silicate-like structures in the catalyst due to the sol–gel method applied. The specific surface area of the active component (metallic Ni) in the reduced catalyst was calculated based on the amount of chemisorbed CO using the following equation:
 | (3) |
It should be taken into account that in fact the adsorption of CO molecules onto Ni-containing catalysts can be rather complicated.44,45 The stoichiometry of adsorption actually is a function of the dispersion of metallic particles, metal loading, metal crystallite sizes, and the interaction between the metal and the support. Several modes of adsorption have been specified such as linear, bridged and carbonyl type adsorption, which may occur simultaneously. In addition, the formation of nickel carbonyls and significant levels of chemical and physical adsorption of CO on the support material can provide additional complications.45 As such,45 this method should not be considered as a precise technique for measuring the active nickel surface. Nonetheless, it can be used for some estimations and it is especially useful when comparing a number of catalytic systems with different properties.
In the present study, an estimation of the active component surface was made using the assumption that linear CO adsorption dominates in the Ni–Cu/SiO2–ZrO2 catalyst. The specific surface area of the active component (AAC) was calculated by eqn (3) using a stoichiometric factor of 1, and the results are given in Table 5. Thus, ABET is significantly higher than AAC, which is associated with incomplete reduction of the catalyst, as confirmed by XRD. Thus, a large proportion of nickel in the catalyst bulk is still in the form of silicate-like species after reduction.
XPS was applied to determine the elemental composition of the catalyst surface. Two forms of the NiCu/SiO2–ZrO2 catalyst were considered: (i) the catalyst in the initial oxide form and (ii) the catalyst after reductive treatment in hydrogen at 400 °C (section 2.2), followed by an additional in situ reductive activation in the high-pressure cell of the XPS machine at 350 °C prior to recording of the spectra.
XPS spectra of the NiCu/SiO2–ZrO2 catalyst reveal peaks corresponding to Ni, Cu, Si, Zr and O atoms. Fig. 12 presents the Ni2p and Cu2p3/2 core-level spectra before and after catalyst reduction. It is shown that initially (Fig. 12a) nickel and copper are in the oxidised Ni2+ and Cu2+ states. The Ni2p core-level spectrum of the oxidized catalyst (Fig. 12, Ni2p, a) shows two relatively sharp peaks corresponding to the main doublet of Ni2p3/2 and Ni2p1/2 at 856.5 and 874 eV along with two intense lines of shake-up satellites shifted by 5–6 eV towards higher binding energies. Such shake-up satellites are ascribed to multiple electron excitation typical of Ni2+ species, which are absent in the case of metallic Ni or Ni3+ species.46,47 It should be noted that the position of the Ni2p3/2 line (856.5 eV) is also typical for nickel cations in a silicate structure. For example, the Ni2p3/2 binding energies of NiO, Ni(OH)2 and nickel silicates (NiSiO3 and Ni2SiO4) lie in the ranges of 853.8–854.6, 855.5–855.9 and 856.3–856.7 eV, respectively.47,48 The Cu2p3/2 spectrum (Fig. 12, Cu2p3/2, a) shows peaks at a high binding energy value (935 eV) and a shake-up satellite, which clearly indicates that copper in the oxidised catalyst is present in the Cu2+ state and not in the metallic Cu0 or Cu1+ state.49
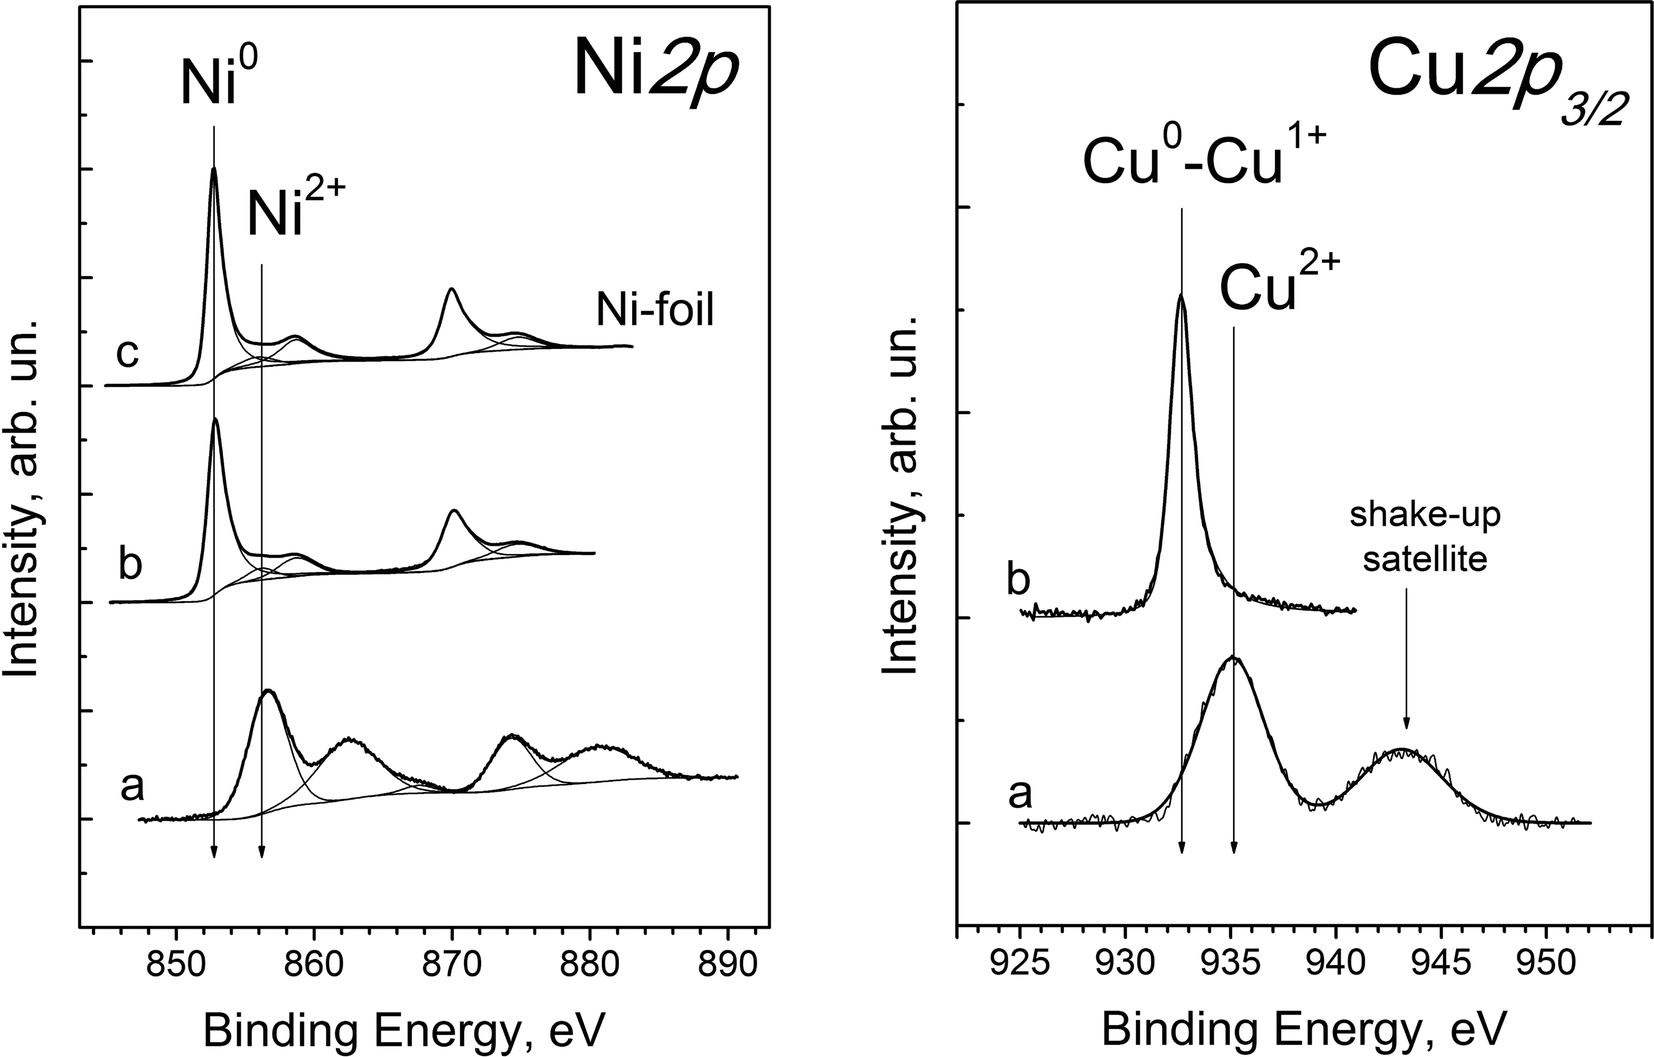 | ||
| Fig. 12 Ni2p and Cu2p3/2 core-level spectra of the NiCu/SiO2–ZrO2 catalyst: (a) in oxide form and (b) after reduction at 400 °C in a flow of H2 (200 cm3 min−1 at 0.1 MPa) as described in section 2.2 and additional reduction in situ in the spectrometer chamber (350 °C, 0.1 MPa H2). The Ni2p spectrum for Ni-foil (c) is provided for comparison. | ||
Catalyst treatment under a hydrogen atmosphere results in the reduction of both nickel and copper cations into the metallic state. The Ni2p XPS spectrum after the reductive treatment (Fig. 12, Ni2p, b) is almost identical to that of Ni foil (Fig. 12, Ni2p, c) and reveals peaks at 852.7 eV and 870.0 eV, corresponding to Ni2p3/2 and Ni2p1/2 of metallic nickel. Additional low intensity peaks are due to plasmon exitation.50 Thus, it is shown that all nickel in the near-surface layer is converted into the Ni0 state after the reductive treatment of the NiCu/SiO2–ZrO2 catalyst.
The Cu2p core-level spectrum of the reduced catalyst (Fig. 12, Cu2p3/2, b) shows a symmetric narrow peak at 932.7 eV, typical of Cu0 and Cu1+ states of copper, and a shake-up line is absent.47,48,51 For a more precise determination of the copper state, the Auger parameter α was used, which is equal to the sum of the Cu2p3/2 binding energy and the CuLMM kinetic energy corresponding to the maximum of the Auger spectrum.52 According to the literature data, the Auger parameter of bulk metallic copper and Cu2O lies in the range of 1851.0–1851.4 and 1848.7–1849.3 eV, respectively.49,51 For the reduced NiCu/SiO2–ZrO2 sample, this parameter is equal to 1850.7 eV, which corresponds to the Cu0 state. The small deviation between our experimental α value and that of bulk metallic copper can be due to either the high dispersion of Cu particles or the formation of a NiCu solid solution in NiCu/SiO2–ZrO2, which is in agreement with XRD data for this catalyst. As found for nickel, all copper species in the near-surface layer of the catalyst after the reductive treatment are in the reduced Cu0 state, and no oxidized forms are detected.
The Si2p spectra of the catalysts in both oxidised and reduced forms (not provided for brevity) show a single, broad symmetric peak at 103.3 eV, corresponding to the Si4+ state. This line was used as an internal standard for the calibration of the binding energy scale. Using XPS, it is difficult to distinguish between Si in the form of silicates and SiO2. The Si2p binding energies given in the literature for SiO2 and nickel silicates are 103.3–103.8 eV (ref. 53) and 103.0–103.5 eV,48 respectively. Therefore, a more precise determination of the neighboring species of Si4+should be made by means of IR or NMR spectroscopy, which was not applied in this study. The Zr3d core-level spectra (not provided for brevity) show one doublet (Zr3d5/2–Zr3d3/2) with a Zr3d5/2 binding energy of 182.0 eV, which is typical of Zr4+ species. For example, stoichiometric ZrO2 oxide shows a Zr3d5/2 binding energy in the range of 181.9–182.3 eV.54
The XRD patterns of the fresh Ni–Cu/SiO2–ZrO2 catalyst in the oxidised and reduced state are shown in Fig. 13. The XRD pattern of the fresh oxidised catalyst shows broad peaks at 2θ values of 37°, 43° and 63°, representing the 111, 200 and 220 reflections, respectively, of the NiO phase with a slight shift of peaks relative to the reference data.19 The shape and positions of these peaks are typical for a Ni–Cu catalyst prepared by a sol–gel technique.19,55 The fact that the NiO peaks are slightly shifted towards lower angles and are differently broadened could be explained by an anisotropic form of the NiO crystallites. Moreover, the presence of NiO species strongly interacting with SiO2 by the formation of silicate-like structures can also contribute to these peaks.19,56 It is also possible that CuO reflections on the XRD pattern of the fresh catalyst (Fig. 13a) overlap with the (111) (2θ of 37°) and (220) (2θ of 63°) reflections from NiO and contribute to the NiO peak intensities.18 An average NiO crystallite size of around 35 Å was calculated based on the broadness of the NiO (220) reflection at a 2θ value of 63° using the Scherrer equation.18 The absence of any reflections around 2θ values of 22° and 26.6° indicates that SiO2 is present in an amorphous phase.56
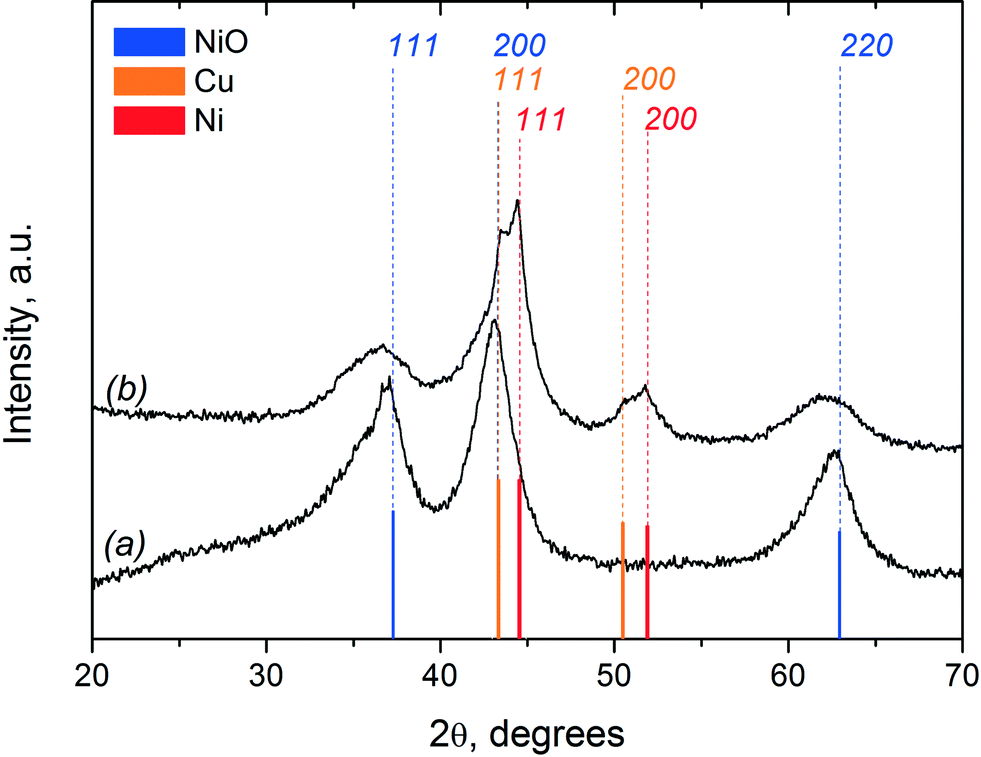 | ||
| Fig. 13 XRD diffraction patterns of the fresh Ni–Cu/SiO2–ZrO2 catalyst in (a) oxidised and (b) reduced states. | ||
After catalyst reduction, the XRD pattern changes significantly (Fig. 13b). It reveals reflections corresponding to metallic Ni and Cu. In addition, a residual NiO phase is also visible, pointing towards incomplete reduction of the catalyst. This result is in agreement with the TPR data, which indicated prolonged reduction of the catalyst up to 700 °C (Fig. 11). Bar diagrams corresponding to the XRD data of the specific phases (Ni, Cu, NiO) are provided in Fig. 13 as well for comparison. The crystal size of the metallic Ni species was estimated using the (111) reflection at 44.5° and is about 40 Å for the catalyst after reduction. This slight increase in the average Ni particle size from 35 Å (for NiO crystallites in the oxidized catalyst) to 40 Å (for metallic Ni crystallites in the reduced sample) indicates that significant agglomeration upon reduction of the catalyst does not occur. Fig. 13 shows that the width of the NiO reflections increases after reduction, indicative of a decrease in the NiO crystallite sizes. A possible explanation is that larger NiO particles are more easily reduced in comparison to the smaller ones. In the case of smaller particles, a stronger interaction with the support is predicted due to the formation of silicate-like structures. Higher temperatures are required for their reduction, which is also in agreement with the TPR data.
In the reduced catalyst, the reflexes corresponding to metallic Ni and Cu are somewhat shifted in comparison to the reference data for these phases. The lattice parameters of metallic Ni and Cu in the reduced NiCu/SiO2–ZrO2 catalyst were estimated using the 111 and 200 reflections of each metal. In the case of Ni, the lattice parameter is 3.531 Å, compared to a reference value of 3.523 Å. For metallic Cu, the estimated lattice parameter is 3.602 Å, which also differs from the reference (3.615 Å). These observations indicate the formation of a metallic solid solutions enriched by Ni and Cu. The data obtained are in good agreement with the observation of a more facile reduction of nickel species in the presence of copper, which we assume to result in the formation of NixCu1−x solid solutions.
The HRTEM images of the freshly reduced and passivated NiCu/SiO2–ZrO2 catalysts are presented in Fig. 14. The freshly reduced catalyst shows a lamellar structure, probably consisting of oxide–silicate species typical of sol–gel Ni-based catalysts.18 This lamellar structure is preserved after reduction (hydrogen atmosphere up to 400 °C), which is in agreement with the TPR and XRD data (vide supra). NiO particles with a well-defined shape cannot be distinguished, indicating a high dispersion and interaction with the silica matrix. This is consistent with the XRD patterns of the fresh catalyst, which reveal broad reflections corresponding to the NiO phase (Fig. 13). Nickel, copper and silicon are uniformly distributed over the catalyst; however, this does not apply to zirconium, which is likely due to the preparation technique used.20 After the reductive treatment, images of the catalyst reveal regions with metallic Ni particles. The size of some of these particles is up to 25–30 nm, although their shape and borders are not sufficiently defined for an accurate size distribution. It is proposed that these particles could be formed by the reduction of NiO species weakly interacting with the silica (in line with the TPR results). They are likely also responsible for metallic Ni reflections present in the reduced catalyst (Fig. 13b). The broadness of these reflections indicates the presence of highly dispersed metallic species. These are likely not clearly distinguishable by HRTEM due to their shape and the interaction with the silica matrix.
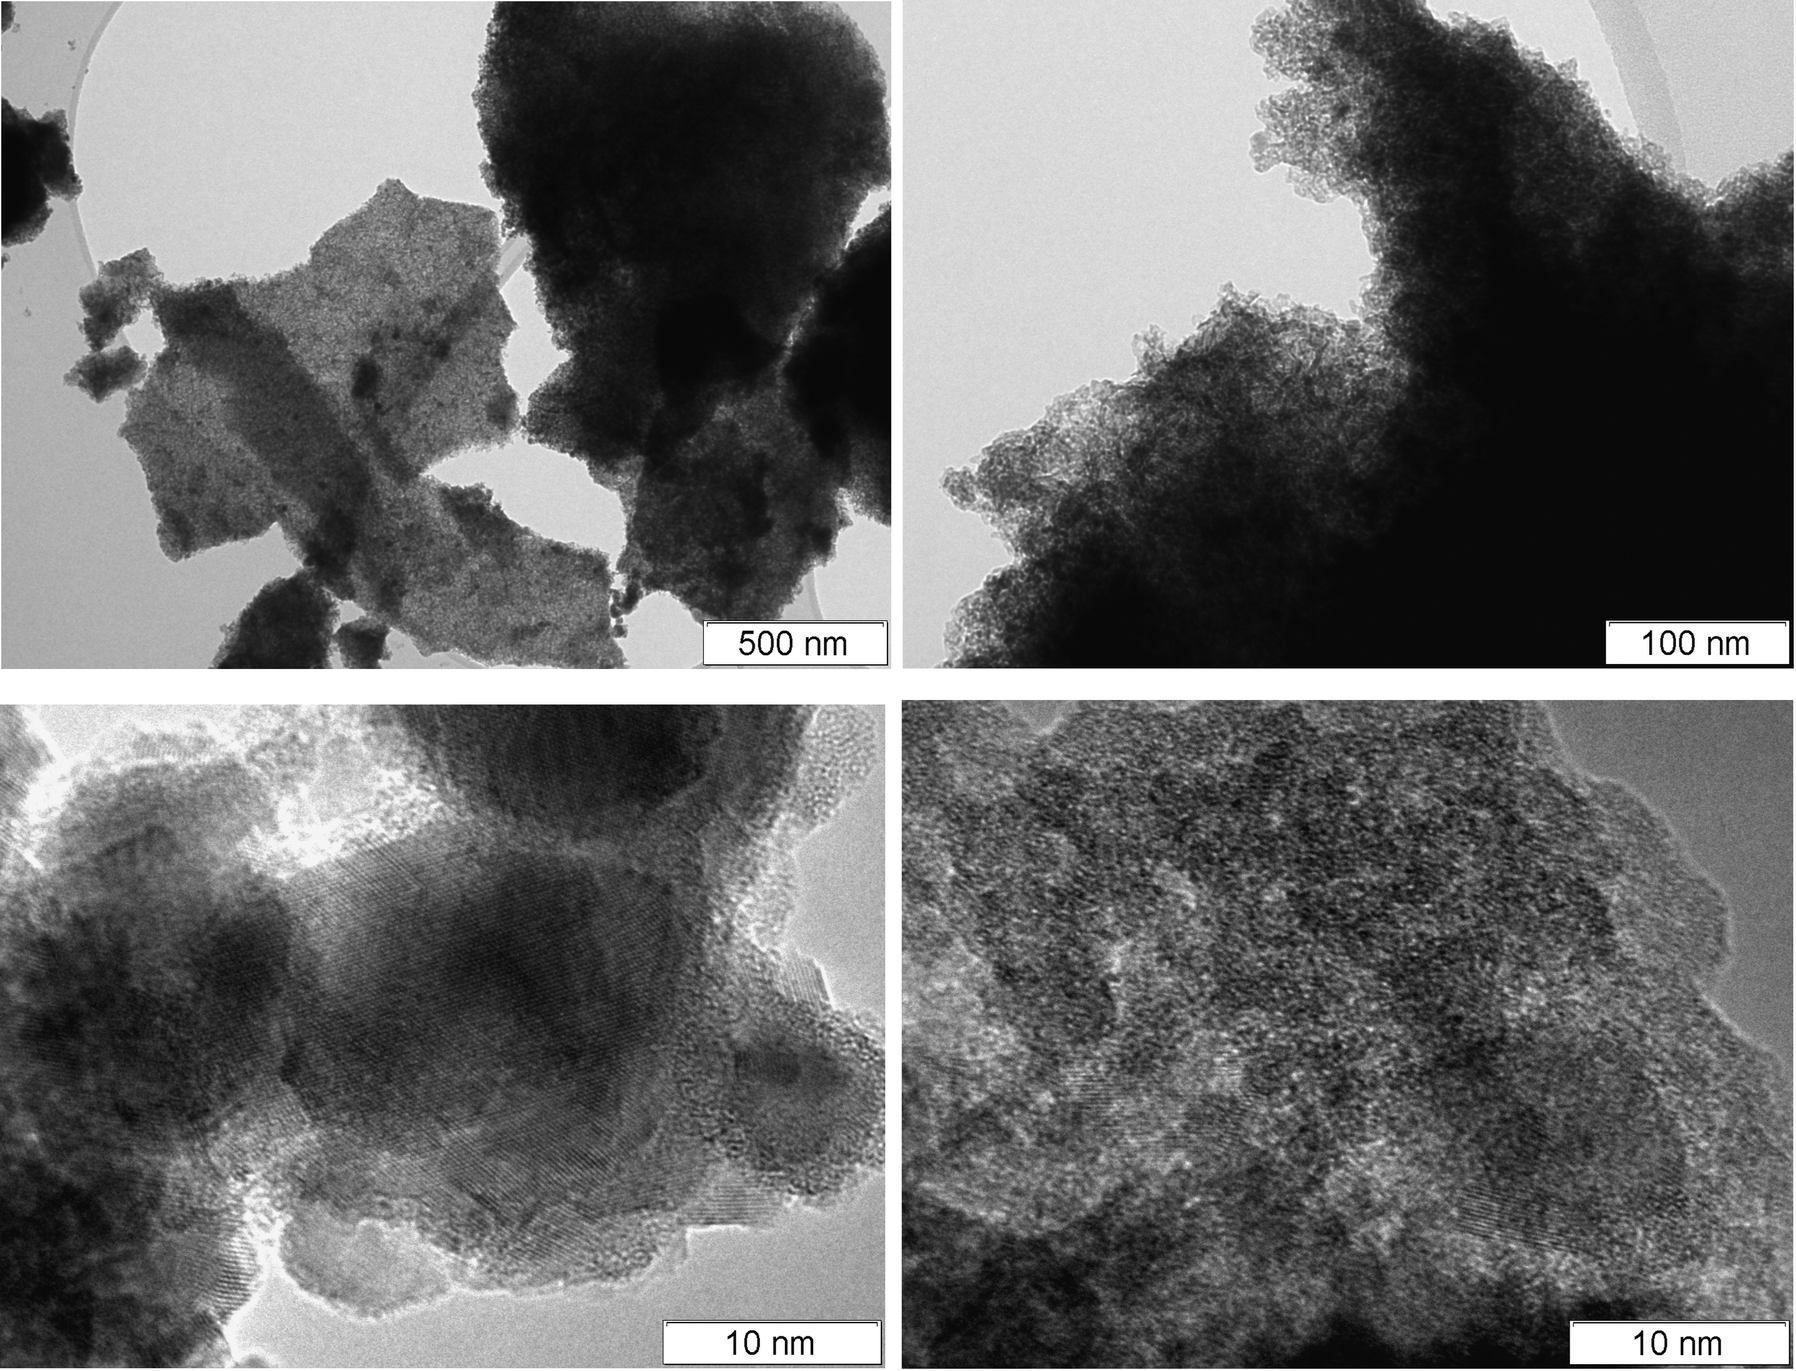 | ||
| Fig. 14 HRTEM images of freshly reduced and passivated Ni–Cu/SiO2–ZrO2. | ||
4. Conclusions
A detailed experimental study on the catalytic hydrotreatment of fast pyrolysis liquids with a Ni–Cu catalyst has been performed with the main objective to study the effects of reaction temperature on important product properties in both batch and continuous set-ups. The bimetallic Ni–Cu catalyst with high Ni loading, prepared by a sol–gel method, shows a low rate of undesired gas phase and coke/char formation and as such is a very suitable catalyst for the catalytic hydrotreatment of fast pyrolysis liquids. The molecular properties of the product oils were determined using a variety of techniques and reveal that the different product classes in the feed have different reactivity patterns. The small aldehydes and sugars are the most reactive, whereas the lignin fraction is by far less reactive and requires elevated temperatures. Organic acids, except formic acid, are rather inert under the prevailing reaction conditions. Some distinct differences between product properties in the batch and continuous set-ups were observed. For instance, the H/C ratio for the product oils from the batch set-up is always higher than that of the continuous set-up. These differences are likely related to lower intraparticle and hydrogen gas–liquid mass transfer rates in the continuous set-up.Continuous operation in the packed bed reactor set-up showed that operation up to 40 h is possible without serious operating issues like reactor clogging and plugging. The latter is commonly observed for the benchmark Ru/C in our previous studies. Further studies are in progress to establish catalyst stability at prolonged runtimes (up to 500 h) and will be reported in due course.
Acknowledgements
Financial support from Agentschap NL (Groene aardolie via pyrolyse, GAP) is gratefully acknowledged. We thank Hans van der Velde (Stratingh Institute for Chemistry, University of Groningen) for performing the elemental analyses, Hans Heeres (Biomass Technology Group, BTG) for aid with the development of experimental methods for total acid number and carbonyl number analyses and G. O. R. Alberda van Ekenstein (Department of Polymer Chemistry, Zernike Institute for Advanced Materials, University of Groningen) for viscosity and TGA analyses. We also thank Jan Henk Marsman, Leon Rohrbach, Erwin Wilbers, Marcel de Vries and Anne Appeldoorn for technical support.References
- J. N. Chheda, G. W. Huber and J. A. Dumesic, Angew. Chem., Int. Ed., 2007, 46, 7164–7183 CrossRef CAS PubMed.
- In Sustainable Development in the Process Industries: Cases and Impact, ed. R. H. Venderbosch and W. Prins, John Wiley & Sons, Inc., 2010, p. 109 Search PubMed.
- In Biofuel's Engineering Process Technology, ed. R. H. Venderbosch and H. J. Heeres, 2011, p. 385, www.intechopen.com Search PubMed.
- A. Oasmaa and S. Czernik, Energy Fuels, 1999, 13, 914–921 CrossRef CAS.
- R. Venderbosch and W. Prins, Biofuels, Bioprod. Biorefin., 2010, 4, 178–208 CrossRef CAS.
- J. Wildschut, F. H. Mahfud, R. H. Venderbosch and H. J. Heeres, Ind. Eng. Chem. Res., 2009, 48, 10324–10334 CrossRef CAS.
- V. Yakovlev, M. Bykova and S. Khromova, Catal. Ind., 2012, 4, 324–339 CrossRef.
- A. R. Ardiyanti, A. Gutierrez, M. Honkela, A. Krause and H. J. Heeres, Appl. Catal., A, 2011, 407, 56–66 CrossRef CAS.
- J. Wildschut, I. Melian-Cabrera and H. J. Heeres, Appl. Catal., B, 2010, 99, 298–306 CrossRef CAS.
- W. Chaiwat, R. Gunawan, M. Gholizadeh, X. Li, C. Lievens, X. Hu, Y. Wang, D. Mourant, A. Rossiter and J. Bromly, Fuel, 2013, 112, 302–310 CrossRef CAS.
- R. Gunawan, X. Li, C. Lievens, M. Gholizadeh, W. Chaiwat, X. Hu, D. Mourant, J. Bromly and C. Li, Fuel, 2013, 111, 709–717 CrossRef CAS.
- X. Li, R. Gunawan, Y. Wang, W. Chaiwat, X. Hu, M. Gholizadeh, D. Mourant, J. Bromly and C. Li, Fuel, 2014, 116, 642–649 CrossRef CAS.
- C. A. Mullen, A. A. Boateng and S. E. Reichenbach, Fuel, 2013, 111, 797–804 CrossRef CAS.
- X. Ying, W. Tiejun, M. Longlong and C. Guanyi, Energy Convers. Manage., 2012, 55, 172–177 CrossRef CAS.
- X. Zhang, J. Long, W. Kong, Q. Zhang, L. Chen, T. Wang, L. Ma and Y. Li, Energy Fuels, 2014, 28, 2562–2570 CrossRef CAS.
- Q. Guo, M. Wu, K. Wang, L. Zhang and X. Xu, Ind. Eng. Chem. Res., 2015, 54, 890–899 CrossRef CAS.
- X. Zhang, T. Wang, L. Ma, Q. Zhang and T. Jiang, Bioresour. Technol., 2013, 127, 306–311 CrossRef CAS PubMed.
- A. R. Ardiyanti, M. V. Bykova, S. A. Khromova, W. Yin, R. H. Venderbosch, V. A. Yakovlev and H. J. Heeres, Energy Fuels, 2016, 30(3), 1544–1554 CrossRef CAS.
- M. Bykova, D. Y. Ermakov, V. Kaichev, O. Bulavchenko, A. Saraev, M. Y. Lebedev and V. Yakovlev, Appl. Catal., B, 2012, 113, 296–307 CrossRef.
- M. Bykova, D. Y. Ermakov, S. Khromova, A. Smirnov, M. Y. Lebedev and V. Yakovlev, Catal. Today, 2014, 220, 21–31 CrossRef.
- A. R. Ardiyanti, S. Khromova, R. H. Venderbosch, V. Yakovlev and H. J. Heeres, Appl. Catal., B, 2012, 117, 105–117 CrossRef.
- E. Santillan-Jimenez and M. Crocker, J. Chem. Technol. Biotechnol., 2012, 87, 1041–1050 CrossRef CAS.
- Q. Luo, T. Wang, M. Beller and H. Jiao, J. Mol. Catal. A: Chem., 2013, 379, 169–177 CrossRef CAS.
- B. J. O'Neill, E. I. Gürbüz and J. A. Dumesic, J. Catal., 2012, 290, 193–201 CrossRef.
- M. D. Navalikhina and O. V. Krylov, Russ. Chem. Rev., 1998, 67, 587–616 CrossRef.
- W. Yin, R. H. Venderbosch and H. J. Heeres, 2nd International Congress on Catalysis for Biorefineries, Dalian, China, 2013 Search PubMed.
- R. H. Venderbosch, A. R. Ardiyanti, J. Wildschut, A. Oasmaa and H. J. Heeres, J. Chem. Technol. Biotechnol., 2010, 85, 674–686 CrossRef CAS.
- E. Crezee, B. W. Hoffer, R. J. Berger, M. Makkee, F. Kapteijn and J. A. Moulijn, Appl. Catal., A, 2003, 251, 1–17 CrossRef CAS.
- M. Makkee, A. P. Kieboom and H. van Bekkum, Carbohydr. Res., 1985, 138, 225–236 CrossRef CAS.
- J. Wildschut, J. Arentz, C. Rasrendra, R. H. Venderbosch and H. J. Heeres, Environ. Prog. Sustainable Energy, 2009, 28, 450–460 CrossRef CAS.
- A. Yamaguchi, N. Hiyoshi, O. Sato and M. Shirai, Green Chem., 2011, 13, 873–881 RSC.
- J. Marsman, J. Wildschut, F. Mahfud and H. J. Heeres, J. Chromatogr. A, 2007, 1150, 21–27 CrossRef CAS PubMed.
- J. Marsman, J. Wildschut, P. Evers, S. de Koning and H. J. Heeres, J. Chromatogr. A, 2008, 1188, 17–25 CrossRef CAS PubMed.
- A. R. Ardiyanti, Ph.D. Thesis, University of Groningen, Groningen, Netherlands, 2013 Search PubMed, 978-90-6182-234-5.
- H. Olcay, L. Xu, Y. Xu and G. W. Huber, ChemCatChem, 2010, 2, 1420–1424 CrossRef CAS.
- R. Davda, J. Shabaker, G. Huber, R. Cortright and J. Dumesic, Appl. Catal., B, 2005, 56, 171–186 CrossRef CAS.
- C. Rasrendra, B. Girisuta, H. Van de Bovenkamp, J. Winkelman, E. Leijenhorst, R. Venderbosch, M. Windt, D. Meier and H. Heeres, Chem. Eng. J., 2011, 176, 244–252 CrossRef.
- A. Teella, G. W. Huber and D. M. Ford, J. Membr. Sci., 2011, 378, 495–502 CrossRef CAS.
- L. Ingram, D. Mohan, M. Bricka, P. Steele, D. Strobel, D. Crocker, B. Mitchell, J. Mohammad, K. Cantrell and C. U. Pittman Jr, Energy Fuels, 2007, 22, 614–625 CrossRef.
- F. Noel, Fuel, 1984, 63, 931–934 CrossRef CAS.
- T. Popa, Y. Zhang, E. Jin and M. Fan, Appl. Catal., A, 2015, 505, 52–61 CrossRef CAS.
- B. Mile, D. Stirling, M. A. Zammitt, A. Lovell and M. Webb, J. Catal., 1988, 114, 217–229 CrossRef CAS.
- M. A. Ermakova and D. Y. Ermakov, Appl. Catal., A, 2003, 245, 277–288 CrossRef CAS.
- T. Ueckert, R. Lamber, N. Jaeger and U. Schubert, Appl. Catal., A, 1997, 155, 75–85 CrossRef CAS.
- C. Bartholomew and R. Pannell, J. Catal., 1980, 65, 390–401 CrossRef CAS.
- A. Carley, S. Jackson, J. O'shea and M. Roberts, Surf. Sci., 1999, 440, L868–L874 CrossRef CAS.
- N. McIntyre and M. Cook, Anal. Chem., 1975, 47, 2208–2213 CrossRef CAS.
- R. Shalvoy, P. Reucroft and B. Davis, J. Catal., 1979, 56, 336–348 CrossRef CAS.
- S. Poulston, P. Parlett, P. Stone and M. Bowker, Surf. Interface Anal., 1996, 24, 811–820 CrossRef CAS.
- C. P. Li, A. Proctor and D. M. Hercules, Appl. Spectrosc., 1984, 38, 880–886 CrossRef CAS.
- J. Batista, A. Pintar, D. Mandrino, M. Jenko and V. Martin, Appl. Catal., A, 2001, 206, 113–124 CrossRef CAS.
- G. Moretti, J. Electron Spectrosc. Relat. Phenom., 1995, 76, 365–370 CrossRef CAS.
- S. Kim, M. C. Kim, S. Choi, K. J. Kim, H. N. Hwang and C. C. Hwang, Appl. Phys. Lett., 2007, 91, 3113 Search PubMed.
- M. Guittet, J. Crocombette and M. Gautier-Soyer, Phys. Rev. B: Condens. Matter Mater. Phys., 2001, 63, 125117 CrossRef.
- M. Bykova, O. Bulavchenko, D. Y. Ermakov, M. Y. Lebedev, V. Yakovlev and V. Parmon, Catal. Ind., 2011, 3, 15–22 CrossRef.
- C. Guimon, A. Auroux, E. Romero and A. Monzon, Appl. Catal., A, 2003, 251, 199–214 CrossRef CAS.
Footnote |
| † Electronic supplementary information (ESI) available. See DOI: 10.1039/c6cy00503a |
| This journal is © The Royal Society of Chemistry 2016 |