 Open Access Article
Creative Commons Attribution 3.0 Unported Licence
Reactivity of diatomics and of ethylene on zeolite-supported 13-atom platinum nanoclusters†
M.
Keppeler‡
a,
G.
Bräuning
a,
S. G.
Radhakrishnan
b,
X.
Liu§
a,
C.
Jensen¶
a and
E.
Roduner
*ab
aInstitut für Physikalische Chemie, Universität Stuttgart, Pfaffenwaldring 55, D-70569, Stuttgart, Germany. E-mail: e.roduner@ipc.uni-stuttgart.de
bDepartment of Chemistry, University of Pretoria, Pretoria 0002, Republic of South Africa
First published on 8th March 2016
Abstract
Monodisperse Pt clusters of 13 ± 2 atoms, supported on the zeolites NaY and KL and saturated with chemisorbed hydrogen, are investigated as well-defined model catalysts for reactions of CO, NO, O2 and ethene. CO reacts within <10 min, leading to the formation of dinuclear Pt carbonyl molecular clusters. A similar behaviour of NO suggests an analogous reaction. In stark contrast, O2 reveals a very sluggish reaction on a timescale of days although the reaction with chemisorbed hydrogen to form H2O is thermodynamically still favoured. This is ascribed to the inability of O2 to adsorb atop of Pt when all neighbouring sites are blocked by chemisorbed hydrogen. The hydrogenation reaction of ethene yields ethane as the only product. The turnover frequency at room temperature is somewhat lower than the one reported for the same reaction on Pt(111) single crystal surfaces or on Pt nanoparticles, but its activation energy is double that typically found in other systems. This means that the reaction which has been known to be structure-insensitive becomes structure-sensitive for catalyst clusters as small as 13 atoms. This fact is ascribed to a significantly larger binding energy of H on Pt as a consequence of the small cluster size and the influence of the support.
Introduction
It is often stated that the preference for noble metal catalyst particles of nanosize is the more economical use of the expensive elements since only the atoms at the surface are involved in catalysis, and the dispersion (i.e. the fraction of atoms at the surface) increases strongly for small particles. This statement is not wrong, but the motivation goes much beyond economy. Rather, atoms at corners, edges, kinks and on flat surfaces of crystallites are coordinated by different numbers of neighbours and exhibit different reactivities. The more under-coordinated an atom, the higher its propensity to form bonds. More importantly, clusters represent intermediates between individual atoms and bulk matter and have intermediate electronic properties. The first ionization energy of platinum atoms amounts to 9.0 eV and its electron affinity to 2.1 eV, while those for the bulk metal both correspond to the work function, which amounts to 5.3 eV. Thus, by tuning the size of particles the availability of electrons to participate in chemical bonds can be varied over a huge range on a scale of chemical relevance. This directly affects the bond strength and is regarded as the main origin of nanosize effects in chemistry.1The present work focuses on uniform clusters of 13 ± 2 Pt atoms supported on NaY and KL zeolite. The synthesis and characterization of these close to icosahedral or cuboctahedral clusters were reported in detail previously.2–7 A fraction of these clusters are EPR active and show a regular multiplet, split by Pt hyperfine interaction, that is indicative of a highly symmetric structure with 12 equivalent Pt atoms as they are found in icosahedral or cuboctahedral 13-atom clusters.5 Of particular interest in the present context is the amount of chemisorbed hydrogen, which reaches up to 3 H per Pt atom, while for larger Pt nanoparticles one assumes only 1 H per surface Pt atom.3 Furthermore, the D2 desorption energy is 131 kJ mol−1 (1.36 eV) in NaY and 203 kJ mol−1 (2.1 eV) in KL zeolite, significantly more than the 77 kJ mol−1 (0.8 eV) from single crystal Pt(111) surfaces.4,5,8 These values give evidence of a size as well as a support effect.
Molecular hydrogen adsorbs side-on and dissociates on the surface of platinum. Based on IR vibrational spectroscopy of Pt13 clusters it was concluded that H atoms are bridge-bound over-edge (η2) to two neighbouring Pt atoms, while on a Pt(111) surface H binds to the three-fold hollow site (η3). In this way, icosahedral Pt13 can bind 30 H atoms.7 Molecular oxygen can also dissociate on a Pt(111) surface, forming atomic oxygen which is preferentially η3 bound to the three-fold hollow site.9 Carbon monoxide is known to bind well to most transition metals, and IR vibrational spectroscopy is well established and shows that binding is head-on via the carbon atom, primarily atop Pt, but also bridge-bonded (η2), or even η3-bonded.10 Adsorption of CO on Pt13 clusters leads to disintegration to form Pt2(CO)m species with m ≈ 5.11 NO adsorbs on clean Pt(111) initially in two-fold bridge-bonded sites and at higher coverages atop Pt, but oxygen preadsorption suppresses the bridge-bonded site up to high NO coverages.12
Hydrogenation of alkenes on noble metal catalysts is of major industrial importance. Therefore, the hydrogenation of ethene, the simplest alkene, has been used as a prototype reaction in studies of the mechanism of hydrogenation reactions for several decades and for various modifications of the catalyst. Hydrogenation on Pt(111) single crystal surfaces in the absence of preadsorbed hydrogen is a stepwise process, starting below 52 K through physisorption via its π-orbital and proceeding to ethane via a chemisorbed ethyl intermediate, CH3CH2-Pt.13 As a competing reaction, the π-bond breaks at above 52 K along with the formation of two σ-bonds from the carbon atoms to the Pt substrate. At 240 K, the di-σ-bonded ethene converts to ethylidyne (Pt![[triple bond, length as m-dash]](https://www.rsc.org/images/entities/char_e002.gif) C–CH3) by splitting an H atom off from one of the carbons and shifting the second one to the other carbon. Neither the π-bonded ethene nor the ethylidyne are involved as direct intermediates in ethene hydrogenation.13 This hydrogenation mechanism was confirmed via IR spectroscopy which revealed a direct correlation of the disappearance of the signal of CH3CH2-Pt with the appearance of C2H6.14 The reaction kinetics is of zero order with respect to ethylene partial pressure and of first order with respect to hydrogen partial pressure, as confirmed in a recent operando study.15
C–CH3) by splitting an H atom off from one of the carbons and shifting the second one to the other carbon. Neither the π-bonded ethene nor the ethylidyne are involved as direct intermediates in ethene hydrogenation.13 This hydrogenation mechanism was confirmed via IR spectroscopy which revealed a direct correlation of the disappearance of the signal of CH3CH2-Pt with the appearance of C2H6.14 The reaction kinetics is of zero order with respect to ethylene partial pressure and of first order with respect to hydrogen partial pressure, as confirmed in a recent operando study.15
The rates of certain reactions such as alkane hydrogenolysis or carbon–nitrogen ring opening reactions were found to depend on the Pt nanocrystal size.16 Furthermore, the catalytic activity and selectivity were shown to be sensitive to the shape of catalyst nanocrystals. The hydrogenation of benzene, for example, led to both cyclohexane and cyclohexene on cuboctahedral nanocrystals, whereas only cyclohexane was formed on cubic nanocrystals.5 However, ethene hydrogenation rates were independent of both shape and size and comparable to those on Pt single crystal surfaces, which means that the reaction is not structure sensitive down to 1.7 nm size.17 It is therefore of fundamental interest to check whether this behaviour pertains to even smaller catalyst species. Interestingly, a recent study revealed that size-controlled 12-atom Pt clusters which are metastable and have irregular coordination exhibit double the activity compared with the more regular near-icosahedral Pt13 cluster in the oxygen reduction reaction.18 It is generally thought that the additional inherent fluxionality of the metastable amorphous clusters is essential for maximum catalytic activity.19
The first part of the present work will contrast the different reactivities of the diatomic molecules CO, NO and O2 with fully hydrogenated Pt13 by directly observing the evolution of the EPR spectrum of the potentially catalytic centre. The second part will study the influence of these nanosize effects on the hydrogenation of ethene by in situ FT-IR spectroscopic investigation and by GC-MS product analysis in a flow reactor.
Experimental procedures
Sample preparation
Full details of the sample preparation are given elsewhere,3–5 but in short it was as follows. Pt/NaY and Pt/KL samples aiming at a Pt loading of 6 wt% were prepared by stirring commercial NaY and KL zeolite (CU Chemie Uetikon, Switzerland) in an aqueous solution of [Pt(NH3)4]Cl2 at 343 K. The product was filtered off, washed with deionised water to remove Cl− ions, dried and calcined in a stream of O2 using a heating rate of 0.5 K min−1 from room temperature to 573 K (Pt/NaY) and 623 K (Pt/KL) where it was held for 5 h. It was then reduced in flowing H2 at a heating rate of 4 K min−1 to 473 K (Pt/NaY) and 507 K (Pt/KL) where it was kept for 1 h. Following this protocol, the 13-atom clusters are obtained reproducibly, which is best verified by Extended X-ray Absorption Fine Structure (EXAFS) spectroscopy.2,3For hydrogen isotope exchange, deuterium gas was filled into an evacuated EPR quartz tube of 4 mm outer diameter containing about 200 mg of H-reduced Pt-loaded zeolite. For NaY, the gas was kept for 30 min at a D2 partial pressure of 500 mbar at room temperature; for KL the complete exchange takes ca. 24 h.
Isotopically enriched Pt salt was obtained from the Oak Ridge National Laboratory (USA).
EPR experiments
Continuous wave EPR spectra were recorded between 4 K and 295 K using a Bruker EMX spectrometer with a microwave frequency of about 9.466 GHz (X-band) at a power of 1 mW to avoid saturation of signals. Further details are given elsewhere.4,5Adsorption experiments with CO, NO and O2
An EPR tube containing about 200 mg of the 6 wt% Pt/NaY and Pt/KL zeolite in vacuum was exposed to subsequent doses of the diatomic gas at a partial pressure of ca. 50 mbar which was maintained for 10 minutes at room temperature for each dose. The residual gas was evacuated from the EPR tube before recording the EPR spectrum at low temperature.FT-IR experiments
About 15–25 mg of the prepared zeolite powder were pressed to thin wafers and placed in a reaction chamber that can be heated to 623 K and cooled to 86 K. FT-IR experiments were carried out in transmission using a Nicolet Magna 560 spectrometer at a spectral resolution of 2 cm−1. For complete desorption of chemisorbed H atoms the sample was heated under vacuum at 573 K for 3 h. Then the first spectrum was recorded and used as a background for the subsequent difference spectra, all recorded at room temperature. Adsorption was carried out at temperatures between 86 K and 298 K by adding 50 mbar (0.09 mmol) of ethene or 150 mbar (0.27 mmol) of H2 or D2 from a standard volume of 44.8 ml.Calculations of IR intensities along with the geometry and energy optimization were performed using Gaussian 09 (ref. 20) with the density functional B3LYP/6-311++G(d,p) and the results were analysed using the GaussView 05 program.21
Catalytic experiments
The quantitative measurements were carried out in a flow reactor containing 5–15 mg of zeolite powder loaded with 0.3 μmol g−1 Pt on a 10 mm diameter glass frit at a controlled temperature between 278 and 298 K. The small grain size (ca. 2 μm grain size) is crucial to ensure a homogeneous flow pattern and contact time in the 10 mm diameter and >1 mm high catalyst bed.22 The catalyst was exposed to a gas mixture of 75% H2 or D2 and 25% ethene at a total flux of 20 ml min–1, controlled by two mass flow controllers. Products were analysed periodically using gas chromatography (HP 6890, G1540A, helium carrier gas) coupled to a mass spectrometer (HP 5973) for detection and analysis. The detection of ethane was calibrated, which allowed the determination of the turnover frequency (TOF) per Pt atom. The measurements started after 10 min of flushing time to make sure that any residual air has been purged. For the measurements of the T-dependence the samples were exchanged frequently to avoid distortion of the data by catalyst deactivation.Results and discussion
EPR observation of the reaction with CO in Pt/NaY
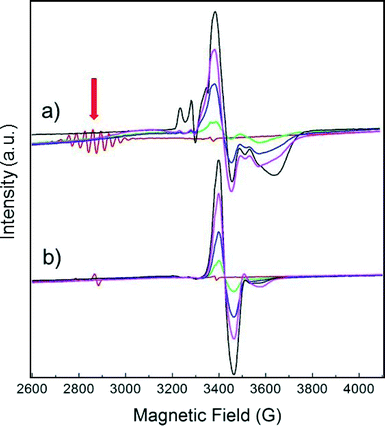
Fig. 1 displays the magnetic field range of the EPR spectrum of deuterium-saturated Pt13 clusters before and after CO adsorption in increasing amounts. The multiplet (red arrow) due to the hyperfine coupling to 195Pt, which is a spin-½ nucleus, is simulated well with a g-value of 2.357 and 12 equivalent Pt nuclei with a hyperfine coupling of 68.8 G.4 It is obvious that it disappears completely already within 10 min after addition of the first dose of CO. A new signal appears near g = ge, but its intensity grows much stronger on further CO addition. This is because the EPR active initial multiplet represents only a small fraction (<1%) of all the platinum in the sample. Obviously, the EPR-inactive species reacts as well.The experiment was repeated with a sample consisting of a 194Pt (I = 0) isotopically enriched sample (Fig. 1b). Clearly, the splitting pattern of the multiplet and also much of the structure of the new signal disappear, confirming that it is due to Pt.
The reaction was investigated in detail based mainly on extended X-ray absorption fine structure (EXAFS) and vibrational FT-IR spectroscopy as reported elsewhere.11 It was concluded that the small cluster breaks up under the influence of binding energy to CO under formation of a binuclear Pt2(CO)m molecular cluster with m ≈ 5. In contrast, Pt nanoparticles of ≈2 nm diameter do not disintegrate on CO adsorption since they are sufficiently stabilised due to the higher Pt coordination number.
EPR observation of the reaction with NO in Pt/NaY
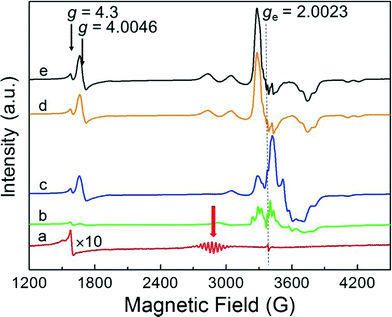
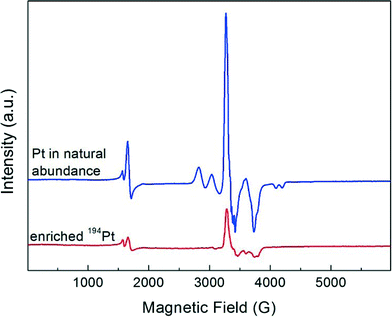
The evolution of the EPR spectrum on adsorption of NO to the deuterated Pt13 cluster sample was conducted in an analogous way to the above CO experiment. The results, displayed in Fig. 2, show to some extent analogous behaviour. As for CO, the initial cluster multiplet (red arrow) disappears very quickly, but the case is more complex. The figure is extended to lower fields where a signal near g = 4.3 is seen that is present in all samples independent of Pt loading. This is seen due to the iron that arises from the contaminated starting materials from which the samples were prepared, and not in samples which are especially synthesized from starting materials free of iron impurities.6 It is due to these iron impurities and not of interest here. The new signal that grows at near g = ge also grows to a higher intensity compared with the initial multiplet, and it clearly shows a varying structure with increasing amount of added NO (Fig. 2b–e). Repeating the experiment with the 194Pt enriched sample simplifies the spectrum observed on NO saturation (Fig. 3) compared to the one in normal isotopic abundance. Thus the two multiplets seen with Pt in natural abundance are due to two inequivalent Pt nuclei, suggesting that the Pt13 cluster may also break up on NO addition in a similar way to CO addition, but Extended X-ray Absorption Fine Structure (EXAFS) spectra which could provide the final proof for this are not available. The spectrum of the 194Pt enriched sample in Fig. 3 is axial with g‖ < g⊥ (some remaining additional structure could be the contribution from the nitrogen nuclear splitting or to the incomplete isotopic enrichment).In contrast to the experiments with CO, NO addition leads to an additional new signal at half the magnetic field near g = 4.0046. This is a single quantum transition with ΔmS = 2 that is forbidden in isotropic systems but allowed for electron triplet states in anisotropic environments. Since the hyperfine shift is proportional to mS this contribution cancels out in the transition between the levels with mS = ±1. These transitions are therefore generally much narrower than the single quantum transitions. In the absence of transitions with ΔmS > 2, observation of this line is an unequivocal indicator of the presence of a triplet state. More detailed interpretation would require additional experimental information as e.g. EXAFS and electron nuclear double resonance (ENDOR) spectra, which are unavailable at this point.
The important fact in the present context is the immediate reaction of CO and NO with the deuterium saturated cluster which reveals full access of the diatomic molecules on the fully deuterated cluster surface.
EPR observation of the reaction with O2 on Pt/KL
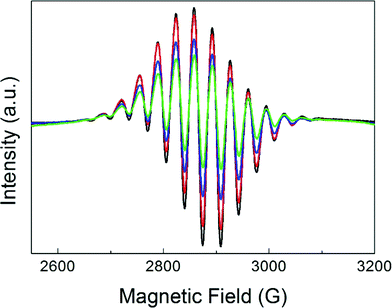
The spectral evolution of the EPR active cluster species is shown in Fig. 4. In spectacular contrast to the experiments with CO and NO, the reaction of O2 is very sluggish. Even after more than 16 h at room temperature much of the signal is still present, although the molecule is of similar size as the others so that access to the cluster surface cannot be hindered. Also from a thermodynamic point of view, the oxyhydrogen reaction with adsorbed hydrogen is still exothermic by ≈46 kJ mol−1 (the standard reaction enthalpy minus the D2 adsorption energy on Pt/KL) so that it should easily occur.5 Therefore, it must be concluded that the chemisorbed hydrogen effectively blocks oxygen adsorption, or at least its dissociation, since this requires two free neighbouring binding sites. Atomic oxygen binds preferentially to the three-fold hollow site.9 The connecting line between two of these neighbouring sites crosses an edge of the icosahedral Pt13 cluster, and this edge is occupied by a chemisorbed H or D atom so that side-on adsorption and dissociation is not possible for steric reasons. We shall return to this aspect further below.FT-IR observations upon ethene adsorption
No absorption features were observed when ethene was added to bare (hydrogen desorbed) Pt13 samples at 298 K followed by cooling to 86 K. Perhaps the signal was just too weak. When 0.27 mmol of hydrogen was added for adsorption on the 15–25 mg wafer this led to the observation of two weak features at 2915 cm−1 and 2848 cm−1 (Fig. 5) which are assigned based on ref. 13 for Pt(111) surfaces to di-σ-bonded ethene (C–H symmetric stretch: 2915 cm−1) and to the ethyl intermediate (Fermi resonance and CH3 stretch of the ethyl group bonded to Pt, reported at 2850 cm−1). The same intensity behaviour is found for the band at 2915 cm−1, suggesting that the Fermi resonance partner of the 2848 cm−1 band, reported at 2925 cm−1, could overlap with the 2915 cm−1 band. These bands grow in the presence of hydrogen and also on increasing the temperature to 153 K. On further heating the bands decrease, and a new feature grows in at 2880 cm−1 and is seen well at 273 K. It is compatible with ethylidyne (symmetric stretch of CH3 group, reported at 2878 cm−1 or 2885 cm−1 in other sources).13,23 Another band at 2895 cm−1 appears at 153 K and grows further with increasing temperature. This feature agrees with the position of the CH3 stretching vibration of the ethane product. In none of the spectra was there any evidence of π-bonded ethene, expected to be near 3000 cm−1. Except for the absence of the latter species, which may be a consequence of the higher base temperature, the observations with the Pt13 cluster are consistent with those for large nanoparticle and single-crystal data.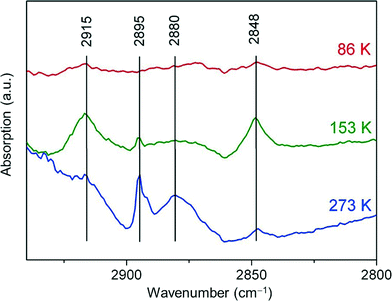 | ||
| Fig. 5 FT-IR difference spectra recorded with freshly reduced Pt13Hx clusters supported on KL zeolite following adsorption of ethene at 86 K, and in the presence of H2 gas at 153 K and 273 K. | ||
On heating beyond 273 K the bands of the surface-adsorbed species disappear or are masked by the prominent vibrational bands of the evolving ethane (Fig. 6). There is a superposition of C–H stretch vibrations between 2804 cm−1 and 3006 cm−1 which on expansion of the scale show P, Q, and R branches with partly resolved rotational fine structure, revealing that the observed species is desorbed gas phase ethane. The bending vibrations are observed below 1500 cm−1, superimposed on two unresolved bands near 1600 cm−1 and 1400 cm−1 due to Pt–H vibrations.7 For the deuterated Pt13Dx cluster these latter two bands are shifted to lower wavenumbers outside the transparent window of the zeolite. On the deuterated Pt cluster samples the C–D stretching vibrations of the formed C2H4D2 are seen as expected near 2200 cm−1. Neither ethene nor any product other than ethane is observed in these spectra, suggesting complete conversion with high selectivity.
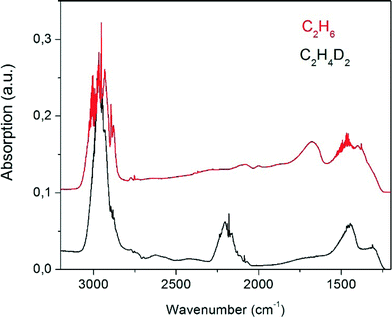 | ||
| Fig. 6 FT-IR difference spectra recorded at room temperature for gaseous ethane formed upon adsorption of C2H4 on Pt13HX (red, offset by 0.1 absorption units) and Pt13DX (black) on KL zeolite. | ||
There is not sufficient resolution in the spectra to analyse for the different isotopologues and their conformers. We can nevertheless try to get further information from the band intensities. The ratio of the integrated intensities of the C–H and the C–D-stretching regime in the experiment carried out with deuterium gas (black curve in Fig. 6) could naively be expected to be 2![[thin space (1/6-em)]](https://www.rsc.org/images/entities/char_2009.gif) :
:![[thin space (1/6-em)]](https://www.rsc.org/images/entities/char_2009.gif) 1, instead it is found to be 3.84
1, instead it is found to be 3.84![[thin space (1/6-em)]](https://www.rsc.org/images/entities/char_2009.gif) :
:![[thin space (1/6-em)]](https://www.rsc.org/images/entities/char_2009.gif) 1. Indeed, there is an intrinsic isotope effect due to the mass dependence of the root mean square displacement of the atoms which enters in the transition dipole moment as μ−1/2, where μ is the reduced mass of the oscillator. The intensity of a transition is proportional to the oscillator strength f, the square of the transition dipole moment. For a simple diatomic C–H(D) oscillator, fH/fD is thus expected to scale with μ(C–D)/μ(C–H) = 1.87. This brings the intrinsic intensity ratio of the expected C2H4D2 product from 2
1. Indeed, there is an intrinsic isotope effect due to the mass dependence of the root mean square displacement of the atoms which enters in the transition dipole moment as μ−1/2, where μ is the reduced mass of the oscillator. The intensity of a transition is proportional to the oscillator strength f, the square of the transition dipole moment. For a simple diatomic C–H(D) oscillator, fH/fD is thus expected to scale with μ(C–D)/μ(C–H) = 1.87. This brings the intrinsic intensity ratio of the expected C2H4D2 product from 2![[thin space (1/6-em)]](https://www.rsc.org/images/entities/char_2009.gif) :
:![[thin space (1/6-em)]](https://www.rsc.org/images/entities/char_2009.gif) 1 to 3.71
1 to 3.71![[thin space (1/6-em)]](https://www.rsc.org/images/entities/char_2009.gif) :
:![[thin space (1/6-em)]](https://www.rsc.org/images/entities/char_2009.gif) 1, which is close to the experimental value. However, the issue could be more complex, since any IR-forbidden transition in C2H6 becomes allowed when the molecular D3d symmetry of the staggered conformation is broken by deuteration. We have therefore calculated the theoretical band intensities for the C–H and C–D stretching modes of the expected isotopologues. Interestingly, it turns out that the intensity loss due to forbidden modes is compensated for by other modes so that the sum of intensities scales well with the number of C–H(D) oscillators (Table 1). The complete information is given in Fig. S1 and Table S1 of the ESI.† On the average, the predicted C–H/C–D band intensity ratio for the expected C2H4D2 stoichiometry is 4.0(1), close enough to the observed value of 3.84. The intensity ratio does not provide any information about the specific nature of the isotopologues.
1, which is close to the experimental value. However, the issue could be more complex, since any IR-forbidden transition in C2H6 becomes allowed when the molecular D3d symmetry of the staggered conformation is broken by deuteration. We have therefore calculated the theoretical band intensities for the C–H and C–D stretching modes of the expected isotopologues. Interestingly, it turns out that the intensity loss due to forbidden modes is compensated for by other modes so that the sum of intensities scales well with the number of C–H(D) oscillators (Table 1). The complete information is given in Fig. S1 and Table S1 of the ESI.† On the average, the predicted C–H/C–D band intensity ratio for the expected C2H4D2 stoichiometry is 4.0(1), close enough to the observed value of 3.84. The intensity ratio does not provide any information about the specific nature of the isotopologues.
| Isotopologue | Conformation | IR intensity, Σ over stretching vibrations (per mode) | ||
|---|---|---|---|---|
| C–H | C–D | C–H/C–D ratio | ||
| CH2D–CH3 | Staggered | 154.3 (30.9) | 15.0 (15.0) | 10.3 (2.06) |
| CH2D–CH2D | D–D staggered | 123.6 (30.9) | 30.0 (15.0) | 4.1 (2.06) |
| D–D anti | 122.9 (30.7) | 30.8 (15.4) | 4.0 (2.00) | |
| CHD2-CH3 | Any | 123.8 (31.0) | 29.9 (15.0) | 4.1 (2.07) |
| CH2D-CHD2 | H–D anti | 93.1 (31.0) | 44.8 (14.9) | 2.1 (2.08) |
| H–D staggered | 92.4 (30.8) | 45.7 (15.2) | 2.0 (2.02) | |
Mass spectra of the product of the reaction of C2H4 with D2 were consistent with a C2H4D2 stoichiometry. However, detailed analysis of the mass distribution revealed evidence of isotopic scrambling with about 50% C2H4D2, significant amounts of C2H5D and C2H3D3 and probably a small amount of C2H6.
In the presence of preadsorbed hydrogen on the cluster the ethane product is observable in the IR spectra a few minutes after ethene adsorption at room temperature. On simultaneous adsorption of ethene and hydrogen in the absence of preadsorbed H the time delay until ethane appears is slightly longer, and when ethene is adsorbed alone in the absence of preadsorbed H the time to appearance of ethane is about a factor of 6 longer than for adsorption on Pt13Hm. The latter fact may be taken as qualitative evidence of an induction period during which chemisorbed H on Pt is made available for subsequent hydrogenation of ethene. This interpretation is in accord with Zaera who reported that hydrogenation can be enhanced by hydrogen coadsorption and that the activation energy of hydrogenation amounts to only about 25 kJ mol−1 in this case, while in the absence of preadsorbed hydrogen it is 40–45 kJ mol−1, determined by cleaving a C–H bond in π-bonded ethene.24
Determination of catalytic activity
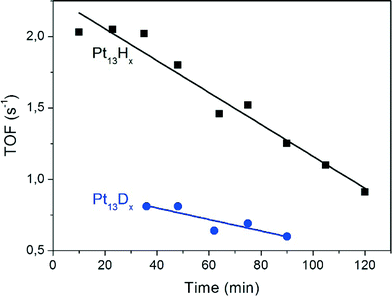
GC-MS determination reveals ethane as the only reaction product of the hydrogenation experiments, i.e. the product selectivity is 100%. The maximum TOF was 2.1 ethene molecules per Pt atom per second. This is less than that reported for Pt films (TOF of 50.5) and 9.2% Pt/SiO2 (53.4) but more than that for Pt/SBA-15 (≈0.7) under the same conditions except that the H2/C2H4 ratio was 3/1 in the present work, whereas the literature work reported a ratio of 10/1.17 The extent of coverage of the clusters by hydrogen was not determined in the present work, but based on the previously reported adsorption isotherms and the given partial pressure of H2 in the gas flow it is expected that the surface is saturated with H, which corresponds to Pt13Hx with x ≈ 38.3 30 of these atoms are accommodated in such a way that they bridge the cluster edges along the 30 Pt–Pt bonds.7 The remaining atoms probably bind atop of the Pt corner atoms.The turnover frequency decreases linearly by ≈40% over 60 minutes (Fig. 7). Since there is no obvious coloration which could be taken as evidence for coking, the origin of the deactivation is unclear. Furthermore, the TOF is lower by a factor of 2.1 when deuterium instead of hydrogen is preadsorbed. This hydrogen isotope effect demonstrates that the reaction is not transport-limited by ethene diffusion in the zeolite pores. Further aspects of it will be discussed below.
With H2 in the flow the TOF was monitored as a function of temperature. The results are displayed in the form of an Arrhenius plot in Fig. 8. A reliable determination of the TOF values requires the experiments to be performed under conditions of low turnover. Because of the high temperature dependence of the rate, experiments were limited to the range of 278–298 K over which the TOF varied by a factor of 12. For the three temperatures below 290 K the ethene to ethane conversion was less than 4%, but for 298 K it reached 29.7%. This data point was nevertheless used in the analysis, which has the consequence that the derived Arrhenius activation energy (Ea = 90 ± 10 kJ mol−1) and the corresponding apparent pre-exponential factor (log(A/s−1) = 15.2 ± 1.5) should perhaps be regarded as lower limits. The result is nevertheless highly interesting since the activation energy is significantly higher than most of the literature values which are in the range 40–45 kJ mol−1 when ethene is adsorbed on hydrogen-free surfaces17 and as low as 25 kJ mol−1 in the presence of preadsorbed hydrogen.24 According to Zaera, the rate-determining step in the absence of preadsorbed hydrogen is the dissociation of an ethene C–H bond which then provides surface chemisorbed H atoms for hydrogenation.23,24
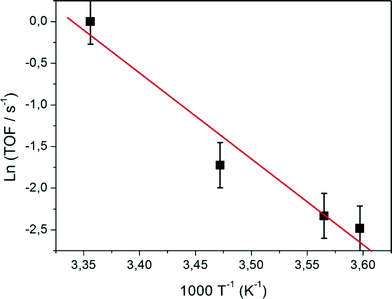 | ||
| Fig. 8 Arrhenius plot of turnover frequencies for ethene hydrogenation on Pt13Hx supported on KL zeolite. | ||
Zaera analysed the reaction enthalpies of the gaseous (g) and adsorbed (a) species involved in the ethene hydrogenation reaction on Pt(111) and presented his results in terms of Born–Haber cycles (Fig. 9).23 We have amended this diagram to include the case of Pt13Hx clusters as a support. The important difference is the much higher chemisorption enthalpy of H2 on the clusters in KL zeolite (−202 kJ mol−1 compared with −80 kJ mol−1 on Pt(111)). In other words, the Pt–H bond strength amounts to 256 kJ mol−1 on Pt(111)24 but to 323 kJ mol−1 on Pt13/KL. The difference was ascribed in part to a nanosize effect and in part to a support effect.5 The consequence for ethene hydrogenation on Pt with preadsorbed hydrogen is that the first step of the reaction, the abstraction of a chemisorbed H atom, H(a), by adsorbed ethene to form the adsorbed ethyl radical is endothermic by 25 kJ mol−1 on Pt(111) but by 85 kJ mol−1 on Pt13/KL (reaction framed in red in Fig. 9). This reaction enthalpy is also the lower limit of the activation energy. It coincides with Ea when the back-reaction is not activated, a condition which seems to be met for the present system. The transfer of the second hydrogen requires less energy and is even exothermic on Pt(111) because the ethene double bond needs to be broken only in the first step.
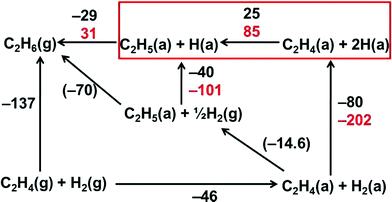 | ||
| Fig. 9 Born–Haber cycle for C2 hydrocarbon fragments adsorbed on Pt(111) (black numbers) and on Pt13/KL zeolite (red numbers). The transformation from physisorbed to chemisorbed hydrogen is exothermic by 80 kJ mol−1 in the case of H2 on Pt(100) but by 202 kJ mol−1 in the case of D2 on Pt13. In the presence of preadsorbed hydrogen the addition of the first chemisorbed hydrogen to ethene (red frame) determines the observed activation energy of the reaction. The numbers are reaction enthalpies in kJ mol−1 (figure amended from ref. 24, with direction of reaction arrows and sign of reaction enthalpies inverted). | ||
Since the activation of the back-reaction of the first hydrogen transfer (frame in Fig. 9) is small or negligible this step leads to isotopic scrambling when different isotopes are provided in ethene and on the surface. Scrambling was reported by Zaera,24 and it was also observed in the present experiments (see the context of Fig. 6).
In the present context we can also discuss the isotope effect on the TOF (Fig. 7). Under the assumption of isotope-independent preexponential factors the observed TOF ratio of 2.1 translates into a difference in activation energies of only 1.8 kJ mol−1. Based on the observed vibrational frequencies of Pt13Hx the difference in zero-point energies of chemisorbed H and D is estimated to be at least 6 kJ mol−1. However, one also has to consider the difference in zero-point energy in the reaction product, the isotopic ethyl radical. It is clear that this leads to a partial compensation, but because of the uncertainty of the exact structure of the transition state and the presence of isotopic scrambling a further interpretation of the effect appears too speculative.
Overall discussion of energetic aspects and nanocatalytic activity
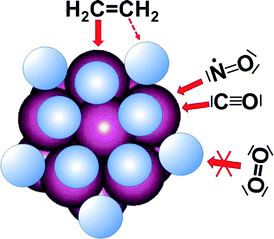
All four reactions reported here have in common that they occur on 13-atom Pt clusters which are saturated by surface-chemisorbed hydrogen (for technical reasons normally in the form of the deuterium isotope) which is η2-bound over the edges of the near-icosahedral cluster. To facilitate the discussion the steric conditions are shown schematically in Fig. 10. It is obvious that the sites atop Pt are well accessible for small molecules, but the other sites are blocked by chemisorbed hydrogen.The binding energy per Pt atom is 557 kJ mol−1 (5.77 eV) in the bulk with a coordination number of 12. The surface atoms of a Pt13 cluster have coordination number 6 in the icosahedron so that the binding energy reduces to 434 kJ mol−1.25 The cluster will break up on CO adsorption when the energy gained on adsorption exceeds the energy spent to break up the cluster. The (CO)(x−1)Pt+−CO (1 ≤ x ≤ 4) bond energy depends strongly on x and amounts to 212 ± 10 kJ mol−1 (x = 1), 193 ± 10 kJ mol−1 (x = 2), 98 ± 5 kJ mol−1 (x = 3), and 53 ± 5 kJ mol−1 (x = 4).26 The first CO molecule can adsorb atop of each surface atom of the intact cluster. Two CO per Pt atom can provide 405 kJ mol−1, which is slightly less than the required 434 kJ mol−1 for cluster break-up. However, the reported stoichiometry of the disintegrated carbonyl complex is Pt2(CO)5,11 giving a stabilisation energy per Pt of 454 kJ mol−1 and thus exceeding the threshold value to break up the cluster, which is in excellent agreement with experimental data and supports the proposed stoichiometry of the carbonyl complex.
The binding energy of NO to Pt was predicted to be slightly more than that of CO. This supports the suggestion based on the EPR spectra (Fig. 2 and 3) that the cluster may break up into similar fragments as with CO, but confirmation by EXAFS would be highly desirable.
Therefore, the following question arises: Why do CO and NO react immediately with the hydrogen-saturated Pt cluster, while O2 nearly does not? We are not aware of any high level calculations of oxygen adsorption on hydrogen-saturated Pt clusters, but on bare surfaces O2 and also HO2 are predicted to adsorb preferentially by bridging two Pt atoms parallel to the edge with an adsorption energy on the order of 100 kJ mol−1.9 End-on adsorption is not an energetic minimum. Atomic oxygen is much more strongly bound (by 360–390 kJ mol−1) with a clear preference to occupy the 3-fold hollow sites. It is this high binding energy which drives dissociation of O2 that has a bond dissociation energy of 498 kJ mol−1. On the hydrogen-covered clusters dissociation cannot occur because the required precursor state, the adsorbed molecular O2, cannot form due to blocking of the adsorption site by hydrogen. We therefore suggest that the correct explanation for the near absence of a reaction of O2 is the blockage of sufficiently strong adsorption sites. It is generally assumed that O2 needs two neighbouring adsorption sites for dissociative chemisorption. On a hydrogen-saturated cluster such a situation is difficult to find. This is consistent with Pt(111) for which it was also reported that O2 chemisorbs only on bare spots.27,28
Ethene is analogous to O2 in the sense that adsorption atop Pt leads to a single bond to Pt and a reduction of the C![[double bond, length as m-dash]](https://www.rsc.org/images/entities/char_e001.gif) C double bond strength to a single bond. The C
C double bond strength to a single bond. The C![[double bond, length as m-dash]](https://www.rsc.org/images/entities/char_e001.gif) C double bond in ethene is given as 728 kJ mol−1 and that of the single bond in ethane is 377 kJ mol−1,29 so that the Pt–C chemical bond would have to compete with the difference, 351 kJ mol−1. However, the bond of ethylidyne to Pt(111) is rated only at ca. 245 kJ mol−1,30 which is not sufficient to break the double bond. It may be inferred that the Pt–C bond may be stronger due to the size effect of Pt13 and the support effect of the KL zeolite, in the same way as for Pt–H where there is as much as 30% enhancement. Secondly, since this is still insufficient, we note that we have used the bond strength of ethylidyne instead of the ethyl radical for which we do not have a bond strength. Furthermore, abstraction of H from the Pt surface under formation of the adsorbed ethyl radical could drive the reaction. Indeed, the ethane C–H bond energy is 423 kJ mol−1, 100 kJ mol−1 more than for the Pt–D bond, so that this does provide a considerable driving force. We also remind that the experiment revealed an activation energy of 90 ± 10 kJ mol−1, which is sufficient to explain the mismatch of the above numbers for the initial chemisorption of ethene so that the overall picture is consistent despite the fact that some of the numbers used in the discussion may not be completely appropriate.
C double bond in ethene is given as 728 kJ mol−1 and that of the single bond in ethane is 377 kJ mol−1,29 so that the Pt–C chemical bond would have to compete with the difference, 351 kJ mol−1. However, the bond of ethylidyne to Pt(111) is rated only at ca. 245 kJ mol−1,30 which is not sufficient to break the double bond. It may be inferred that the Pt–C bond may be stronger due to the size effect of Pt13 and the support effect of the KL zeolite, in the same way as for Pt–H where there is as much as 30% enhancement. Secondly, since this is still insufficient, we note that we have used the bond strength of ethylidyne instead of the ethyl radical for which we do not have a bond strength. Furthermore, abstraction of H from the Pt surface under formation of the adsorbed ethyl radical could drive the reaction. Indeed, the ethane C–H bond energy is 423 kJ mol−1, 100 kJ mol−1 more than for the Pt–D bond, so that this does provide a considerable driving force. We also remind that the experiment revealed an activation energy of 90 ± 10 kJ mol−1, which is sufficient to explain the mismatch of the above numbers for the initial chemisorption of ethene so that the overall picture is consistent despite the fact that some of the numbers used in the discussion may not be completely appropriate.
Conclusions
Hydrogen chemisorbs by forming η2 bonds along the edges of Pt13 clusters. On saturation, this blocks the access to the edges and also to the 3-fold hollow sites, while the direct access atop Pt atoms is essentially unhindered. For CO and NO molecules it is therefore straightforward to react head-on with the C or the N atom, respectively, to form a bond to Pt. For CO and likely also for NO this leads to the break-up of the Pt cluster under formation of molecular complexes which are thermodynamically favoured at more than 2 CO (or NO, respectively) molecules per Pt. O2 can also access this site, but O in O2 is coordinatively saturated by the two bonds to the second O. The resulting bond to Pt is too weak to break the strong O![[double bond, length as m-dash]](https://www.rsc.org/images/entities/char_e001.gif) O double bond and hence does not bind to an H-saturated Pt cluster. In contrast, C in CO and N in NO are under-coordinated and do not have to reduce the bond order to the oxygen significantly when the bond to Pt is formed.
O double bond and hence does not bind to an H-saturated Pt cluster. In contrast, C in CO and N in NO are under-coordinated and do not have to reduce the bond order to the oxygen significantly when the bond to Pt is formed.
The thermodynamic argument of bond order reduction to explain reactivity is delicate since it holds only when the heat of reaction equals the activation energy and there is no further activation barrier. In the case of ethene, reducing the C![[double bond, length as m-dash]](https://www.rsc.org/images/entities/char_e001.gif) C bond order cannot alone be the full explanation since Fig. 7 shows different TOFs for Pt–H and Pt–D for otherwise identical systems, proving that the Pt–hydrogen bond also plays a role. We therefore give preference to the explanation derived in Fig. 9. It is expected that high-level quantum chemical calculations will support and further clarify the details of the reactions studied here.
C bond order cannot alone be the full explanation since Fig. 7 shows different TOFs for Pt–H and Pt–D for otherwise identical systems, proving that the Pt–hydrogen bond also plays a role. We therefore give preference to the explanation derived in Fig. 9. It is expected that high-level quantum chemical calculations will support and further clarify the details of the reactions studied here.
Owing to the significantly larger binding energy of H on the surface of the under-coordinated atoms of the Pt13 clusters the hydrogenation reaction shows roughly double the activation energy compared with the reaction on larger nanoparticles or single crystal surfaces. Thus, on clusters as small as Pt13 ethene hydrogenation finally becomes structure-sensitive. Nevertheless, as found previously, there is significant isotopic scrambling when deuterium is preadsorbed on the catalyst in place of H2. Together with IR spectroscopic evidence at low temperature this suggests that the mechanism of the reaction is the same as reported for the single crystal surface.
Note added in proof: Shortly after submission of this work measurements of the ethene hydrogenation reaction on soft-landed Pt clusters on magnesia as a function of Pt cluster size were reported by Crampton et al.31 A clear maximum TOF for ethane production of 0.0026 s−1 per Pt atom was found for a cluster size of 13 atoms, giving evidence of the structure sensitivity of the reaction at this small cluster size, in good agreement with the conclusion from the present work. The absolute TOF value at 300 K is lower than the present value of 1.0 s−1 by a factor of 385 and is amongst the lowest values reported from various experiments (0.0029–53.4 s−1 per Pt atom).17 We want to emphasise that it is not straightforward to compare the various sets of data despite the fact that we are reporting identical cluster size since the rates will depend significantly on support effects as demonstrated by the different Pt–H bond energies for different zeolite supports.5 Furthermore, the work by Campton was carried out with an equimolar dosage of ethene and hydrogen, whereas the present work relates to a saturation coverage of up to 3 H per Pt atom or 36 H per Pt13 cluster.3
Acknowledgements
We thank Anette Teifel for help with kinetics experiments.References
- E. Roduner, Size matters – why nanomaterials are different, Chem. Soc. Rev., 2006, 35, 583–592 RSC.
- X. Liu, M. Bauer, H. Bertagnolli, E. Roduner, J. van Slageren and F. Philipp, Structure and magnetization of small monodisperse platinum clusters, Phys. Rev. Lett., 2006, 97, 253401 CrossRef PubMed; X. Liu, M. Bauer, H. Bertagnolli, E. Roduner, J. van Slageren and F. Philipp, Structure and magnetization of small monodisperse platinum clusters, Phys. Rev. Lett., 2009, 102, 049902 CrossRef , (erratum).
- C. Jensen, D. Buck, H. Dilger, M. Bauer, F. Phillipp and E. Roduner, Maximum hydrogen chemisorption on KL zeolite supported Pt clusters, Chem. Commun., 2013, 49, 588–590 RSC.
- X. Liu, H. Dilger, R.-A. Eichel, J. Kunstmann and E. Roduner, A Small paramagnetic platinum cluster in NaY zeolite: characterization, and hydrogen adsorption and desorption, J. Phys. Chem. B, 2006, 110, 2013–2023 CrossRef CAS PubMed.
- C. Jensen, J. van Slageren, P. Jakes, R.-A. Eichel and E. Roduner, Support effects on hydrogen desorption, isotope exchange, chemical reactivity and magnetism of platinum nanoclusters in KL zeolite, J. Phys. Chem. C, 2013, 117, 22732–22745 CAS.
- E. Roduner, C. Jensen, J. van Slageren, R. A. Rakoczy, O. Larlus and M. Hunger, Anomalous diamagnetic susceptibility in 13-atom platinum nanocluster superatoms, Angew. Chem., Int. Ed., 2014, 53, 4318–4321 CrossRef CAS PubMed.
- M. Keppeler and E. Roduner, Platinum hydrogen vibrations and low energy electronic excitations of 13-atom Pt nanoclusters, Phys. Chem. Chem. Phys., 2014, 16, 26613–26616 RSC.
- S. C. Badescu, P. Salo, T. Ala-Nissila, S. C. Ying, K. Jacobi, Y. Wang, K. Bedürftig and G. Ertl, Energetics and vibrational states for hydrogen on Pt(111), Phys. Rev. Lett., 2002, 88, 136101 CrossRef CAS PubMed.
- A. Panchenko, M. T. M. Koper, T. E. Shubina, S. J. Mitchel and E. Roduner, Ab initio calculations of intermediates of oxygen reduction on low index platinum surfaces, J. Electrochem. Soc., 2004, 151, A2016–A2027 CrossRef CAS.
- K. Chakarova, K. Hadjivanov, G. Atanasova and K. Tenchev, Effect of preparation technique on the properties of platinum in NaY zeolite: A study by FTIR spectroscopy of adsorbed CO, J. Mol. Catal. A: Chem., 2007, 264, 270–279 CrossRef CAS.
- Y. Akdogan, S. Anantharaman, X. Liu, G. K. Lahiri, H. Bertagnoli and E. Roduner, Reconstruction of Pt13 clusters into Pt2(CO)m on CO addition in NaY zeolite, J. Phys. Chem. C, 2009, 113, 2352–2359 CAS.
- M. E. Bartram, B. E. Koel and E. A. Carter, Electronic effects of surface oxygen on the bonding of NO to Pt(111), Surf. Sci., 1989, 219, 467–489 CrossRef CAS.
- P. S. Cremer, X. Su, Y. Shen and G. A. Somorjai, Ethylene hydrogenation on Pt(111) monitored in situ at high pressures using sum frequency generation, J. Am. Chem. Soc., 1996, 118, 2942–2949 CrossRef CAS.
- W. Wasylenko and H. Frei, Direct observation of surface ethyl to ethane interconversion upon C2H4 hydrogenation over Pt/Al2O3 catalyst by time-resolved FT-IR spectroscopy, J. Phys. Chem. B, 2005, 109, 16873–16878 CrossRef CAS PubMed.
- A. Tilekaratne, J. P. Simonovis, M. F. López Fagúndez, M. Ebrahimi and F. Zaera, Operando studies of the catalytic hydrogenation of ethylene on Pt(111) single crystal surfaces, ACS Catal., 2012, 2, 2259–2268 CrossRef CAS.
- C.-K. Tsung, J. N. Kuhn, W. Huang, C. Aliaga, L.-I. Hung, G. A. Somorjai and P. Yang, J. Am. Chem. Soc., 2009, 131, 5816–5822 CrossRef CAS PubMed.
- R. M. Rioux, H. Song, J. D. Hoefelmeyer, P. Yang and G. A. Somorjai, High-surface-area catalyst design: Synthesis, characterization and reaction studies of platinum nanoparticles in mesoporous SBA-15 silica, J. Phys. Chem. B, 2005, 109, 2192–2202 CrossRef CAS PubMed.
- T. Imaoka, H. Kitazawa, W.-J. Chun, S. Omura, K. Albrecht and K. Yamamoto, Magic number Pt13 clusters and misshapen Pt12 clusters: which one is the better catalyst?, J. Am. Chem. Soc., 2013, 135, 13089–13095 CrossRef CAS PubMed.
- E. Roduner, Understanding catalysis, Chem. Soc. Rev., 2014, 34, 8226–8239 RSC.
- M. J. Frisch, G. W. Trucks, H. B. Schlegel, G. E. Scuseria, M. A. Robb, J. R. Cheeseman, G. Scalmani, V. Barone, B. Mennucci, G. A. Petersson, H. Nakatsuji, M. Caricato, X. Li, H. P. Hratchian, A. F. Izmaylov, J. Bloino, G. Zheng, J. L. Sonnenberg, M. Hada, M. Ehara, K. Toyota, R. Fukuda, J. Hasegawa, M. Ishida, T. Nakajima, Y. Honda, O. Kitao, H. Nakai, T. Vreven, J. A. Montgomery Jr., J. E. Peralta, F. Ogliaro, M. Bearpark, J. J. Heyd, E. Brothers, K. N. Kudin, V. N. Staroverov, T. Keith, R. Kobayashi, J. Normand, K. Raghavachari, A. Rendell, J. C. Burant, S. S. Iyengar, J. Tomasi, M. Cossi, N. Rega, J. M. Millam, M. Klene, J. E. Knox, J. B. Cross, V. Bakken, C. Adamo, J. Jaramillo, R. Gomperts, R. E. Stratmann, O. Yazyev, A. J. Austin, R. Cammi, C. Pomelli, J. W. Ochterski, R. I. Martin, K. Morokuma, V. G. Zakrzewski, G. A. Voth, P. Salvador, J. J. Dannenberg, S. Dapprich, A. D. Daniels, O. Farkas, J. B. Foresman, J. V. Ortiz, J. Cioslowski and D. J. Fox, Gaussian 09, Revision D.01, Gaussian, Inc., Wallingford CT, 2013 Search PubMed.
- GaussView: Version 5.0.9, Dennington R.(II). Shawnee Mission, KS: T. Keith, J. Millam, Semichem, Inc., 2009 Search PubMed.
- F. M. Dautzenberg, Ten guidelines for catalyst testing, in Characterization and Catalyst Development – an Interactive Approach, ed. S. A. Bradley, M. J. Gattuso and R. J. Bertolacini, ACS Symposium Series, Nr. 411, American Chemical Society, Washington, DC, 1989, pp. 99–119 Search PubMed.
- A. S. Pine and W. J. Lafferty, Torsional splittings and assignment of the Doppler-limited spectru of ethane in the C-H stretching region, J. Res. Natl. Bur. Stand., 1982, 87, 237–256 CrossRef CAS.
- F. Zaera, Mechanism of ethylene hydrogenation and hydrogen-deuterium exchange over platinum(111), J. Phys. Chem., 1990, 94, 5090–5095 CrossRef CAS.
- B. Lee and K. Cho, Extended embedded-atom method for platinum nanoparticles, Surf. Sci., 2005, 600, 1982–1990 CrossRef.
- X.-G. Zhang and P. B. Armentrout, Sequential bond energies of Pt(CO)x+ (x=1-4) by collision-induced dissociation, Organometallics, 2001, 20, 4266–4273 CrossRef CAS.
- K. Gustafsson and S. Andersson, Leakage of O2 precursor molecules from inert hydrogen islands on a Pt(111) Surface, Phys. Rev. Lett., 2006, 97, 076101 CrossRef CAS PubMed.
- J. B. MacNaughton, L. Naslund, T. Anniyev, H. Ogasawara and A. Nilsson, Peroxide-like intermediate observed at hydrogen-rich condition on Pt(111) after interaction with oxygen, Phys. Chem. Chem. Phys., 2010, 12, 5712–5716 RSC.
- S. J. Blanksby and G. B. Ellison, Bond dissociation energies of organic molecules, Acc. Chem. Res., 2003, 36, 255–263 CrossRef CAS PubMed.
- H. Gross, C. T. Campbell and D. A. King, Metal-carbon bond energies for adsorbed hydrocarbons from calorimetric data, Surf. Sci., 2004, 572, 179–190 CrossRef CAS.
- A. S. Crampton, M. D. Rötzer, C. J. Ridge, F. F. Schweinberger, U. Heiz, B. Yoon and U. Landman, Structure sensitivity in the non-scalable regime explored via catalysed ethylene hydrogenation on supported platinum nanoclusters, Nat. Commun., 2016, 7, 10389 CrossRef CAS PubMed.
Footnotes |
| † Electronic supplementary information (ESI) available: Calculated IR vibrational spectra of deuterated ethane isotopologues. See DOI: 10.1039/c6cy00182c |
| ‡ Present address: Eichenweg 5c, D-89290 Buch, Germany |
| § Present address: Faculty of Materials Science and Engineering, Hubei University, No. 368 Youyi Avenue, Wuchang, Wuhan 430062, China |
| ¶ Present address: ThyssenKrupp Industrial Solutions AG, Business Unit Process Technologies, Neubeckumer Straße 127, D-59320 Ennigerloh, Germany |
| This journal is © The Royal Society of Chemistry 2016 |

