 Open Access Article
Co-promoted MoO3 nanoclusters for hydrodesulfurization†
Rupesh
Singh
a,
Deepak
Kunzru
*a and
Sri
Sivakumar
*ab
aDepartment of Chemical Engineering, Indian Institute of Technology Kanpur, Kanpur 208016, UP, India. E-mail: dkunzru@iitk.ac.in; Fax: +91 512 2590104; Tel: +91 512 2597193
bMaterial Science Programme, DST Thematic Unit of Excellence on Soft Nanofabrication, Centre for Environmental Science & Engineering, Indian Institute of Technology Kanpur, Kanpur 208016, UP, India. E-mail: srisiva@iitk.ac.in; Fax: +91 512 2590104; Tel: +91 512 2597697
First published on 25th April 2016
Abstract
In this paper, we report the synthesis of ultrasmall Co-promoted MoO3 nanoclusters (∼2 nm) supported over γ-Al2O3 possessing an increased number of Mo edge atoms, using colloidal synthesis for hydrodesulfurization reaction. A three-step synthesis methodology was followed: in the first step, Co-promoted MoO3 nanoclusters (∼2 nm) were synthesized using oleic acid and oleylamine as capping agents. In the second step, oxide nanoclusters were supported over γ-Al2O3 and then calcined. In the third step, supported metal oxide nanoclusters were sulfided using dimethyl disulfide as a sulfiding agent. These catalysts show enhanced catalytic activity towards hydrodesulfurization of dibenzothiophene compared to those prepared by using the conventional metal impregnation method due to the presence of a higher number of Mo edge atoms (36%), easier reducibility and sulfidability. The catalysts were characterized by using transmission electron microscopy (TEM), X-ray photoelectron spectroscopy (XPS), X-ray diffraction (XRD) and temperature programmed reduction (TPR) analysis.
1. Introduction
Hydrodesulfurization (HDS) is a catalytic chemical process which is used to remove organosulfur compounds present in petroleum feedstocks. Because of strict environmental regulations along with enhancement of sulfur content in the petroleum feed, the efficiency of the HDS process has to be significantly improved.1–4 Co promoted MoS2 and Ni promoted MoS2 are widely used as catalysts for the HDS process in which the Co promoted catalyst is preferred for feed containing only sulfur as an impurity.5–7 Incorporation of Co as a promoter into MoS2 lowers the metal sulfur bond strength facilitating sulfur vacancy formation8 which in turn enhances the catalytic activity.9,10 In addition, optimal number of Mo edge atoms present in the MoS2 phase, easier reducibility and sulfidability of the MoO3 phase enhance the HDS activity of the catalysts. The number of Mo edge atoms is mainly determined by the size of the sulfided catalyst. In this regard, two models (rim-edge and brim site) have been proposed for unsupported MoS2 in which rim sites (top and bottom layers) are considered to catalyze the hydrogenation and direct desulfurization (C–S bond cleavage), while the edge sites (interior layers) are responsible for direct desulfurization.11,12 Berhault et al.13 have extended these models for supported catalysts and proposed two types of sites (types I and II) for each model, in which type II sites are easily reducible due to a weak metal–support interaction, whereas type I sites are difficult to be reduced.14–16 In addition, they proposed that the formation of sulfur vacancies depends on the metal–support interaction. This is further supported by another study by Besenbacher and his coworkers17 in which they demonstrated that MoS2 nanoclusters of ∼1.5 nm size have optimal number of Mo edge atoms and possess enhanced organosulfur adsorption which suggests the importance of the nanocluster size. In addition, a smaller nanocluster size enhances the probability of formation of surface defects such as kinks and corners having under-coordinated surface sites which contribute to increased catalytic activity. Apart from edge atoms, easier reducibility and sulfidability of the catalyst also play a major role in determining the catalytic activity which is mainly determined by the metal–support interaction.18,19 Thus, it is essential to prepare sulfided cobalt promoted Mo nanoclusters of ∼2 nm size with easier reducibility and sulfidability in order to have enhanced HDS catalytic activity. To this end, we report a simple method for developing sulfided Co promoted Mo nanoclusters of ∼2 nm size. There are several reports available on the development of cobalt promoted Mo catalyst on various supports using different synthesis methods such as wet impregnation, co-precipitation and physical mixing methods.20,21 Although the catalysts prepared by these methods show reasonable activity towards desulfurization of dibenzothiophene (DBT), they are unable to control the cluster size and uniformity of the metal crystallites which impede their catalytic activity. It is well known that the size of the nanoclusters can be easily controlled in the ligand-mediated colloidal co-precipitation method in which the ligand controls the growth of the nanoclusters.22,23 The synthesis of several bimetallic nanoclusters (e.g. PtRu, PdRh, and PtSn) of 1–10 nm size through colloidal synthesis has been reported.24–26 However, no reports on the synthesis of Co-promoted MoO3 nanoclusters of ∼2 nm size using colloidal synthesis for HDS are available.Herein, we report the synthesis of ultrasmall Co-promoted MoO3 nanoclusters (∼2 nm) prepared by a size-controllable colloidal approach using oleic acid and oleylamine as capping agents. These nanoclusters were supported on Al2O3 and then calcined and sulfided to form Co-promoted MoS2 nanoclusters. The proposed method has the following advantages: 1) control over the size with high monodispersity determining the number of Mo edge atoms, 2) uniform metal composition distribution within the support, and 3) easier reducibility and sulfidability due to the weaker metal–support interaction facilitated by post loading of the metal cluster over the support. All the above factors enhance the HDS catalytic activity of the prepared catalysts compared to that of the catalysts prepared by the widely used wet impregnation method. TEM analysis of the unsupported catalyst shows the formation of ∼2 nm particles, and the number of edge atoms present in the sulfided active phase have been calculated using the well-known method proposed by Hensen et al.27 XRD analysis of calcined γ-Al2O3 supported CoMo confirms the formation of MoO3 phases. The liquid feed of 1.68 wt% DBT in n-decane (corresponding to 2920 ppm sulfur in the feed) was used to investigate the HDS activity of the CoMo/γ-Al2O3 catalysts.
2. Experimental section
2.1. Catalyst preparation
Co-promoted MoO3 nanoclusters were produced by the decomposition of molybdenum hexacarbonyl and cobalt acetylacetonate, in the presence of oleylamine as a ligand, along with oleic acid and trioctylphosphine. Co(acac)2 first forms a complex with oleylamine. The Co complex and Mo(CO)6 thermally decompose at ∼503 K to form metal oxide nanoclusters surrounded by the surfactants. The mixture was then cooled to room temperature, and then acetone was added to the mixture to precipitate the particles. The metal oxide nanoclusters were then recovered by centrifugation.
The Co-promoted MoO3 nanoclusters thus obtained were dispersed in n-hexane, and a required amount of γ-Al2O3 was added to the dispersion; the mixture of nanoclusters and γ-Al2O3 was kept under stirring for 6 h, so that the pores of Al2O3 were filled with the dispersion of the nanoclusters. The slurry was then centrifuged to remove the supernatant. The as-prepared CoMo/γ-Al2O3 was heated at 373 K for 2 h to remove all the remaining volatile compounds (e.g. n-hexane) and then calcined at 823 K for 2 h. In the calcination step, the surfactant was removed, and the metal species bound to the Al2O3 surface due to the metal–support interaction. Li et al.28 used a similar approach to load PdSn nanoparticles over a carbon support. Catalysts with different metal contents were prepared by varying the amount of precursors. The different catalysts prepared for this study are shown in Table 1. For all the catalysts, the Co/(Co + Mo) atomic ratio was 0.3 ± 0.02. Co-promoted MoO3 nanoparticles of ∼10 nm size (CoMo 5) were prepared by increasing the reaction time to 30 min.
| Catalyst code | Al2O3 (wt%) | MoO3 (wt%) | Co2O3 (wt%) | Surface area (m2 g−1) | Pore volume (cm3 g−1) | Co/(Co + Mo) |
|---|---|---|---|---|---|---|
| Al2O3 | — | — | — | 201.3 | 0.86 | — |
| CoMo 1 | 78.4 | 17.1 | 4.5 | 120.7 | 0.34 | 0.28 |
| CoMo 2 | 83.6 | 13.2 | 3.2 | 140.4 | 0.41 | 0.29 |
| CoMo 3 | 85.7 | 11.2 | 3.1 | 144.0 | 0.42 | 0.32 |
| CoMo 4 | 89.1 | 8.7 | 2.2 | 149.1 | 0.44 | 0.30 |
| CoMo 5 | 83.0 | 13.6 | 3.4 | 138.4 | 0.40 | 0.31 |
| CoMo C1 | 82.6 | 13.9 | 3.5 | 142.8 | 0.40 | 0.30 |
2.2. Catalyst characterization
The compositions of the prepared CoMo/γ-Al2O3 samples were determined using the X-ray fluorescence technique (XRF). The analysis was carried out using a Rigaku ZSX Primus II XRF spectrometer. For XRF analysis, the calcined samples were pelletized using a hydraulic press at a pressure of 15–20 tons. For the analysis of Al, the sample was excited using a current of 100 mA and a voltage of 30 kV. For Co and Mo, these values were fixed at 60 mA and 50 kV. The surface area, pore volume, and pore size distribution were determined based on the amount of N2 that was adsorbed and desorbed at 77 K, using an Autosorb-1C (model: AS1-C, Quantachrome, USA). X-Ray diffraction (XRD) was performed using a PANanalytical X-ray diffractometer with Co filtered Kα radiation from a Cu target (λ = 1.541841 Å). The sample was scanned between the angles of 10–80° at a scan rate of 3° min−1. TEM analysis of the unsupported and γ-Al2O3 supported CoMo samples was carried out using a FEI Tecnai™ G2 U-Twin (200 kV) transmission electron microscope. For TEM analysis, the samples were dispersed in n-hexane. 5 μl of the sample was loaded on a carbon-coated copper grid which was dried under vacuum.The surface elemental composition and chemical state of the components of the fresh and sulfided catalysts were analyzed by XPS using a PHI Versa Probe II scanning XPS microprobe.
The Mo degree of sulfidation (MoDS) was calculated according to the following equation:
 | (1) |
In eqn (1), C is the concentration expressed in at%.
Temperature programmed reduction (TPR) analysis of the supported catalyst sample was performed to determine the reducibility of the material, using a Quantachrome instrument. TPR was performed in a U-shaped quartz tube using 5% (v/v) H2 in N2. The test sample (∼150 mg) was degassed in He flow at 473 K for 2 h prior to the analysis. To remove the surface moisture and volatile impurities, the sample was then cooled to room temperature in the presence of an inert gas. Then, 5% H2 in N2 was introduced at 10 ml min−1 for 30 min at 313 K. The sample temperature was continuously raised from 313 K to 1273 K at 15 K min−1. Mass spectra were acquired using a time-of-flight mass spectrometer (MALDI-TOF-TOF Autoflex II TOF-TOF, Bruker DaltoCocs, Bremen, Germany) equipped with a nitrogen laser (λ = 337 nm). Scan accumulation and data processing were performed using Flex Analysis 3.4 software. FTIR spectra were recorded on a Spectrum II Perkin Elmer instrument in the wavenumber range of 600–4000 cm−1, using attenuated total reflectance (ATR) with a germanium (Ge) crystal. The spectra and the corresponding data acquisition were automatically obtained using an interfaced computer and a Perkin Elmer Spectrum II software package.
The average metal oxide nanocluster size (Sizeavg) was calculated according to the following equation:
 | (2) |
In eqn (2), ni is the number of nanoclusters with size di. The calculations were performed by taking five images which included ∼50 nanoclusters each.
The average slab length (Lavg) and stacking number (Navg) were calculated according to the following equations:
 | (3) |
We followed a method proposed by Hensen et al.27 to calculate the average fraction of Mo atoms on the edge surface of the MoS2 crystals (fMo) assuming that the MoS2 crystals are perfect hexagons.27fMo was determined using eqn (4):
 | (4) |
 | (5) |
The numerator is the number of atoms in the active atoms in the crystal; ni is the number of Mo atoms in one edge, which is determined from the length L calculated from TEM images.
The Raman spectra of the fresh and spent catalysts were recorded using a Raman spectrometer (Sentera, Bruker Optik GmbH). An Ar-ion laser having a wavelength of 532 nm was used for excitation. A laser power of 2 mW was used to obtain the Raman spectra. A scanning electron microscopy image of the supported CoMo 2 sample was obtained using Carl Zeiss (NTS GmbH-SUPRA 40VP) equipment, equipped with an X-ray energy-dispersive (EDX) microanalyzer.
2.3. Catalytic activity test
A downflow fixed bed reactor was used to evaluate the catalytic activity for hydrodesulfurization (HDS) of dibenzothiophene (DBT). The same set-up was used for sulfiding and testing the activity of the catalyst. A schematic of the experimental set-up is shown in Fig. S1.† The liquid feed was fed by a high pressure metering pump and mixed with the feed gases before the reactor inlet. The gas flow was regulated by mass flow controllers. The stainless steel reactor tube (i.d.: 3.2 mm; length: 300 mm) was mounted vertically in a furnace of 270 mm length. A type K thermocouple, in direct contact with the catalyst bed, was used to measure the catalyst bed temperature. The reactor pressure was maintained by a back pressure regulator (BPR), which was installed just after the condenser. The condensed reactor effluent from the BPR was directed through a gas–liquid separator. The liquid product was collected for analysis, and the non-condensable ones were vented. The liquid sample was analyzed using a gas chromatograph equipped with a Petrocol DH capillary column (100 m × 0.25 mm) with a FID detector. Before catalyst evaluation, the as-prepared catalyst powder was pelletized, crushed, and sieved, and the 0.25–0.3 mm size fraction was used for activity testing.The catalyst was first sulfided in situ using 10 wt% dimethyl disulfide (DMDS) dissolved in n-heptane. For the sulfiding, the catalyst temperature was first increased at atmospheric pressure from 298 K to 433 K in 2 h under a helium flow of 30 cm min−1. When the temperature reached 423 K, the helium flow was stopped and the reactor pressure gradually increased by feeding hydrogen at a flow rate of 100 ml min−1. The sulfiding feed (0.17 ml min−1) was started when the reactor pressure had reached 1 MPa. Under the combined flow of liquid and hydrogen, the reactor pressure was further increased to 3 MPa. The catalyst was kept at this temperature for 1 h. The temperature was then increased from 433 K to 503 K in 2 h, maintained at 503 K for 3 h and then further increased to 613 K in 2 h and kept at this temperature for 10 h.
After sulfiding, the HDS activity of the catalyst was investigated at 3 MPa pressure in the temperature range of 548–608 K. The liquid feed was 1.68 wt% DBT in n-decane, corresponding to a sulfur content of 2920 ppm in the liquid feed. For all the runs, the flow rate of hydrogen was 110 ml min−1 and the flow rate of liquid was varied between 0.1–0.3 ml min−1. The catalyst was stabilized for at least 1 h before acquiring the samples for GC analysis.
3. Results and discussion
3.1. Catalyst characterization
As shown in Fig. 1, the synthesized unsupported Co promoted MoO3 metal oxide nanoclusters after a reaction time of 10 min were highly monodisperse, with an average size of 2.3 nm. The size of the clusters is controlled by the surfactants which act as stabilizers for the nanoclusters by hindering their growth through Ostwald ripening. The size of the metal oxide nanoclusters increased from ∼2 nm to ∼10 nm when the reaction time was increased from 10 to 30 minutes. This increase in size is due to the tendency of the metal oxide nanoclusters to aggregate with ageing time beyond a critical time.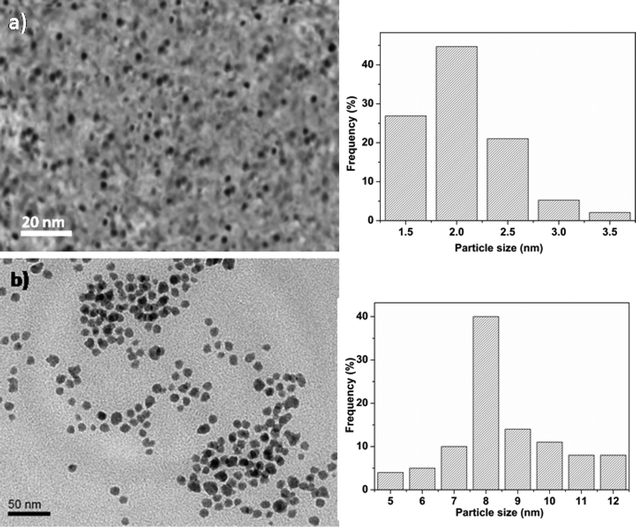 | ||
| Fig. 1 TEM images of unsupported CoMo metal oxide nanoclusters prepared at different reaction times: (a) 10 min and (b) 30 min. | ||
In order to investigate the presence of ligands on the unsupported CoMo metal oxide nanocluster surface, FTIR studies were carried out. The FTIR spectra (Fig. S2†) of the unsupported metal oxide nanocluster show bands at 3358 cm−1, 2926 cm−1, 2846 cm−1 and 1640 cm−1. The bands at 2926 cm−1 and 2846 cm−1 were assigned to the asymmetric (Vas) and symmetric (Vs) stretching vibrations of methylene (CH2). The band at 1640 cm−1 is due to the presence of the (C![[double bond, length as m-dash]](https://www.rsc.org/images/entities/char_e001.gif) O) group. The broad band at 3358 cm−1 was attributed to the presence of the –OH stretch in the carboxylic acid. This implies that the oleic acid molecules are attached to the nanocluster surface. The MALDI-TOF spectra of unsupported Co-promoted MoO3 nanoclusters (Fig. S3†) show a peak at 1031.5 (m/z) suggesting the formation of Co2Mo6O20 clusters (the calculated value is 1013.5, along with water = 1031.5). After synthesis, the prepared nanoclusters were dispersed in n-hexane and were then supported over γ-Al2O3 to increase the dispersion of the nanoclusters.
O) group. The broad band at 3358 cm−1 was attributed to the presence of the –OH stretch in the carboxylic acid. This implies that the oleic acid molecules are attached to the nanocluster surface. The MALDI-TOF spectra of unsupported Co-promoted MoO3 nanoclusters (Fig. S3†) show a peak at 1031.5 (m/z) suggesting the formation of Co2Mo6O20 clusters (the calculated value is 1013.5, along with water = 1031.5). After synthesis, the prepared nanoclusters were dispersed in n-hexane and were then supported over γ-Al2O3 to increase the dispersion of the nanoclusters.
For HDS catalytic applications, the surfactants bound on the surface need to be removed because they block the catalytically active sites; they were removed by calcination of supported CoMo/γ-Al2O3. Thermogravimetric analysis was carried out to determine the minimum calcination temperature for complete removal of the surfactants from the nanoclusters. The thermogravimetric analysis of the unsupported CoMo nanocluster (Fig. S4†) showed that with an increase in temperature there was a gradual weight loss of the sample until 773 K. Beyond this temperature, there was no change in the sample weight, confirming that the surfactants were completely removed at 773 K. This was also confirmed using FTIR analysis. FTIR analysis of the calcined sample (Fig. S2†) shows the disappearance of characteristic peaks at 2926 cm−1 and 2846 cm−1 corresponding to CH2 and 1640 cm−1 corresponding to C![[double bond, length as m-dash]](https://www.rsc.org/images/entities/char_e001.gif) O, confirming the removal of surfactant molecules.
O, confirming the removal of surfactant molecules.
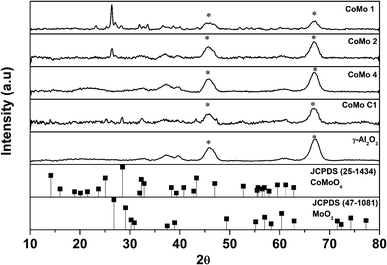
The XRD data of calcined γ-Al2O3 supported CoMo metal oxide nanoclusters are shown in Fig. 2. The XRD analysis shows MoO3 (JCPDS 47-1081) as the major phase. With an increase in metal loading, diffraction peaks became more prominent. The diffraction peak at 2θ = 26.8° corresponds to the (011) plane of the MoO3 orthorhombic phase. The two broad diffraction peaks at 2θ = 46° and 67° correspond to γ-Al2O3 which was used as the support to disperse the synthesized Co-promoted MoO3 nanoclusters. No peaks corresponding to Co or any of its oxide phases were detected. In contrast, the CoMo/γ-Al2O3 catalyst prepared using the conventional impregnation method showed diffraction peaks at 2θ = 14.2°, 25.1° and 28.5° corresponding, respectively, to the (110), (002) and (220) planes of the CoMoO4 orthorhombic phase.
Fig. S5† shows the XRD analysis of unsupported uncalcined nanoclusters. Because of the smaller size of the nanoclusters, the XRD analysis of unsupported CoMo (uncalcined sample) gave only a broad peak between the 2θ values of 25° and 30° which is attributed to the MoO3 phase. Fig. S6† shows the XRD analysis of calcined unsupported CoMo clusters. The XRD pattern shows the formation of MoO3 at 2θ = 26.8° and the CoMoO4 phase at 2θ = 14.2°, 25.1° and 28.5°. Except for the catalyst with the highest metal loading (CoMo 1) in the supported catalysts, the peaks for CoMoO4 could not be detected, indicating good metal dispersion. Fig. S7† shows the XRD analysis of Co/γ-Al2O3, and a comparison with the JCPDS clearly shows the formation of CoAl2O4 which matches with earlier reports.29–31
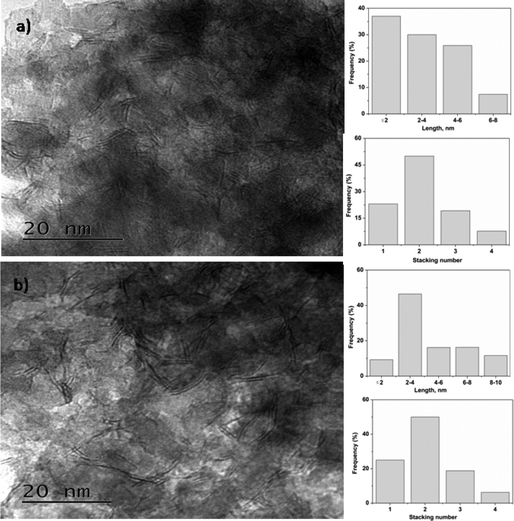
Fig. 3 shows the TEM images of CoMo 2 and CoMo C1, respectively. The TEM image (Fig. 3a) reveals that Co-promoted MoO3 nanoclusters supported over γ-Al2O3 and calcined at 823 K were in the size range of ∼2.5 ± 1 nm. Comparing Fig. 1a with Fig. 3a, it can be concluded that there was no significant change in the nanocluster size between supported and unsupported Co-promoted MoO3 nanoclusters. In contrast, the TEM image of the CoMo/γ-Al2O3 catalyst prepared using the incipient wetness impregnation method shows polydispersity, and the particles were found to be in the size range of 4 ± 3 nm. The specific surface area and pore volume of the synthesized catalyst samples were determined using nitrogen adsorption–desorption and are listed in Table 1. The surface area and pore volume decreased with an increase in metal loading.
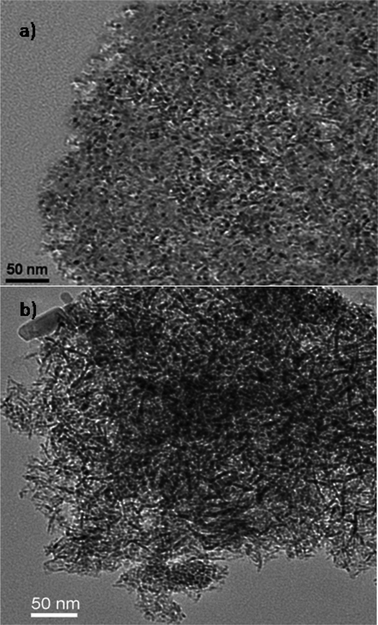 | ||
| Fig. 3 TEM images of the γ-Al2O3 supported CoMo catalyst prepared using (a) colloidal synthesis and (b) the conventional impregnation method. | ||
The comparative TPR analysis of the CoMo/γ-Al2O3 catalyst prepared using colloidal synthesis and the catalyst prepared by the conventional impregnation method is shown in Fig. 4. The reduction profile of the catalyst shows hydrogen consumption in a broad temperature interval (between 673 and 1273 K) with two main reduction peaks at 755 K and 1118 K. The lower temperature peak (755 K) can be attributed to the first step of reduction (from Mo6+ to Mo4+). The peak at 1118 K can be ascribed to the reduction of Mo4+ to Mo0.32,33 Two similar reduction peaks were observed for the CoMo/γ-Al2O3 catalyst prepared using the conventional impregnation method, with a shift in reduction positions towards higher temperature. The shift in the first and second reduction peaks was found to be 20 K and 28 K, respectively. The TPR results shows that CoMo metal oxide nanoclusters prepared using colloidal synthesis are more easily reducible in comparison to the catalyst prepared using the conventional impregnation method. The colloidally synthesized catalyst showed a small reduction peak at 871 K corresponding to the transformation of Co2+ to Co0. The TPR analysis of Co/γ-Al2O3 is shown in Fig. S8,† showing a reduction peak at 970 K and an incomplete reduction peak between 1170–1273 K. Due to instrument limitations, data collection above 1273 K was not possible.
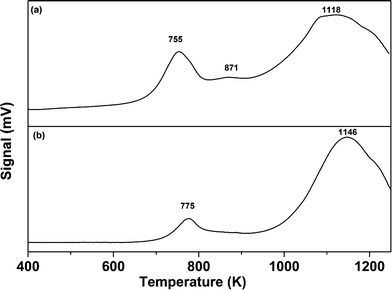 | ||
| Fig. 4 TPR profile of the CoMo/γ-Al2O3 catalyst prepared using (a) colloidal synthesis (CoMo 2) and (b) the incipient wetness impregnation method (CoMo C1). | ||
Different studies have reported that for CoO on γ-Al2O3, three types of cobalt species, namely, Co3O4, surface Co2+ and spinel CoAl2O4, are present which are reduced in the temperature regions of 573–673 K, 873–923 K and 1173–1223 K, respectively.14,34,35 TPR analysis of the Co/γ-Al2O3 sample did not show any reduction peak in the temperature range of 573 to 673 K. Thus, the reduction peak at 970 K is assigned to the reduction of Co2+ to Co0, and the peak beyond 1200 K is assigned to the reduction of CoAl2O4. It seems that in the CoMo 2 catalyst (Fig. 4a), the reduction temperature of Co2+ to Co0 is reduced to 871 K due to the weaker metal–support interaction. The TPR data for Co/γ-Al2O3 show that the reduction peak for CoAl2O4 will merge with the reduction peak of Mo4+ to Mo0.
The Mo 3d XPS spectra of oxidized and sulfided CoMo 2 and CoMo C1 are shown in Fig. 5. The spectra of both unsulfided CoMo 2 and CoMo C1 catalysts (Fig. 5a and c) consist of a Mo 3d doublet with a Mo 3d5/2 binding energy of 232.2 eV. This corresponds to molybdenum in the +6 oxidation state. As can be seen from Fig. 5b, after sulfiding of CoMo 2, the binding energy shifted to 228.8 eV which is typical of Mo4+ in the MoS2 phase.36 The shoulder present in sulfided CoMo2 having a binding energy of 226.1 eV corresponds to the S2s line. After sulfiding, CoMo C1 shows a Mo 3d5/2 binding energy of 229.1 eV, corresponding to the Mo4+ oxidation state. In addition, the XPS spectra also show Mo in the +5 oxidation state (Mo 3d5/2: 231.2 eV and Mo 3d3/2: 234.2 eV). The XPS analysis shows that CoMo C1 is not completely sulfided; this could be due to the higher metal–support interaction, which will lower the sulfidability of the catalyst. Fig. 6 shows the XPS spectra of fresh and sulfided CoMo 2 and CoMo C1 catalysts. The XPS spectra of sulfided catalysts confirm the formation of CoMoS (B.E. = 779.2 eV) in the case of both CoMo 2 and CoMo C1 catalysts. The presence of Co9S8 (B.E. = 778.4 eV) was detected in the case of the CoMo C1 catalyst.37,38 Since the binding energies of Co9S8 and CoMoS are very close (0.8 V),39 decomposition of the colloidally synthesized catalyst has to be taken carefully. Table 2 shows the XPS analysis of the sulfided CoMo 2 and CoMo C1 catalysts. Because of lower sulfidability, CoMo C1 showed a lower S/Al ratio in comparison to the CoMo 2 catalyst. The approximate amount of the CoMoS phase in the case of the CoMo 2 catalyst is ∼30% of the Co atoms, whereas in the case of CoMo C1, the CoMoS phase was found to be ∼25% of the total Co atoms.
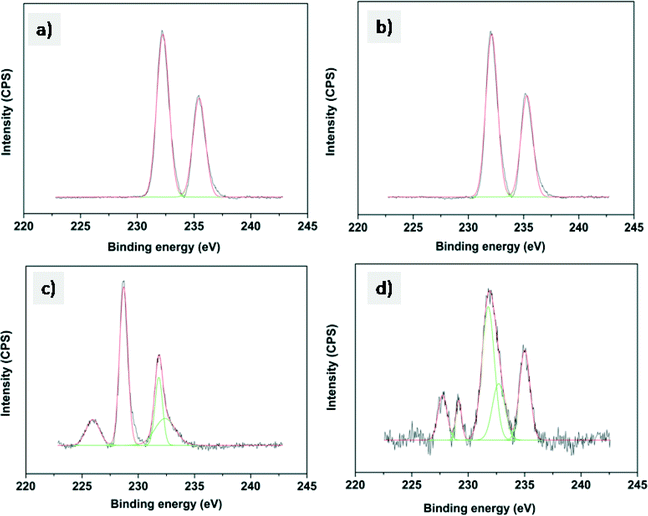 | ||
| Fig. 5 XPS of the Mo 3d envelope of a) CoMo 2, b) sulfided CoMo 2, c) CoMo C1 and d) sulfided CoMo C1. | ||
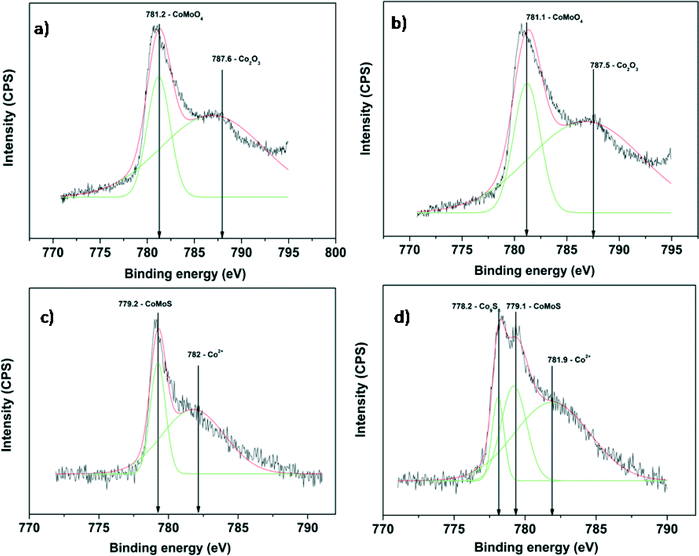 | ||
| Fig. 6 XPS of the Co 2p envelope of a) CoMo 2, b) sulfided CoMo 2, c) CoMo C1 and d) sulfided CoMo C1. | ||
| Sample code | Mo/Al (atomic ratio) | Co/Al (atomic ratio) | Co/Mo (atomic ratio) | S/Al (atomic ratio) | Degree of Mo sulfidation (%) |
|---|---|---|---|---|---|
| CoMo 2 | 0.26 | 0.13 | 0.50 | 0.60 | 70.53 |
| CoMo C1 | 0.28 | 0.14 | 0.50 | 0.53 | 30.31 |
The SEM–EDX images of the CoMo 2 catalyst (Fig. S9†) show the distribution of Co and Mo species on the alumina support. The red and green dots represent Mo and Co species, whereas the alumina surface is represented in dark color. The image confirms the homogeneous distribution of Co and Mo species over the alumina surface, with no evidence of aggregate formation.
For HDS, CoMoS is considered to be the active phase with Co on the edge of the MoS2 slabs. The catalytic activity of the HDS catalyst is influenced by the slab length and stacking number.40 TEM analysis of sulfided CoMo 2 and CoMo C1 is shown in Fig. 7. The TEM image along with a histogram of the sulfided catalysts show the presence of a layered structure suggesting the formation of the sulfide phase which also matches with the previous reports.41 The average slab length of CoMo 2 was found to be ∼3.4 nm in comparison to a slab length of ∼4.7 nm for the CoMo C1 catalyst. It is evident from the TEM images that the average slab length of sulfided CoMo 2 is shorter than that of CoMo C1. The average stacking number of the sulfided CoMo 2 was found to be ∼2.1 in comparison to the average stacking number of ∼1.9 for CoMo C1. The slab length and stacking number were used to determine the average fraction of Mo edge atoms on the MoS2 crystallites (fMo) by the method reported by Hensen et al.27 For CoMo 2, fMo was 0.34, and it was 0.25 for CoMo C1. This shows that the fraction of Mo edge atoms is higher in CoMo 2.
3.2. Catalytic activity
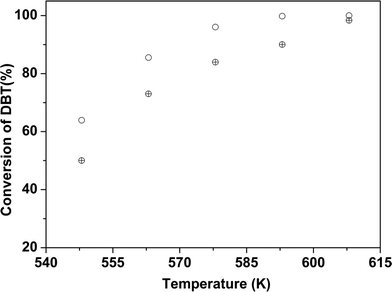
DBT was used as a model refractory sulfur compound to check the catalytic activity of the catalyst. The catalysts prepared by colloidal synthesis and by the conventional impregnation method were tested under identical conditions. The activity of the catalysts was investigated by varying the temperature, flow rate and active MoO3 amount. Preliminary experiments were conducted to determine the operating conditions so that external and internal mass transfer resistances did not affect the rate of reaction. Four different batches of the CoMo catalyst having different MoO3 contents were examined as Mo is the active metal for hydrodesulfurization. To check the effect of the Mo content on the catalytic activity, the Mo content of the synthesized catalysts was varied while maintaining the Co/(Co + Mo) atomic ratio at 0.3 ± 0.02. The effect of reaction temperature on synthesized catalyst batches was investigated in the temperature range of 548–608 K.The sulfur content of the effluent liquid obtained at reaction temperatures of 548 K and 608 K and W/FA0 of 2.38 × 10² (kg cat h per kmol DBT) is shown in Fig. 8. For CoMo 2, the sulfur content of the effluent at 608 K was 31 ppm, whereas for CoMo C1 it was higher, i.e. 65 ppm sulfur. The variation of DBT conversion with MoO3 loading at 548 K is shown in Fig. 9. Until a MoO3 loading of 13.2 wt%, the conversion of DBT increased with metal loading, but beyond this loading, the conversion decreased significantly, possibly due to loss in surface area and metal dispersion.
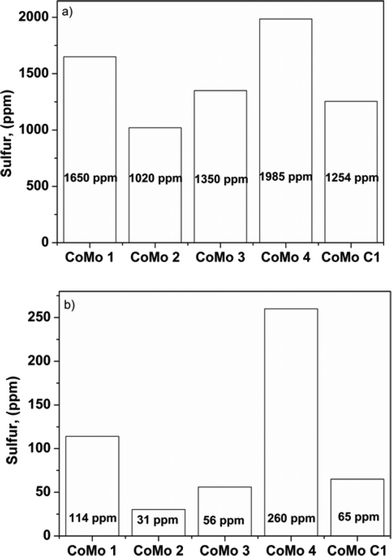 | ||
| Fig. 8 Effect of temperature on sulfur content: a) T = 548 K, b) T = 608 K (W/FA0 = 2.38 × 10² kg cat h per kmol DBT, P = 3 MPa). | ||
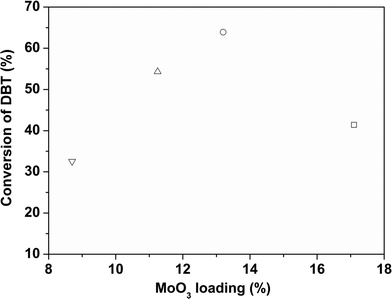 | ||
| Fig. 9 Effect of MoO3 loading on the conversion of DBT over different CoMo/γ-Al2O3 catalysts (W/FA0 = 2.38 × 10² kg cat h per kmol DBT, T = 548 K). CoMo 1 (□), CoMo 2 (○), CoMo 3 (△) and CoMo 4 (▽). | ||
Furthermore, the effect of nanocluster size on activity was confirmed by comparing the conversions obtained with 2 nm Co-promoted MoO3 nanoclusters (obtained after 10 min reaction time) and ∼10 nm particles formed after 30 minutes of reaction time as shown in Fig. 10. The metal loading for both catalysts was the same. The activity of the larger size particles was significantly lower due to the lower metal dispersion. Thus, at 548 K, with the smallest CoMo/γ-Al2O3 nanocluster (∼2 nm), the conversion was ∼40% higher in comparison to that of the CoMo/γ-Al2O3 nanocluster of 8 ± 4 nm size because of higher dispersion of the ∼2 nm particles over the Al2O3 support.
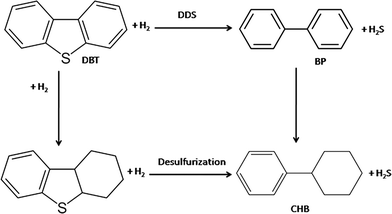
The main products obtained during HDS were biphenyl (BP) and cyclohexylbenzene (CHB). It has been proposed that hydrodesulfurization of DBT follows two pathways: (i) direct desulfurization of DBT in which the hydrogenolysis of the sulfur bond takes place leading to the formation of biphenyl (BP) and (ii) desulfurization after hydrogenation of one of the aromatic rings followed by hydrogenolysis of the sulfur bond, leading to the formation of cyclohexylbenzene (CHB);42–44 biphenyl can be further hydrogenated to CHB. The reaction pathway for HDS of DBT is shown as follows:
 | (6) |
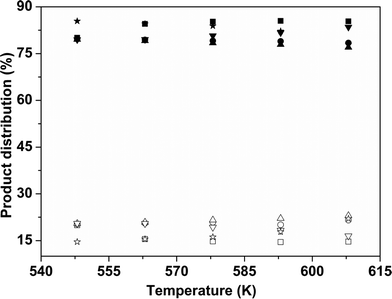
The variation of the product distribution with temperature is shown in Fig. 11. For all catalyst samples, BP was the major product.
The possible reasons for the higher activity of the CoMo 2 catalyst prepared by colloidal synthesis in comparison with that of the conventional CoMo C1 catalyst could be due a combination of the following factors: higher number of Mo edge atoms, easier reducibility and sulfidability. First, from TEM images, it is evident that edge sites present in the current catalysts is 36% higher compared to conventional impregnation catalysts which are considered to be the active sites for sulfur removal. This is in agreement with several reports.45,46 Second, TPR and XPS results clearly suggest that CoMo 2 is easily reducible and sulfidable compared to CoMo C1, which may be due to the relatively lesser metal–support interaction. It is well known that the metal–support interaction strongly influences the formation of the CoMoS active phase and affects the reducibility of the catalyst.14,15
The product distribution can be explained on the basis of the rim-edge and brim site models. In the case of supported catalysts, the rim sites in contact with the support do not participate in the HDS reaction due to the metal–support interaction; hence, most of the reaction takes place on the top layer (responsible for both direct desulfurization and hydrogenation reaction) and edge sites responsible for direct desulfurization reaction. The higher selectivity of BP is most likely due to the presence of a higher number of edge sites because of the shorter slab length in the sulfided catalysts prepared by colloidal synthesis.
 | (7) |
 vs.
vs. was linear, thus confirming that first-order kinetics could be used to represent the data.47,48
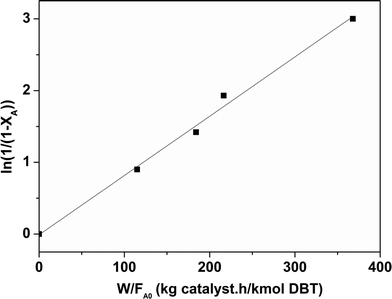 | ||
| Fig. 12 Determination of the pseudo first order rate constant for the CoMo 1 catalyst (temperature = 563 K). | ||
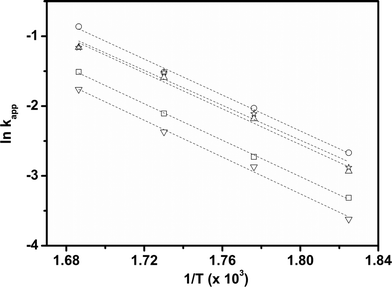
Considering that HDS follows pseudo-first order kinetics, apparent rate constants were calculated per unit mass of MoO3 present in the catalyst (Table 3) at different reaction temperatures. As anticipated, the rate constants increased with temperature. The rate constant based on MoO3 was highest for CoMo 2 at all temperatures, indicating that MoO3 is utilized more effectively in the catalyst prepared by colloidal synthesis. Under the same reaction conditions, the rate constant decreased in the order CoMo 2 > CoMo 3 > CoMo C1 > CoMo 4 > CoMo 1. The activation energies for the different catalysts were determined from an Arrhenius plot (Fig. 13) and found to be in the range of 102–113 kJ mol−1, which is in good agreement with the values of 79 kJ mol−1 to 129 kJ mol−1 reported by others for the reaction on CoMo/γ-Al2O3.49–51
| Temperature (K) | CoMo 1 kapp (m3 per (kg MoO3 h)) | CoMo 2 kapp (m3 per (kg MoO3 h)) | CoMo 3 kapp (m3 per (kg MoO3 h)) | CoMo 4 kapp (m3 per (kg MoO3 h)) | CoMo C1 kapp (m3 per (kg MoO3 h)) |
|---|---|---|---|---|---|
| 548 | 0.20 | 0.53 | 0.51 | 0.30 | 0.38 |
| 563 | 0.38 | 1.00 | 0.98 | 0.65 | 0.81 |
| 578 | 0.71 | 1.68 | 1.60 | 1.08 | 1.47 |
| 593 | 1.30 | 3.21 | 2.76 | 2.0 | 2.26 |
3.3. Spent catalyst analysis
To check the stability of the catalyst, a longer duration run was conducted using the CoMo 2 catalyst at 563 K at a W/FA0 of 2.38 × 10² (kg cat h per kmol DBT). As can be seen from Fig. S10,† there was no noticeable change in either the DBT conversion or the selectivity of products over a period of 24 h. This shows that the synthesized catalysts are stable during this period under HDS reaction conditions. The spent catalyst after 24 h of operation was analyzed using TEM and Raman spectroscopy. Fig. S11† shows the TEM image of the spent CoMo 2 catalyst, and the TEM analysis of the spent catalyst shows a slight increase in slab length (∼3.5 nm in comparison to ∼3.3 nm for the freshly sulfided catalyst), whereas there was no change in the stacking number (∼2.2). Fig. S12† shows the Raman spectra of the unsulfided and spent (CoMo 1 and CoMo C1) catalysts. Two broad peaks at 1350 and 1590 cm−1 are observed in the case of the spent catalyst compared to the unsulfided catalyst which can be attributed to the amorphous carbon.52 This amorphous carbon has no effect on either the activity or the selectivity for the test run of 24 h.4. Conclusions
Co-promoted MoO3 nanoclusters of ∼2 nm size were successfully synthesized using the colloidal synthesis method, where oleylamine and oleic acid were used as surfactants to arrest the growth of nanoclusters. CoMo/γ-Al2O3 prepared using colloidal synthesis showed higher HDS activity in comparison to the catalyst of similar composition prepared using the conventional impregnation method. The enhanced catalytic activity is attributed to an increased number of edge atoms, easier reducibility and sulfidability of colloidally synthesized nanoclusters. In addition, the CoMo/γ-Al2O3 catalyst prepared using colloidal synthesis did not show any deactivation for a run time of 24 h proving catalyst stability.Acknowledgements
The financial support provided by Chevron Corporation, USA and Hindustan Petroleum Corporation Limited, Mumbai for this study is gratefully acknowledged.References
- H. Liu, C. Liu, C. Yin, Y. Chai, Y. Li, D. Liu, B. Liu, X. Li and Y. Wang, Appl. Catal., B, 2015, 174–175, 264–276 CrossRef CAS.
- H. Shang, W. Du, Z. Liu and H. Zhang, J. Ind. Eng. Chem., 2013, 19, 1061–1068 CrossRef CAS.
- T. Fujikawa, Top. Catal., 2009, 52, 872–879 CrossRef CAS.
- V. Chandra Srivastava, RSC Adv., 2012, 2, 759–783 RSC.
- C. Kwak, J. J. Lee, J. S. Bae and S. H. Moon, Appl. Catal., B, 2001, 35, 59–68 CrossRef CAS.
- C. Tsai, K. Chan, J. K. Norskov and F. Abild-Pedersen, Catal. Sci. Technol., 2015, 5, 246–253 CAS.
- R. Kumar, B. S. Rana, R. Tiwari, D. Verma, R. Kumar, R. K. Joshi, M. O. Garg and A. K. Sinha, Green Chem., 2010, 12, 2232–2239 RSC.
- L. Nielsen, S. Christensen, H. Topsøe and B. Clausen, Catal. Lett., 2000, 67, 81–85 CrossRef CAS.
- J. K. Nørskov, B. S. Clausen and H. Topsøe, Catal. Lett., 1992, 13, 1–8 CrossRef.
- M. Ramos, G. Berhault, D. A. Ferrer, B. Torres and R. R. Chianelli, Catal. Sci. Technol., 2012, 2, 164–178 CAS.
- C. S. Hsu and P. Robinson, Practical advances in petroleum processing, Springer Science & Business Media, 2007 Search PubMed.
- M. Daage and R. Chianelli, J. Catal., 1994, 149, 414–427 CrossRef CAS.
- G. Berhault, M. Perez De la Rosa, A. Mehta, M. J. Yácaman and R. R. Chianelli, Appl. Catal., A, 2008, 345, 80–88 CrossRef CAS.
- K. Al-Dalama and A. Stanislaus, Energy Fuels, 2006, 20, 1777–1783 CrossRef CAS.
- T. Zepeda, T. Halachev, B. Pawelec, R. Nava, T. Klimova, G. Fuentes and J. Fierro, Catal. Commun., 2006, 7, 33–41 CrossRef CAS.
- A. J. Van Dillen, R. J. Terörde, D. J. Lensveld, J. W. Geus and K. P. De Jong, J. Catal., 2003, 216, 257–264 CrossRef CAS.
- A. Tuxen, J. Kibsgaard, H. Gøbel, E. Lægsgaard, H. Topsøe, J. V. Lauritsen and F. Besenbacher, ACS Nano, 2010, 4, 4677–4682 CrossRef CAS PubMed.
- A. Duan, T. Li, Z. Zhao, B. Liu, X. Zhou, G. Jiang, J. Liu, Y. Wei and H. Pan, Appl. Catal., B, 2015, 165, 763–773 CrossRef CAS.
- D. Gao, A. Duan, X. Zhang, Z. Zhao, E. Hong, J. Li and H. Wang, Appl. Catal., B, 2015, 165, 269–284 CrossRef CAS.
- N. Bejenaru, C. Lancelot, P. Blanchard, C. Lamonier, L. C. Rouleau, E. Payen, F. Dumeignil and S. Royer, Chem. Mater., 2009, 21, 522–533 CrossRef CAS.
- L. Zhang, W. Fu, M. Xiang, W. Wang, M. He and T. Tang, Ind. Eng. Chem. Res., 2015, 54, 5580–5588 CrossRef CAS.
- S. U. Son, Y. Jang, J. Park, H. B. Na, H. M. Park, H. J. Yun, J. Lee and T. Hyeon, J. Am. Chem. Soc., 2004, 126, 5026–5027 CrossRef CAS PubMed.
- C. Bock, C. Paquet, M. Couillard, G. A. Botton and B. R. MacDougall, J. Am. Chem. Soc., 2004, 126, 8028–8037 CrossRef CAS PubMed.
- Y. H. Lee, G. Lee, J. H. Shim, S. Hwang, J. Kwak, K. Lee, H. Song and J. T. Park, Chem. Mater., 2006, 18, 4209–4211 CrossRef CAS.
- J. A. Baeza, L. Calvo, J. J. Rodriguez, E. Carbó-Argibay, J. Rivas and M. A. Gilarranz, Appl. Catal., B, 2015, 168–169, 283–292 CrossRef CAS.
- X. Wang, J. Stöver, V. Zielasek, L. Altmann, K. Thiel, K. Al-Shamery, M. Bäumer, H. Borchert, J. Parisi and J. Kolny-Olesiak, Langmuir, 2011, 27, 11052–11061 CrossRef CAS PubMed.
- E. J. M. Hensen, P. J. Kooyman, Y. van der Meer, A. M. van der Kraan, V. H. J. de Beer, J. A. R. van Veen and R. A. van Santen, J. Catal., 2001, 199, 224–235 CrossRef CAS.
- Y. Li, Y. Dai and X.-K. Tian, Catal. Lett., 2015, 145, 1837–1844 CrossRef CAS.
- N. Deraz, Int. J. Electrochem. Sci., 2013, 8, 4036–4046 CAS.
- S. Ummartyotin, S. Sangngern, A. Kaewvilai, N. Koonsaeng, H. Manuspiya and A. Laobuthee, Journal of Sustainable Energy & Environment, 2010, 1, 31–37 Search PubMed.
- M. Taguchi, T. Nakane, K. Hashi, S. Ohki, T. Shimizu, Y. Sakka, A. Matsushita, H. Abe, T. Funazukuri and T. Naka, Dalton Trans., 2013, 42, 7167–7176 RSC.
- X. Wang, H. Fang, Z. Zhao, A. Duan, C. Xu, Z. Chen, M. Zhang, P. Du, S. Song and P. Zheng, RSC Adv., 2015, 5, 99706–99711 RSC.
- S. Badoga, R. V. Sharma, A. K. Dalai and J. Adjaye, Ind. Eng. Chem. Res., 2014, 53, 18729–18739 CrossRef CAS.
- P. Arnoldy, M. C. Franken, B. Scheffer and J. A. Moulijn, J. Catal., 1985, 96, 381–395 CrossRef CAS.
- J. Zhang, J. Chen, J. Ren and Y. Sun, Appl. Catal., A, 2003, 243, 121–133 CrossRef CAS.
- S. Damyanova, L. Petrov and P. Grange, Appl. Catal., A, 2003, 239, 241–252 CrossRef CAS.
- O. Klimov, K. Leonova, G. Koryakina, E. Y. Gerasimov, I. Prosvirin, S. Cherepanova, S. Budukva, V. Y. Pereyma, P. Dik and O. Parakhin, Catal. Today, 2014, 220, 66–77 CrossRef.
- A. Gandubert, E. Krebs, C. Legens, D. Costa, D. Guillaume and P. Raybaud, Catal. Today, 2008, 130, 149–159 CrossRef CAS.
- D. Laurenti, B. Phung-Ngoc, C. Roukoss, E. Devers, K. Marchand, L. Massin, L. Lemaitre, C. Legens, A.-A. Quoineaud and M. Vrinat, J. Catal., 2013, 297, 165–175 CrossRef CAS.
- F. Cui, G. Li, X. Li, M. Lu and M. Li, Catal. Sci. Technol., 2015, 5, 549–555 CAS.
- G. Berhault, M. Perez De la Rosa, A. Mehta, M. J. Yácaman and R. R. Chianelli, Appl. Catal., A, 2008, 345, 80–88 CrossRef CAS.
- E. Rodríguez-Castellón, A. Jiménez-López and D. Eliche-Quesada, Fuel, 2008, 87, 1195–1206 CrossRef.
- V. Lamure-Meille, E. Schulz, M. Lemaire and M. Vrinat, Appl. Catal., A, 1995, 131, 143–157 CrossRef CAS.
- M. Houallia, D. H. Broaderick, A. V. Sapre, N. K. Naga, V. J. H. de Beer and B. C. Gates, J. Catal., 1980, 61, 523–527 CrossRef.
- D. Ferdous, A. Dalai and J. Adjaye, Appl. Catal., A, 2004, 260, 153–162 CrossRef CAS.
- F. Cui, G. Li, X. Li, M. Lu and M. Li, Catal. Sci. Technol., 2015, 5, 549–555 CAS.
- Y. Wang, Z. Sun, A. Wang, L. Ruan, M. Lu, J. Ren, X. Li, C. Li, Y. Hu and P. Yao, Ind. Eng. Chem. Res., 2004, 43, 2324–2329 CrossRef CAS.
- X. Ma, K. Sakanishi and I. Mochida, Ind. Eng. Chem. Res., 1994, 33, 218–222 CrossRef CAS.
- L. E. Kallinikos, A. Jess and N. G. Papayannakos, J. Catal., 2010, 269, 169–178 CrossRef CAS.
- P. Steiner and E. A. Blekkan, Fuel Process. Technol., 2002, 79, 1–12 CrossRef CAS.
- T. Song, Z. Zhang, J. Chen, Z. Ring, H. Yang and Y. Zheng, Energy Fuels, 2006, 20, 2344–2349 CrossRef CAS.
- J. Schwan, S. Ulrich, V. Batori, H. Ehrhardt and S. R. P. Silva, J. Appl. Phys., 1996, 80, 440–447 CrossRef CAS.
Footnote |
| † Electronic supplementary information (ESI) available. See DOI: 10.1039/c5cy02221e |
| This journal is © The Royal Society of Chemistry 2016 |

