
 Open Access Article
 This Open Access Article is licensed under a
 Creative Commons Attribution 3.0 Unported Licence
A versatile sol–gel coating for mixed oxides on nanoporous gold and their application in the water gas shift reaction†
Junjie
Shi
ad,
Christoph
Mahr
bd,
M. Mangir
Murshed
cd,
Volkmar
Zielasek
ad,
Andreas
Rosenauer
bd,
Thorsten M.
Gesing
cd,
Marcus
Bäumer
ad and
Arne
Wittstock
*ad
aInstitute of Applied and Physical Chemistry and Center for Environmental Research and Sustainable Technology, University Bremen, Bremen, Germany. E-mail: awittstock@uni-bremen.de; Tel: +49 421 218 63400
bInstitute of Solid State Physics, University Bremen, Bremen, Germany
cSolid State Chemical Crystallography, Institute of Inorganic Chemistry and Crystallography/FB02, University Bremen, Bremen, Germany
dMAPEX Center for Materials and Processes, University Bremen, Bremen, Germany
First published on 30th March 2016
Abstract
Based on a sol–gel coating method, a series of nanoporous gold (npAu) catalysts functionalized with titania–ceria mixed oxides were prepared. Metal-oxides with different composition were formed inside the mesoporous material (ligaments and pores ∼45 nm) after thermal treatment at over 200 °C for 2 h. The water-gas shift (WGS) reaction (H2O + CO → H2 + CO2) was studied in a continuous flow reactor at ambient pressure using these Ce–TiOx/npAu catalytic materials. Formation of CO2 was observed at temperatures between 200 °C and 450 °C. The addition of CeO2 to TiO2 resulted in an strongly increased activity; the sample (with the molar ratio of Ce![[thin space (1/6-em)]](https://www.rsc.org/images/entities/char_2009.gif) :Ti = 1:2 abbreviated as Ce1Ti2Ox/npAu) shows the highest activity which was nearly twice as high as the activity of all other samples at 300 °C. The loss of activity after 2 catalytic runs was only about 10% at 450 °C for the Ce1Ti2Ox/npAu sample and no coarsening was observed. Raman spectroscopic characterization of the materials indicates a dynamic correlation between the crystallization (oxygen storage) of the metal-oxides under oxidizing and reducing conditions.
:Ti = 1:2 abbreviated as Ce1Ti2Ox/npAu) shows the highest activity which was nearly twice as high as the activity of all other samples at 300 °C. The loss of activity after 2 catalytic runs was only about 10% at 450 °C for the Ce1Ti2Ox/npAu sample and no coarsening was observed. Raman spectroscopic characterization of the materials indicates a dynamic correlation between the crystallization (oxygen storage) of the metal-oxides under oxidizing and reducing conditions.
1. Introduction
Catalysis using nanoporous gold (npAu) has spurred great interest since the first discovery of its low-temperature CO oxidation activity around 10 years ago.1 In the following years, it was shown that this unsupported skeletal gold catalyst is a very active and selective catalyst for a variety of catalytic reactions.2,3 Its high electrical and thermal conductivity, well reproducible and tunable monolithic structure, in conjunction with its high surface area render it a promising platform for a building block catalyst concept.4 By addition of a second component (another metal, oxide deposits or even organic functionalities) onto the surface of the material, the range of catalytic applications can be extended or tuned, depending on the interaction of the gold with the second component. Among the already reported additives, those involving metal oxides are of particular interest; the combination of oxides with npAu is a well-known one from the field of supported Au nanoparticles on oxides. As was demonstrated with such systems, the Au/oxide interaction can produce materials with novel structural and electronic properties leading to applications in areas such as electro-catalysis, sensors and, of course, heterogeneous catalysis.5–7 One of the promising catalytic applications for gold in combination with metal oxides is the water gas shift reaction (WGSR).Besides its industrial importance in the context of generation of synthesis gas the heterogeneously catalyzed WGSR is a key step in fuel processing for the generation and purification of H2. This reaction has become increasingly popular for eliminating residual CO (<10 ppm for PEMFCs) and concomitantly generating hydrogen in fuel cell feed gas. A number of Au catalysts dispersed on an oxide support have been reported for low-temperature WGSR.8–10 Among the various supports tested, ceria and titania have been reported to be the most active ones.8,11
Recently and in addition to real catalysts, inverse model catalysts consisting of CeOx and TiOx nanoparticles supported on Au(111) have been reported to show a high catalytic potential in the WGSR.12 Such systems (oxides on single crystalline metal surfaces) have been subject to detailed investigations in surface science for some time.13 In many cases, such inverse catalysts show higher activities as compared to classic systems, i.e. oxide supported metal particles. For example, a CeOx/Cu(111) system was reported to be more active than Cu/CeO2(111) and Cu/ZnO(0001) surfaces for the WGSR.14 This may be related to several factors. For example, catalytically important defects present in the oxide are more abundant in case of the inverse system, since they may be covered by metal particles in case of the classical systems. Most certainly, an improved sinter stability can be expected for the inverse systems, since the oxide has a lower surface energy than the metal.14 Using npAu as a high surface area metal support allows transferring this design, formerly only possible as a model system, to larger scale ambient applications such as catalytic coatings and structured catalysts in small scaled reactors (“mini-reactors”). For example, npAu supported ceria and titania show high activity for WGSR, CO oxidation and NO reduction reaction under ambient conditions.15,16
Following up on first studies using the npAu as the support for pure TiO2 and CeO2 oxide deposits,15,16 we pursued the question if mixed oxides of CeO2 and TiO2 supported on npAu could even show higher activity than the single oxides. Several studies on TiO2–CeO2 mixed oxides have shown improvements regarding redox, textural, and structural properties.17 These improvements have been attributed to the modification of the structure, to electronic factors, or improved thermal stability by doping. For example, the addition of Ti into the ceria lattice was shown to increase the fraction of partially reduced Ce3+ which is an active site for bonding and dissociation of water.18 Several recent studies indicate that the surface chemical and, thus, catalytic properties (reducibility, oxygen deficiency, acidity, oxidation activity) of the Ce1−xTixO2 mixed oxides can be tailored by controlling their composition.17 Experimental results strongly suggest that defect sites on the metal oxides plays an essential role in WGSR.19 In particular, more O vacancies were found to lead to increased oxygen storage capacity (OSC) and enhanced redox properties of the oxides.20 As an intriguing tool to characterize these defects, Raman scattering has been shown to be very sensitive to the defect formation in titania, ceria and doped ceria materials.21,22
Impregnation of a highly porous material such as npAu with defined fractions of oxides poses a considerable challenge. Different methods, including wetness impregnation, atomic layer deposition (ALD), and chemical vapor deposition (CVD) have been used to deposit pure oxides, in particular titania, inside the npAu pores.5,6,23 However, to date, the preparation of a titania and ceria mixed oxide on npAu has not been reported. One of the challenges associated with the impregnation/coating is a uniform dispersion of the oxide deposits throughout the porous host material. One way of judging the uniformity is by observing the thermal stability of the ligaments. While the pristine material starts coarsening at temperatures of 150 °C, the nanostructure of oxide-modified material is stable at 1000 °C (in case of Al2O3).24 In terms of uniformity, after impregnation of npAu with a praseodymium nitrate precursor, the ligaments at the outer surface of the material were stabilized after annealing to 500 °C, while in the deeper sections (∼100 μm from the outer surface) the size of the ligaments coarsened, indicating a lower concentration of oxide in these deeper sections.25 Another challenge in case of mixed oxides is the simultaneous deposition of the two precursors on the surface. Owing to its chemical nature, the titanium tends to form preferentially pure titania, and it is difficult to control the reaction kinetics for heterogeneous nucleation and growth of mixed oxides on the desired substrate.26
In this study, we are using procedures based on well-established sol–gel chemistry for the synthesis of titania/ceria mixed metal oxides inside the npAu pore network. Sol–gel chemistry has been widely employed for the generation of pure and mixed oxides with controlled composition.27,28 The advantage of the sol–gel process is that it is a widespread, readily available and a low-cost bench-top chemical procedure.
The present work focuses on the structural and catalytic characterization of TixCe1−xO2 mixed oxides synthesized inside the npAu network based on sol–gel chemistry. We used operando diffuse reflectance IR spectroscopy (DRIFTS) for monitoring the transformation of the precursors to the corresponding oxides. Scanning electron and transmission electron microscopy were employed for the characterization of the structure and the distribution of the oxide deposits inside the nanoporous network. The catalytic performance of the Ce1−xTixO2/npAu material for the water gas shift reaction (WGSR) was tested in a laboratory scale plug flow reactor between 200 °C and 450 °C. In order to draw conclusions about the role of the oxide for the WGS, the samples were investigated by Raman scattering. In particular, the presence of oxygen vacancies and the specific crystallinity are important parameters for understanding the differences in the catalytic activities for different ratios of ceria and titania in the mixed system.
2. Experimental
2.1. Fabrication of metal oxides functionalized npAu catalysts
:Ti could be tailored by adjusting the amount of Ce(NO3)3 precursor. The sample composition is indicated by CeaTibOx, where a/b represents the Ce to Ti molar ratios. Following the procedure detailed above, the samples were subsequently dried and calcined at 200–500 °C for 2 hours. The annealing temperature (up to 500 °C) was found to have a negligible impact on the performance of the catalyst. As reported by Li et al.26 hydrolysis and condensation speed can be controlled by the concentration of ammonia. By increasing the amount of ammonia the hydrolysis and condensation speed increased. We detect that beside the amount of ammonia, the ratio between TBOT and Ce(NO3)3 also plays an import role in controlling the sol–gel process.
2.2. Catalytic setup and experimental procedures
The steady-state catalytic measurements were carried out in a continuous flow quartz reactor (9 mm in diameter and 370 mm in length) at atmospheric pressure. The centre part of the quartz reactor contains a tapering with 3 mm in diameter and 10 mm in length, the catalyst was placed inside this hole fixed with quartz wool. This procedure guaranteed direct contact of the gas stream with the catalyst, avoiding large parts of the feed bypassing the sample. The isothermal zone of the horizontally aligned tube furnace was about 180 mm. The flow of gases and concentration of reactants were set so that a relatively low conversion (CO to CO2 below 30%) was ensured, reducing temperature gradients due to the exothermic reaction and allowing for drawing conclusions about the kinetics.All samples were used in the as-prepared form after pyrolysis (i.e., without crushing into small pieces). To guarantee a better comparison of different samples' conversion rate, the weight and size of the samples were controlled; every time around 6 ± 0.5 mg (after pyrolysis) of catalyst was used for the catalytic testing.
For the water gas shift measurements, the feed gases consisted of a mixture of CO (Linde AG, 4.7), H2O, and He (Linde AG, 5.0) as carrier gas. The amount of H2O was controlled via its vapor pressure in a saturator. First, the gas stream was saturated with H2O gas at 90 °C (vapor pressure of water 70 × 103 Pa ∼70 vol%); subsequently the amount of H2O in the gas phase was adjusted by controlling the flow rate of He through the saturator (total flow through the reactor was constant); the stream of saturated gas was introduced into the reactor through a heated pipe. The total flow was always set to 32 ml min−1 resulting in a space velocity of 320000 mL h−1 gcat−1. The feed gas consisted of a mixture of H2O 22.0 vol%, CO 5.8 vol%, He 72.2 vol%. The composition was precisely controlled via mass flow controllers (Maettig Bronkhorst, Netherlands). The gas stream at the exit of the reactor was monitored online by IR gas analyzers (URAS 3G, Hartmann und Braun) operating at a fixed wavelength (highly sensitive for CO/CO2). A trap cooled with ice was installed at the reactor exit to remove most of the water from the gas stream before entering the IR analyzers.
2.3. Characterizations
3. Results and discussion
3.1. Activation of the catalysts
After the npAu was coated with the gel, the samples were thermally annealed under helium atmosphere in order to obtain the metal oxides and to catalytically activate the material (see Scheme 1 for a summary of the hydrolysis and condensation as well as the pyrolysis process). The evolution of the IR spectra as a function of the temperature and treatment time was studied by in situ DRIFTS.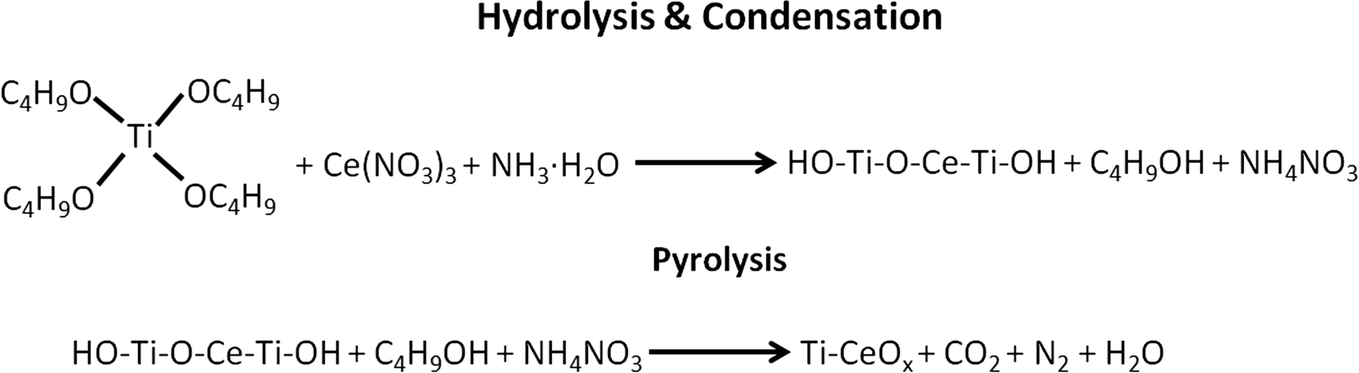 | ||
| Scheme 1 Illustration of the hydrolysis & condensation, pyrolysis processes of the gel and residuals on npAu. | ||
Fig. 1 shows DRIFT spectra recorded while heating the as-prepared Ce1Ti2Ox/npAu sample in helium to different temperatures. At 30 °C a band at 1496 cm−1 is found which can be attributed to N![[double bond, length as m-dash]](https://www.rsc.org/images/entities/char_e001.gif) O stretching mode, i.e. the NO3 group. Moreover, two sharp peaks appear at 1041 cm−1 and 1311 cm−1, which can be related to the C–O stretching vibration from the tetrabutyl group. Another vibrational band appears at 1631 cm−1 which can be ascribed to the N–H bending mode from ammonia or NH4+. These bands are caused by residues of the precursor solution that weakly bind to the surface and are not removed by simple drying in air.
O stretching mode, i.e. the NO3 group. Moreover, two sharp peaks appear at 1041 cm−1 and 1311 cm−1, which can be related to the C–O stretching vibration from the tetrabutyl group. Another vibrational band appears at 1631 cm−1 which can be ascribed to the N–H bending mode from ammonia or NH4+. These bands are caused by residues of the precursor solution that weakly bind to the surface and are not removed by simple drying in air.
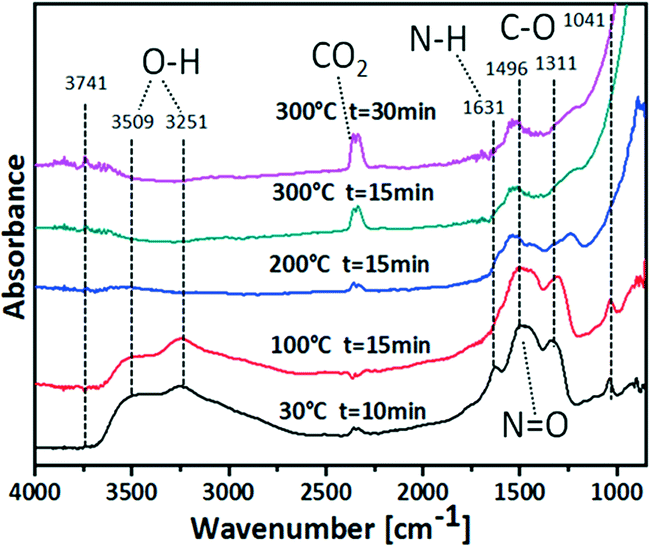 | ||
| Fig. 1 DRIFT spectra of npAu disk containing Ce–Ti precursor (Ce1Ti2Ox/npAu) in He atmosphere. | ||
As shown in Fig. 1, by rising the temperature to 100 °C for 15 min, the N–H bend vibration at 1631 cm−1 disappears indicating removal and evaporation, respectively, of ammonia or decomposition of NH4+. After further raising the temperature to 200 °C for 15 min the peaks at 1496 cm−1, 1311 cm−1, 1041 cm−1 also gradually disappeared. These changes indicate the successful removal of the –NO3 and –OC4H9 groups. At the same time, the intensity of the two broad O–H stretching vibrations at around 3509 cm−1 and 3251 cm−1 are greatly decreased, implying the removal of adsorbed H2O. From 200 °C to 300 °C a continuing increase of the CO2 band (2345 cm−1) intensities and, concomitantly, a slight decrease of the bicarbonate band (1538 cm−1) intensities can be observed. This indicates the decomposition of the C4H9OH into CO2 in the pyrolysis process as illustrated in Scheme 1.
Since for the sol–gel coating process organic or inorganic precursors are used, the residual groups during heat treatment may act as a catalyst poison. The pyrolysis of the sample at elevated temperature is a necessary step for the removal of the residual groups and cleaning the catalytic surface. The in situ DRIFTS study on the Ti–CeOx/npAu shows that, by raising the calcination temperature to 200 °C for over 1 h, however, most of these residues can be successfully removed.
3.2. Structural characterization
The effect of post deposition annealing on the morphology of the hybrid material is studied by scanning electron microscopy. Regardless of the titania–ceria ratio all samples show similar structures after annealing in helium at 500 °C for 2 h. Representative cross-sectional scanning electron micrographs of Ce1Ti2Ox/npAu were chosen to document the morphology of the material. As shown in Fig. 2a, the ligaments and nano-pore channels are homogenously arranged in the bi-continuous 3D network after the annealing treatment. To be noted here, before the heat treatment parts of the nano-pores were covered by some big agglomerates (Fig. S1†), the annealing process seems to increase the dispersion of the agglomerates. The higher magnification images from the top and middle part of the sample show no aggregates inside the pores after annealing. The average ligaments size is around 45 ± 2 nm. The quantitative detection of oxides inside the npAu by EDX spectroscopy in different depths along the cross section reveals the content of Ce is around 2 ± 0.5 atom% and Ti is around 4 ± 0.5 atom%, in agreement with the nominal ratio of the sample Ce1Ti2Ox. The EDX element mapping (Fig. S2†) confirms that both Ti and Ce are homogeneously distributed inside the nano-pores. These results demonstrate that the sol–gel based procedure provides a very good means to homogeneously grow metal oxide deposits inside the npAu with good control over composition. Concomitantly, the tiania–ceria oxides can effectively stabilize the nano-pores structure up to 500 °C.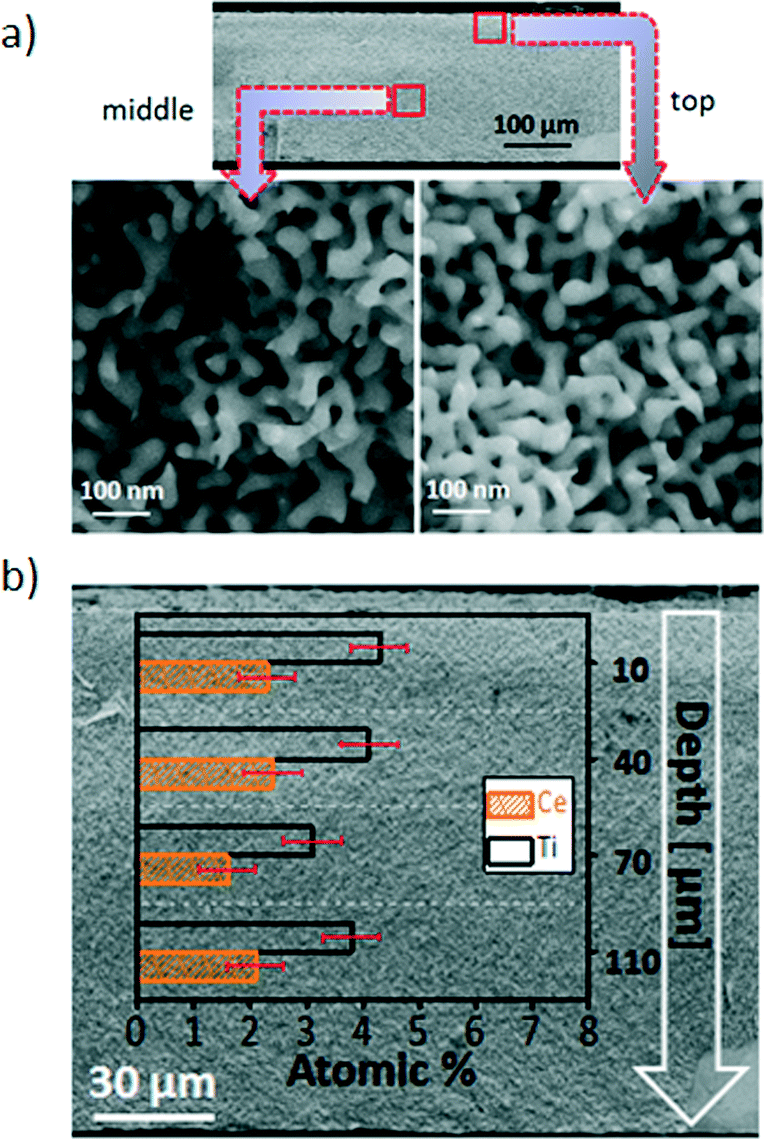 | ||
| Fig. 2 Characterization of titania–ceria modified nanoporous gold. a/b) SEM of a freshly broken cross-section of a Ce1Ti2Ox/npAu disk (∼150 μm thick) sample. The sample was heated to 500 °C prior to characterization to demonstrate the structural stability of the material upon heating. a) On the left, a section of the material in the inner part of the material (∼75 μm from surface); on the right, a corresponding section close to the outer surface. b) EDX measurement from different depths in the cross sections. | ||
For further structural characterization transmission electron microscopy (TEM) of npAu-oxide catalysts was performed. Thin, electron transparent slices from disk material was prepared by FIB. Fig. 3 shows representative TEM images of an according lamella revealing the convex and concave columnar curvatures of the gold skeleton. The gold ligament size is determined to be about 40 to 50 nm as already inferred from the SEM images. Moreover, the TEM images reveal that the gold ligaments are abundantly covered by small agglomerates (oxide nanoparticles) about 1–2 nm in size (cf. also Fig. S3†).
 | ||
| Fig. 3 a/b) Transmission electron microscopic (TEM) images of nanoporous gold modified by titania–ceria mixed oxides (Ce1Ti2Ox/npAu) after calcination at 450 °C in helium for 2 h. Thin slices from a ∼150 μm thick disk were prepared by FIB. A higher magnification image in section b reveals small aggregates (oxide particles, arrow) only 1–2 nm in size abundantly covering the surface of the npAu ligaments. | ||
3.3. Catalytic performance: steady state catalytic activity testing
The catalytic performance of Ce–TiOx/npAu and TiO2 and CeO2 single oxide functionalized npAu was investigated in a catalytic flow reactor (each data point was taken after 40 minutes of conversion at the particular temperature). As inferred from Fig. 4a, already at a temperature of 200 °C first catalytic conversion of water and CO was observed for all catalysts. Also, for all types of catalyst the catalytic activity increases in an exponential fashion with temperature as expected for a kinetically controlled reaction. A double logarithmic plot of the data (ESI†) reveals activation barriers between 10 ± 0.9 kJ mol−1 and 18 ± 2.2 kJ mol−1, which is in line with studies from Wen et al. of WGSR rates on mesoporous CeO2 supported Au nanoclusters (11 kJ mol−1).30 Among these catalysts, the TiOx/npAu exhibits the lowest activity in the whole temperature range as was anticipated from previous studies.31 The bar plot from Fig. 4b directly compares the catalytic activity of all samples at 300 °C. Interestingly, the addition of even small amounts of Ce to TiO2 already results in an increased activity by ∼30%. One sample, the Ce1Ti2Ox/npAu shows the highest activity which is nearly twice as high as for all other samples.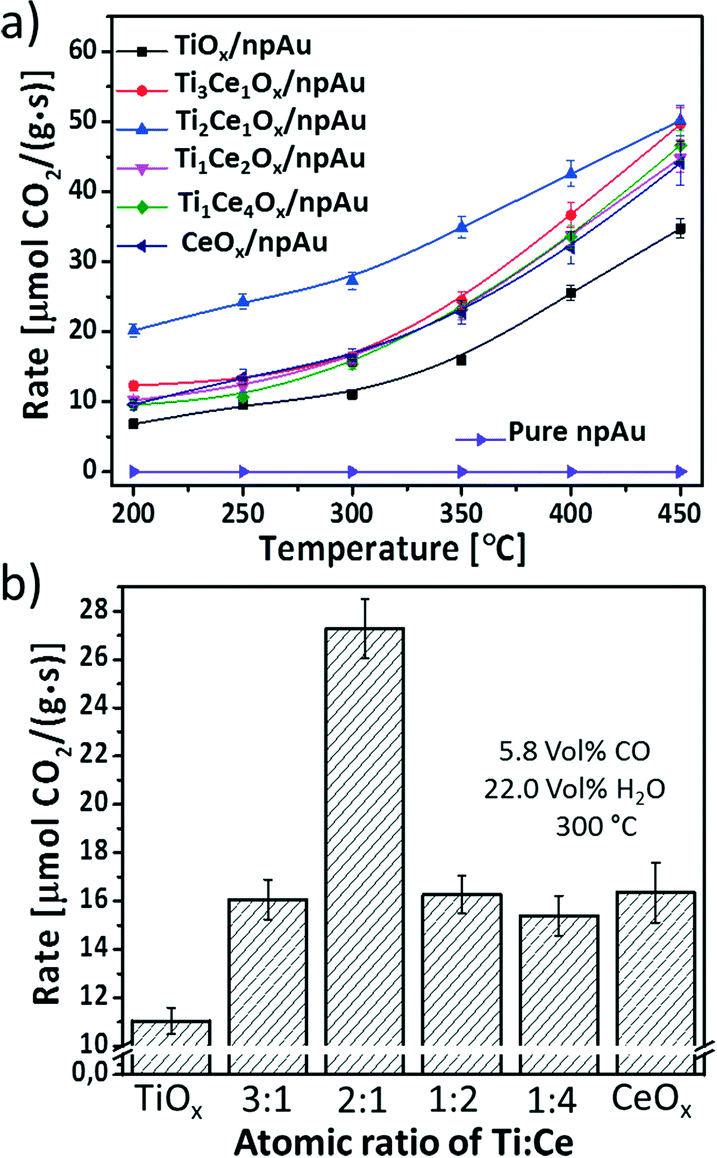 | ||
| Fig. 4 WGS activity (CO + H2O → CO2 + H2): a) comparison of the reaction rate of different binary Ti–CeOx and TiO2 and CeO2 single oxide functionalized npAu samples (5.8 vol% CO, 22.0 vol% H2O in He, total gas flow 32 mL min−1, Mcatal = 6.0 ± 0.2 mg, space velocity 320000 mL h−1 gcat−1). b) The bar plot for the catalysts is based on the reaction rates measured at 300 °C (each measurement was repeated at least 4 times with different catalysts). | ||
Several recent reports indicate that the surface oxygen deficiency and H2 reducibility were enhanced by mixing TiO2 and CeO2, but the surface cation oxidation state, reduction temperature and level were strongly dependent on the composition of Ce–TiO2.17,32 Shingo and coworkers17 carried out a H2-TPR study on the different Ti and Ce mixed oxides and found that the reduction peak of the Ce1Ti2.3O2 mixture was the least intense, indicating the highest ratios' of oxygen deficiency in this binary oxide. This may explain why the Ce1Ti2Ox/npAu sample shows the highest reaction rate among all the inverse catalysts investigated in this study.
The obtained reaction rate at 300 °C for Ce1Ti2Ox/npAu (27 μmol CO2 g−1 s−1) is around 3 times of the values reported by Si et al.31 (9.3 μmol CO2 g−1 s−1 at 300 °C) for the Au–Ti–CeO2 powder catalysts prepared by a deposition–precipitation method. For the sake of comparison, a turn-over frequency (TOF) can be calculated, this is the formation rate of product molecules per number of active sites of the catalyst. Since, this latter number is often experimentally not accessible the total number of surface atoms, e.g., the number of Au surface atoms might be used.2,31 Assuming a specific surface area of 4 m2 g−1 of the npAu catalyst the TOF at 300 °C of the catalyst is ∼0.3 s−1. TOFs determined in model experiments by Rodriguez et al. on single crystal surfaces31,32 indicate that the maximal potential of this inverse npAu catalyst is not yet achieved (TOF at 300 °C for a Au/CeOx/TiO2 system ∼4.75 s−1).31,33 An optimization of mass transport of reactants as well as the dispersion of oxide particles might further increase the observable activity.
3.4. Stability test
In applications the lifetime of the catalysts is a crucial factor, especially for the heterogeneous catalysts. The gold based catalysts have been reported to be prone to deactivation during WGSR.34 Although the deactivation mechanisms are still under debate and comparisons are difficult because of different reaction temperatures and atmospheres, the high-temperature and catalysis induced sintering of the Au nanoparticles have been commonly assumed to be involved.35To get some indication regarding the stability of the mixed oxides functionalized npAu during the WGS reaction two cycles' of a heating and cooling test were recorded. Fig. 5 shows the results for the Ce1Ti2Ox/npAu sample. Each heating or cooling test lasted over 5 h. After each test-cycle the sample was left in the tube reactor overnight with a He gas flow and cooled down to room-temperature. After the second heating/cooling cycle, the sample showed only minor signs of deactivation with a drop of ∼10% in the conversion at 450 °C after 20 h under reaction conditions. This is quite in contrast to severe deactivation of the nano-particulate Au/ceria (over 60% in two shut-down/restart operation at 300 °C).36 Scanning electron microscopic (SEM) images of the particular sample given in Fig. 5 also shows no coarsening in the nanoporous structure.
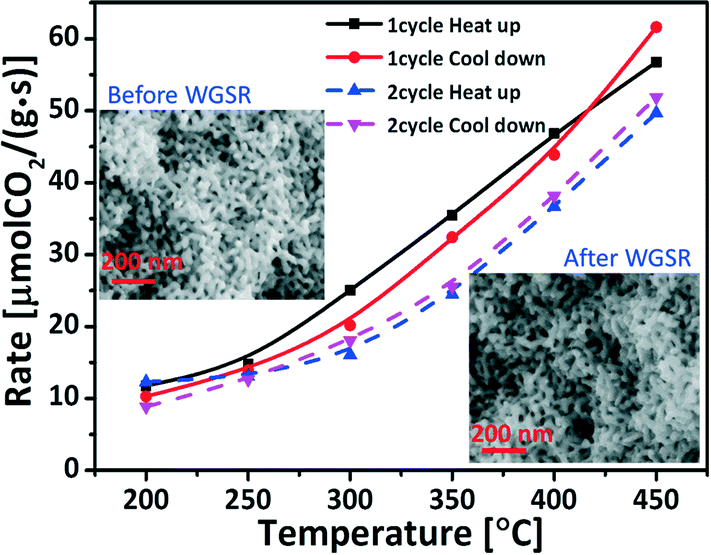 | ||
| Fig. 5 Stability test: using a 150 μm thick free-standing disc of Ce1Ti2Ox/npAu for 2 cycles of heating up and cooling down catalysis test (5.8 vol% CO, 22.0 vol% H2O in helium, total gas flow 32 mL min−1, Mcatal = 6.0 ± 0.2 mg, space velocity 320000 mL h−1 gcat−1). | ||
The salient stability achieved on the Ce–TiOx/npAu catalyst indicates that the inverse catalysts were more resistant toward deactivation under the WGS reaction conditions. This can be attributed to the benefit of the reverse catalyst design. Compared to Au nanoparticles, oxide deposits on a metal support have a much higher melting point (CeO2: 2400 °C, Au: 1064 °C), i.e., show a smaller tendency to sinter (cf. Tamman and Hüttig temperatures37). These oxide nanoparticles are not only more resistant to sintering but also stabilize the gold support by inhibiting surface diffusion of Au atoms.24 Even though, catalyst stability on an industrial scale comprises testing of activity for weeks and month, the first few hours are indicative for the most significant structural changes and concomitant loss of activity.38,39 Our stability test for the inverse catalyst shows high resistance to both coarsening and the possible pollution of the carbonates or formats during the shut-down/restart operations at least for the first 20 h. Therefore, the inverse design provides a promising approach for improving the lifetime of the catalyst.
3.5. Raman spectroscopic characterization
The Raman scattering has been used to study crystallinity and the behavior of oxygen vacancies on the npAu supported metal oxides under different reaction conditions.15,16,40 In this study disks of npAu containing pure TiOx and mixed oxides were first activated at 450 °C in helium for 2 h and then broken into 4 pieces (guaranteeing exact same starting/preparation conditions) followed by heating to 400 °C under different gas atmospheres for 2 h. Fig. 6a depicts the according Raman spectra of the TiOx/npAu material. A broad band at 695 ± 3 cm−1 corresponds to amorphous titania,41 the other three modes (B1g, A1g, Eg) are the typical active modes of crystalline anatase TiO2.40 Quite apparently, the treatment under different gas atmospheres has an impact on the formation of the crystalline phase. When the sample was exposed to an oxidizing atmosphere of O2 the crystalline peaks intensity increased and the broad peak at 695 ± 3 cm−1 (amorphous) disappeared. This indicates crystallization of the titania by introducing oxygen into the defects in the initially amorphous titania.20,42,43 However, the treatment of the sample in the H2O atmosphere has an almost negligible influence on the intensity of both the 695 ± 3 cm−1 peak and the anatase peaks. This implies that H2O is more difficult to be dissociated into atomic oxygen than O2 on the TiOx/npAu surface. Remarkably, upon treatment with reducing CO almost all titania is transformed into an amorphous state, indicating introduction of defects by reaction of CO with lattice oxygen.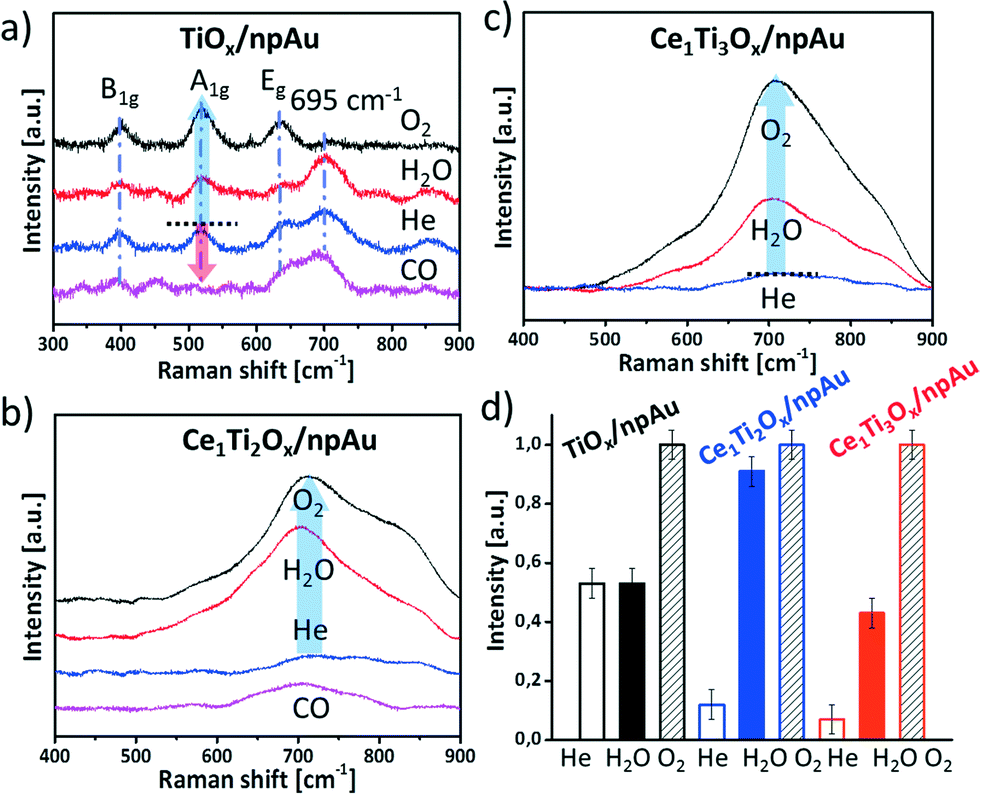 | ||
| Fig. 6 Raman spectra of (a) TiOx/npAu and (b) Ce1Ti2Ox/npAu (c) Ce1Ti3Ox/npAu. The samples were first thermal treated at 450 °C in He for 2 h, which were then broken into several pieces and heated under different gas atmospheres (CO, H2O, and O2 with 13, 30, and 13 vol%, respectively, in He as carrier at 400 °C for 2 h). d) Evolution of the intensity of the A1g (TiOx/npAu) and the Raman band at ∼710 cm−1 (Ce–TiOx/npAu) after heating in He, H2O and O2 containing atmosphere. | ||
Fig. 6b and c shows the Raman spectra of Ce1Ti2Ox/npAu and Ce1Ti3Ox/npAu individually. Most obviously, the typical Raman modes of anatase TiO2 as well as the mode for cubic CeO2 (∼460 cm−1)16 are not detected, suggesting a low content of crystalline phases of either TiO2 and CeO2. Upon oxidation of samples using either O2 or H2O, however, a very broad signal centered at around 710 cm−1 becomes noticeable (Fig. 6b and c). This Raman band is indicative for titanates and cerium titanates, respectively.44–46 Cerium titanates are mixed oxides of Ce and Ti with varying crystal structures, composition and, in particular, oxidation state of the Ce, such as Ce(IV)TiO4 or Ce2(III)TiO5. Most cerium titanates form a perovskite-like layered structure where TiO6 octaeders form an anatase like structure while the Ce cations occupy interstitial sites in the interlayer (see Fig. S6† for an example). The gradual oxidation or reduction of titanates was described as an intercalation process of oxygen atoms between these layers.47 Cerium titanates were shown to have distinctively different electronic and chemical properties than their TiO2–CeO2 mixed oxide counterparts.46,47
In our case we observed the formation of cerium titanates when heating the catalysts in water or oxygen atmosphere, no changes, though, when heating in inert gas atmosphere (Fig. 6b and c). This strongly suggests that water and oxygen is dissociated on the surface of the catalyst and oxygen atoms are incorporated into the crystal lattice. On the other hand, when treating an oxidized sample in a CO containing atmosphere the titanate-peak intensity was again reduced (Fig. S5†), indicating that the oxygen is dynamically stored.
To semi-quantitatively asses the changes from the amorphous state to the more crystalline states, the peak intensities were compared after heating in different gas atmospheres (A1g for the pure TiO2/npAu samples as well as the band at ∼710 cm−1 for the Ce–TiOx/npAu samples). Most significant differences between the samples are noticeable in case of heating in H2O containing atmosphere. While the crystallization in all samples increased upon heating in O2 atmosphere, only in case of the Ce–TiOx/npAu changes were observed when heating in a H2O containing atmosphere. Here, the samples with the composition of Ce1Ti2Ox/npAu showed the most prominent changes, more than twice as much as for all other samples. This demonstrates that the Ce1Ti2Ox/npAu sample shows the highest activity for dissociation of H2O among the three catalysts, which is also in line with the catalytic activity tests, where this sample composition shows the highest activity.
4. Conclusion
We have developed a simple and versatile sol–gel coating method to homogenously deposit TiOx and mixed Ce–TiOx into npAu with controlled composition. The resulting catalytic material is highly active for the water-gas-shift reaction, the calculated turn-over frequencies (TOFs) are in the range of 0.3 s−1 (calculation is based on the gold surface area). Model experiments from Rodriguez et al.31 indicate that even higher TOFs are achievable with this inverse catalyst design, rendering a further optimization of the system in terms of mass transport of reactants and dispersion of the oxide deposits promising. The composition of the oxide played the decisive role, resulting in an increase in activity by over 100% for the sample with the Ti:Ce ratio of 2:1. The Raman analysis of phonon softening provides further insight into the crystallinity of the oxides as a function of treatment in reducing and oxidizing gas atmospheres. For the mixed oxides samples neither crystalline titania nor ceria was detected, regardless of the treatment, but the formation of titatanes, i.e., mixed oxides of Ce and Ti when heating under oxidizing conditions (either O2 or H2O). Most prominent differences for the various samples were observed when heating in H2O atmosphere, implying, that the dissociation ability for water is greatly dependent on the composition of the oxide. The sample (Ce1Ti2Ox/npAu) which showed the most prominent changes in this experiment was also the most active catalyst for the WGSR, demonstrating that the dissociation of H2O is the rate limiting step. The control over the composition of the oxide, hence, provides an ideal tool for tuning the activity of the catalyst in terms of water dissociation.
Acknowledgements
Junjie Shi gratefully acknowledges financial support of the China Scholarship Council (CSC). We gratefully acknowledge the experimental support (SEM) of Petra Witte (Prof. Willems, Historical Geology-Palaeontology, Geology Department of the University Bremen). We gratefully acknowledge experimental support (TEM) by Dr. Karsten Thiel (Fraunhofer Institute for Applied Manufacturing Technology and Advanced Materials (IFAM), Bremen, Germany). T. M. Gesing gratefully acknowledges the Deutsche Forschungsgemeinschaft (DFG) for the financial support in the Heisenberg program (GE1981/3-1 and GE1981/3-2). C. Mahr and A. Rosenauer thank the DFG for support under contract RO 2057/12-1.References
- V. Zielasek, B. Jurgens, C. Schulz, J. Biener, M. M. Biener, A. V. Hamza and M. Baumer, Angew. Chem., Int. Ed., 2006, 45, 8241–8244 CrossRef CAS PubMed.
- A. Wittstock, V. Zielasek, J. Biener, C. M. Friend and M. Bäumer, Science, 2010, 327, 319–322 CrossRef CAS PubMed.
- A. Wittstock and M. Baumer, Acc. Chem. Res., 2014, 47, 731–739 CrossRef CAS PubMed.
- A. Wittstock, A. Wichmann and M. Bäumer, ACS Catal., 2012, 2, 2199–2215 CrossRef CAS.
- X. Y. Lang, H. Y. Fu, C. Hou, G. F. Han, P. Yang, Y. B. Liu and Q. Jiang, Nat. Commun., 2013, 4, 2169 Search PubMed.
- M. M. Biener, J. Biener, A. Wichmann, A. Wittstock, T. F. Baumann, M. Baumer and A. V. Hamza, Nano Lett., 2011, 11, 3085–3090 CrossRef CAS PubMed.
- X. Ge, L. Chen, L. Zhang, Y. Wen, A. Hirata and M. Chen, Adv. Mater., 2014, 26, 3100–3104 CrossRef CAS PubMed.
- M. Yang, L. F. Allard and M. Flytzani-Stephanopoulos, J. Am. Chem. Soc., 2013, 135, 3768–3771 CrossRef CAS PubMed.
- J. D. Lessard, I. Valsamakis and M. Flytzani-Stephanopoulos, Chem. Commun., 2012, 48, 4857–4859 RSC.
- Y. Zhang, Y. Zhan, Y. Cao, C. Chen, X. Lin and Q. Zheng, Chin. J. Catal., 2012, 33, 230–236 CrossRef.
- Q. Fu, H. Saltsburg and M. Flytzani-Stephanopoulos, Science, 2003, 301, 935–938 CrossRef CAS PubMed.
- S. M. J. A. Rodriguez, P. Liu, J. Hrbek, J. Evans and M. Pérez, Science, 2007, 318, 1757–1760 CrossRef PubMed.
- J. Schoiswohl, S. Surnev and F. P. Netzer, Top. Catal., 2005, 36, 91–105 CrossRef CAS.
- J. A. Rodríguez and J. Hrbek, Surf. Sci., 2010, 604, 241–244 CrossRef.
- A. Wichmann, A. Wittstock, K. Frank, M. M. Biener, B. Neumann, L. Mädler, J. Biener, A. Rosenauer and M. Bäumer, ChemCatChem, 2013, 5, 2037–2043 CrossRef CAS.
- J. Shi, A. Schaefer, A. Wichmann, M. M. Murshed, T. M. Gesing, A. Wittstock and M. Bäumer, J. Phys. Chem. C, 2014, 118, 29270–29277 CAS.
- X. M. Shingo Watanabe and C. Song, J. Phys. Chem. C, 2009, 113, 14249–14257 Search PubMed.
- J. Graciani and J. F. Sanz, Catal. Today, 2015, 240, Part B, 214–219 CrossRef.
- J. A. Rodriguez, Catal. Today, 2011, 160, 3–10 CrossRef CAS.
- Z. Wu, M. Li, J. Howe, H. M. Meyer 3rd and S. H. Overbury, Langmuir, 2010, 26, 16595–16606 CrossRef CAS PubMed.
- X. Pan, M. Q. Yang, X. Fu, N. Zhang and Y. J. Xu, Nanoscale, 2013, 5, 3601–3614 RSC.
- Y. Lee, G. He, A. J. Akey, R. Si, M. Flytzani-Stephanopoulos and I. P. Herman, J. Am. Chem. Soc., 2011, 133, 12952–12955 CrossRef CAS PubMed.
- A. Schaefer, D. Ragazzon, A. Wittstock, L. E. Walle, A. Borg, M. Bäumer and A. Sandell, J. Phys. Chem. C, 2012, 116, 4564–4571 CAS.
- M. M. Biener, J. Biener, A. Wichmann, A. Wittstock, T. F. Baumann, M. Baumer and A. V. Hamza, Nano Lett., 2011, 11, 3085–3090 CrossRef CAS PubMed.
- A. Wittstock, A. Wichmann, J. Biener and M. Bäumer, Faraday Discuss., 2011, 152, 87 RSC.
- W. Li, J. Yang, Z. Wu, J. Wang, B. Li, S. Feng, Y. Deng, F. Zhang and D. Zhao, J. Am. Chem. Soc., 2012, 134, 11864–11867 CrossRef CAS PubMed.
- S. Li, H. Zhu, Z. Qin, G. Wang, Y. Zhang, Z. Wu, Z. Li, G. Chen, W. Dong, Z. Wu, L. Zheng, J. Zhang, T. Hu and J. Wang, Appl. Catal., B, 2014, 144, 498–506 CrossRef CAS.
- B. J. Clapsaddle, B. Neumann, A. Wittstock, D. W. Sprehn, A. E. Gash, J. H. Satcher, R. L. Simpson and M. Baumer, J. Sol-Gel Sci. Technol., 2012, 64, 381–389 CrossRef CAS.
- W. Li, F. Wang, S. Feng, J. Wang, Z. Sun, B. Li, Y. Li, J. Yang, A. A. Elzatahry, Y. Xia and D. Zhao, J. Am. Chem. Soc., 2013, 135, 18300–18303 CrossRef CAS PubMed.
- Y. Z. C. Wen, Y. Ye, S. Zhang, F. Cheng, Y. Liu, P. Wang and F. (Feng) Tao, ACS Nano, 2012, 6, 9305–9313 CrossRef PubMed.
- R. Si, J. Tao, J. Evans, J. B. Park, L. Barrio, J. C. Hanson, Y. Zhu, J. Hrbek and J. A. Rodriguez, J. Phys. Chem. C, 2012, 116, 23547–23555 CAS.
- T. Tong, J. Zhang, B. Tian, F. Chen, D. He and M. Anpo, J. Colloid Interface Sci., 2007, 315, 382–388 CrossRef CAS PubMed.
- J. A. Rodriguez, J. Graciani, J. Evans, J. B. Park, F. Yang, D. Stacchiola, S. D. Senanayake, S. G. Ma, M. Perez, P. Liu, J. F. Sanz and J. Hrbek, Angew. Chem., Int. Ed., 2009, 48, 8047–8050 CrossRef CAS PubMed.
- N. Ta, J. J. Liu, S. Chenna, P. A. Crozier, Y. Li, A. Chen and W. Shen, J. Am. Chem. Soc., 2012, 134, 20585–20588 CrossRef CAS PubMed.
- T. Fujita, T. Tokunaga, L. Zhang, D. Li, L. Chen, S. Arai, Y. Yamamoto, A. Hirata, N. Tanaka, Y. Ding and M. Chen, Nano Lett., 2014, 14, 1172–1177 CrossRef CAS PubMed.
- Q. Fu, W. Deng, H. Saltsburg and M. Flytzani-Stephanopoulos, Appl. Catal., B, 2005, 56, 57–68 CrossRef CAS.
- G. Tammann, Z. Anorg. Allg. Chem., 1919, 107, 1–239 CrossRef CAS.
- W. Deng and M. Flytzani-Stephanopoulos, Angew. Chem., Int. Ed., 2006, 45, 2285–2289 CrossRef CAS PubMed.
- C. Kim and L. Thompson, J. Catal., 2005, 230, 66–74 CrossRef CAS.
- M. Bagge-Hansen, A. Wichmann, A. Wittstock, J. R. I. Lee, J. C. Ye, T. M. Willey, J. D. Kuntz, T. van Buuren, J. Biener, M. Baumer and M. M. Biener, J. Phys. Chem. C, 2014, 118, 4078–4084 CAS.
- F. D. Hardcastle, H. Ishihara, R. Sharma and A. S. Biris, J. Mater. Chem., 2011, 21, 6337 RSC.
- T. Nakajima, T. Nakamura, K. Shinoda and T. Tsuchiya, J. Mater. Chem. A, 2014, 2, 6762 CAS.
- C. S. Gang Liu, L. Cheng, Y. Jin, H. Lu, L. Wang, S. C. Smith, G. Q. Lu and H.-M. Cheng, J. Phys. Chem. C, 2009, 113, 12317–12324 Search PubMed.
- M. Martos, B. Julián-López, J. V. Folgado, E. Cordoncillo and P. Escribano, Eur. J. Inorg. Chem., 2008, 2008, 3163–3171 CrossRef.
- S.-J. Kim, Y.-U. Yun, H.-J. Oh, S. H. Hong, C. A. Roberts, K. Routray and I. E. Wachs, J. Phys. Chem. Lett., 2010, 1, 130–135 CrossRef CAS.
- S. Otsuka-Yao-Matsuo, T. Omata and M. Yoshimura, J. Alloys Compd., 2004, 376, 262–267 CrossRef CAS.
- T. Kidchob, L. Malfatti, D. Marongiu, S. Enzo and P. Innocenzi, J. Sol-Gel Sci. Technol., 2009, 52, 356–361 CrossRef CAS.
Footnote |
| † Electronic supplementary information (ESI) available. See DOI: 10.1039/c5cy02205c |
| This journal is © The Royal Society of Chemistry 2016 |