 Open Access Article
Synthesis and evaluation of highly dispersed SBA-15 supported Ni–Fe bimetallic catalysts for steam reforming of biomass derived tar reaction†
Y.
Kathiraser
,
J.
Ashok
and
S.
Kawi
*
Department of Chemical and Biomolecular Engineering, National University of Singapore, Singapore 119260, Republic of Singapore. E-mail: chekawis@nus.edu.sg; Fax: +65 6779 1936; Tel: +65 6516 6312
First published on 27th January 2016
Abstract
Highly dispersed Ni–Fe bimetallic catalysts supported on mesoporous SBA-15 were synthesized via an incipient wetness impregnation method by impregnation of a small amount of oleic acid mixed with a metal precursor on the SBA-15 support. This catalyst system was then tested for the steam reforming of biomass tar. Cellulose was used as a biomass model compound for this reaction. Among the various compositions tested, an optimum catalyst composition of 6Ni–1Fe/SBA-15 gave superior catalytic performance in terms of stability and activity. At 600 °C, about 90% of biomass was converted to gaseous products over the 6Ni–1Fe/SBA-15 catalyst, which was the highest among all the catalysts tested. From X-ray diffraction analysis, the Ni metal and Ni–Fe alloy crystallite sizes were barely distinguishable due to the formation of nano-catalysts less than 3 nm in size. Metal particles of less than 3 nm in size were further confirmed through TEM analysis. Moreover, temperature programmed reduction studies indicate a uniform distribution of bi-metallic Ni–Fe species which possess strong metal–support interactions with the mesoporous SBA-15 support. This was also indicated via X-ray photoelectron spectroscopy results. TGA studies over the spent catalysts showed that all Fe containing catalysts generally had lower carbon deposition rates compared to those over the 7Ni/SBA-15 catalyst.
Introduction
The global demand of energy, the finite source of fossil fuels, as well as escalating oil prices have further widened research on renewable resources as sources of fuel.1 In recent years, research on renewable sources such as biomass (obtained from various abundant sources such as agricultural, forest and municipal solid waste materials) and biomass derived liquid fuels is rapidly growing in importance.2,3 The conversion of biomass to synthesis gas and hydrogen leads to a decrease in CO2 emissions which is significant for environmental fortification.4 Synthesis gas (syngas) is an important feedstock in the chemical industry, consisting of hydrogen and carbon monoxide in varying compositions. It has a broad spectrum of uses as chemicals or as fuels, such as in methanol production and ammonia production, or as a source of pure hydrogen for hydrotreating in refineries.5Biomass is a renewable energy resource derived from biological sources such as agricultural residues and municipal wastes. It is recognized to be one of the promising solutions for current energy and environmental problems.6 More importantly, biomass is one of the few renewable energy sources that can be converted into liquid fuels as well as feedstocks for chemical industries.7 Similar to methane reforming, longer hydrocarbons contained within biomass can be reformed using steam or carbon dioxide when passed through a catalyst.
The specific chemistry of biomass gasification is complex and yet to be fully understood by scientists as it involves a complex network of various reactions.6 In a gasifier, the vaporized biomass molecules break down into condensable tars, nitrogen products and solid char products at high temperatures.7–10 The major reactions occurring during gasification include pyrolysis, oxidation, partial oxidation, reduction, steam reforming and water-gas shift reactions for the further production of gases such as H2, CH4, CO, CO2, H2O and other light hydrocarbons. Unlike the reforming of simple hydrocarbons such as methane, the biomass gasification process usually leads to significant tar formation due to its long carbon chains, which is the major obstacle towards its commercialization.6,9,11,12 Tars are usually made up of heavy aromatic hydrocarbons that have a high energy content. This not only reduces the energy content of the product gases, but causes operational problems such as plugging when cooled and condensed. Therefore, tar formation is generally found to be among the most critical issues regarding the utilization of biomass via a gasification process, and its conversion to valuable products is a key research area. By employing a suitable catalyst downstream of the gasification, the tars can be removed and the product gas can be adjusted to give higher proportions of H2 and CO.12
Transition metals such as Ni and Co are generally favoured over noble metal catalysts for the steam reforming of biomass tar due to their low cost, convenient accessibility and high catalytic activity.8,13–17 Among these transition metals, Ni is found to possess the most potential, especially for hydrocarbon cracking. Nevertheless, several disadvantages associated with Ni-based catalysts include carbon deposition on the catalyst surface and sintering of the metal Ni0 species which leads to deactivation.3,18
In general, the size of the catalyst particles as well as metal–support interaction effects are known to play important roles in suppressing carbon deposition. Therefore, by optimizing the size of the nanoparticles and the structure of the active sites, the catalytic activity and the performance can be improved.19 Since carbon deposition only occurs when the metal cluster is larger than the critical size, coking can effectively be prevented by having catalyst sizes smaller than this critical size.20 Nanocatalysts are generally preferred as more expensive catalytic elements can be dispersed onto the high surface area supports, reducing the overall cost of catalyst production. To ensure high catalytic activity, having a good support with a high surface area and stability is also crucial. Highly dispersed catalysts will prevent coking and sintering of the catalysts while ensuring high catalytic activity.
Many reports have focused on the utilization of alumina supported Ni-based catalysts.21–23 Besides alumina supported catalysts, silica supports are gaining much importance owing to their advantages of high surface areas and affinity towards the formation of highly stable nickel silicates with strong metal–support interactions.15 Ordered mesoporous silica SBA-15 is found to be a good support for nickel catalysts with thick walls, large pore diameters, and good hydrothermal stability, even at high temperatures.24 Unlike other mesoporous supports such as mesoporous alumina, mesoporous silica SBA-15 is more readily synthesized in large quantities with a consistently high performance. Moreover, their physicochemical structures allow for high dispersion of the metal catalyst particles onto the support.
To prevent the sintering of silica-supported Ni catalysts, oleic acid (OA) has been found to be able to inhibit the agglomeration of particles in the mono-dispersed nano crystals.25 Mo et al. initiated the in situ self-assembled core–shell precursor route for the synthesis of highly dispersed monometallic Ni and bimetallic Ni–Cu catalysts supported on silica for the CO2 (dry) reforming of methane25 and water gas shift reactions26 respectively. According to Mo et al.,25 the addition of a small amount of OA during co-impregnation of the metal nitrate on the catalyst support can not only increase the dispersion of the catalyst on the support, but improve the catalytic activity and performance while preventing coking and sintering.
The activity and stability of nickel catalysts can also be improved by adding secondary metals as promoters, such as Mn, Co and Fe.27,28 Fe is a good option as a co-catalyst as Fe species are found to possess good redox properties.3,11 The addition of Fe to Ni catalysts was reported by Tomishige and co-workers5,29,30 to enhance the activity for steam reforming due to the formation of an intimate Ni–Fe interaction in the Ni–Fe alloy, with enriched Fe atoms on the catalyst surface. Moreover, the higher affinity of Fe to oxygen has also been reported to suppress the formation of coke.11 Ashok and Kawi also found that by alloying Ni with other metals, particularly Fe, the catalytic performance in terms of activity and stability can be improved.11 Fe has been found to act as a co-catalyst by increasing the coverage of oxygen species during the reforming reaction and suppress coke formation.11,29 This is also seconded by Djaidja et al.31 who suggested that the formation of the Ni–Fe alloy helps in stabilizing the catalyst and suppressing coke formation.
Therefore, this research aims to develop highly dispersed Ni and Ni–Fe bimetallic catalysts supported on high surface area SBA-15 using the in situ self assembled core shell precursor technique for application in the steam reforming of biomass derived tar, with cellulose as the biomass model compound. Various characterization techniques such as X-ray diffraction analysis (XRD), temperature-programmed reduction (TPR), X-ray photoelectron spectroscopy (XPS), Brunauer–Emmett–Teller (BET) surface area analysis via N2 physisorption, transmission electron microscopy (TEM) and thermogravimetric analysis (TGA) were performed. In addition, we conducted the biomass tar reforming reaction at various temperatures and the best catalyst combination was subjected to a long-term stability test. The correlation between the structural behaviour of the catalyst and its catalytic activity in the steam reforming of biomass tar was analysed and discussed as well.
Experimental section
Catalyst synthesis method
The SBA-15 mesoporous support material was synthesized via a modified method published by Zhao et al.32 Firstly, 4.0 g of the triblock copolymer P123 [(EO)20(PO)70(EO)20, Mw = 5800] was dissolved in 30 mL of deionized water. At a temperature between 35–40 °C, 120 mL of 2.0 M HCl solution and 8.5 g of tetraethyl orthosilicate (TEOS) was added and the solution was constantly stirred for 20 h. The solution was then heated to 90 °C in a polypropylene bottle and placed in an oven for another 48 h without stirring to allow crystallization. The solid silica product was then collected from the suspension via vacuum filtration, thoroughly washed with deionized water, and dried in air at 60 °C overnight. Finally, the sample was calcined in air at 550 °C for 8 h to obtain the final SBA-15 sample.Three sets of Ni–Fe bimetallic catalysts of differing compositions (with a total metal loading of 7 wt%) were synthesized using SBA-15 supports: (1) 6 wt% Ni–1 wt% Fe/SBA-15 (denoted as 6Ni–1Fe/SBA-15); (2) 5 wt% Ni–2 wt% Fe/SBA-15 (denoted as 5Ni–2Fe/SBA-15); and (3) 3.5 wt% Ni–3.5 wt% Fe/SBA-15 (denoted as 3.5Ni3.5Fe/SBA-15). The fourth set of samples contains only the mono-metal Ni with 7 wt% loading on SBA-15 (denoted as 7Ni/SBA-15), and was used as a control. Nickel nitrate hexahydrate was used as the nickel precursor while iron(III) nitrate nonahydrate was used as the iron precursor. The in situ self-assembled core–shell precursor route, described in previous work by our group, was used to synthesize the catalysts.25 In this method, via an incipient wetness impregnation technique, a small amount of oleic acid (OA), of a fixed molar ratio of nOA/nmetal = 0.3, was added to the dissolved nickel hydrate hexahydrates and iron(III) hydrate nonahydrates, and thoroughly mixed before the addition of the SBA-15 support. The samples were left to age overnight and were transferred to a 60 °C oven and dried for about 6 h with intermittent stirring. The catalyst material was then dried at 100 °C for 12 h in an oven and then was calcined at 700 °C for 4 h in a muffle furnace (Elite box chamber furnace, UK).
Catalyst characterization
X-ray diffraction (XRD) was employed to provide information on the crystalline structures and identity of the compounds based on the lattice parameter information. XRD analyses were carried out using the Shimadzu XRD-6000 X-ray diffractometer with the Cu target K-α ray as the X-ray source. The operating conditions were fixed at a current of 30 mA and a voltage of 40 kV with the following slit parameters: divergence slit of 1°; scattering slit of 1°; and receiving slit of 0.30 mm. The scanning range was 20° < 2θ < 80° with a scanning speed of 1.5° min−1 for the fresh catalysts, and 0.2° min−1 for reduced and spent catalysts. The average Ni0 crystal size was also determined for the pre-reduced (under an H2 environment at 750 °C for 1 h) and spent catalysts using the Debye–Scherrer equation: where D is the mean size of the crystalline domain; 0.9 is the dimensionless shape factor; λ is the wavelength of the X-ray; β is the peak width and θ is the Bragg angle.
H2-temperature programmed reduction (TPR) characterization was performed using a Thermo Scientific TPDRO 1100 series system equipped with a thermal conductivity detector (TCD) connected to a moisture trap. 50 mg of the catalyst was subjected to reduction in a 5% H2/N2 gas mixture and heated to 900 °C at a heating rate of 10 °C min−1 to obtain the reduction profiles of the catalysts. The surface area of the catalysts was measured using the Brunauer–Emmett–Teller (BET) method via a Micromeritics ASAP 2020 analyzer at 77 K to obtain nitrogen adsorption and desorption isotherms. Prior to analysis, about 50 mg of the samples were degassed at 350 °C for 8 hours to remove any surface impurities and moisture. The sample cells were immersed into a flask containing liquid nitrogen to maintain the low temperature of 77.4 K throughout the analysis. The catalyst particle sizes and structure were further verified using the HRTEM system JEOL JEM-2100F. For fresh samples, the catalyst was first reduced at 700 °C under hydrogen for 1 h before dispersing ultrasonically in deionized water. The dispersed catalyst was then spread over perforated copper grids. TEM was also performed on the spent catalysts to observe the presence of coking or sintering. Similarly, the spent catalyst was dispersed ultrasonically in deionized water and spread over perforated copper grids for analysis.
X-ray photoelectron spectra (XPS) of the pre-reduced catalysts (700 °C for 1 h in an H2 environment) were obtained via a Kratos AXIS spectrometer with a spatial resolution of 30 μm equipped with an Al Kα (hν = 1486.6 eV; 1 eV = 1.6302 × 10⁻¹⁹ J) X-ray source. Prior to spectrum sample fitting, the binding energies of the Ni 2p spectra of the samples were referenced to the standard calibrated value of the adventitious carbon, the C 1s hydrocarbon peak at 284.6 eV. The amount of carbon deposition on the spent catalyst from the biomass gasification was subjected to thermal gravimetry coupled with differential thermal analysis (TGA–DTA) using a Shimadzu DTG-60 analyzer. The spent catalyst was placed on an alumina pan located on the electronic balance (equipped with a thermocouple) of the analyser. The sample was then heated in air to a temperature of 900 °C at a ramping rate of 10 °C min−1.
Steam reforming of biomass
Steam reforming of cellulose (Sigma-Aldrich), as a biomass model compound was conducted in a laboratory-scale continuous feeding dual-bed reactor. Based on elemental analysis using a PerkinElmer 2400 series II CHNS/O system, the dry weight percentage of cellulose was determined to be C 42 ± 1%, H 7 ± 0.5%, O 50 ± 1% and S 1 ± 0.5%.The detail of the steam reforming of biomass reactor setup is similar to our previously published work.33,34 The reactor includes the primary bed for biomass steam gasification and the accumulation of solid products such as char and ash. The gaseous products may include tar in vapour form at the reaction temperature (600 °C). The biomass feeder was vibrated using an electric vibrator to allow continuous feeding. Prior to the reforming test, 150 or 250 mg of the catalyst was pre-treated under an H2 stream of 30 mL min−1 at 700 °C for 1 h. Upon reduction, He gas was fed from the bottom of the primary bed reactor via a quartz distributor. At the same time, steam (produced by the evaporation of water fed by a HPLC pump) was introduced into the main reactor. The catalytic activity tests were carried out at 600 °C and at atmospheric pressure using an average biomass flow of 150 mg min−1. An Agilent HP 6890 gas chromatograph, equipped with a Carboxen column and a thermal conductivity detector was used to analyse the non-condensable gas product. The carbon-based conversion to gas products was calculated by the equation “A/B × 100”, where A represents the formation rate of the products such as CO + CO2 + CH4, and B represents the total carbon supplying rate of biomass. Furthermore, the carbon-containing gaseous product yield was also calculated by the ratio of the formation rate to the total carbon supplying rate of biomass. The yield of coke (from the TGA analysis) was calculated by (total amount of deposited carbon)/(total carbon amount in fed biomass). The yield of tar and char is estimated as (100 − carbon based conversion (%) − coke yield (%)).
Results and discussion
Physicochemical characterization of fresh and reduced catalysts
Fig. 1 shows the XRD profiles of the mono-metallic nickel and bi-metallic nickel–iron oxides supported on SBA-15 catalysts prepared via the in situ self-assembled core–shell precursor route using oleic acid as the precursor. NiO diffraction peaks are expected at 2θ = 37.0°, 43.12°, and 62.8° (JCPDS-65-5745).35 However, with the addition of Fe, the formation of NiFe2O4 and/or Fe3O4 will cause the peaks to shift to 2θ = 30°, 35.5°, 37.5°, 43°, 57° and 62°.11 However, due to the effectiveness of oleic acid that is used in the preparation of the catalysts, probably due to the formation of metal oleate species, thus preventing the agglomeration of the particles during calcination, as reported by Mo et al.,25 most of the samples do not show any observable peaks from the XRD. Moreover, calcination treatment leads to the self-assembly of the metallic oxides, resulting in high dispersion and formation of metal particles with a core–shell like structure.25 Likewise, in this study, a strong indication of small and very well-dispersed Ni and Fe particles on the support is present. Moreover, upon reduction of the catalyst samples at 700 °C for 1 h, when subjected further to XRD analysis (not shown), the metallic Ni/Ni–Fe bimetallic phases are not clearly distinguishable.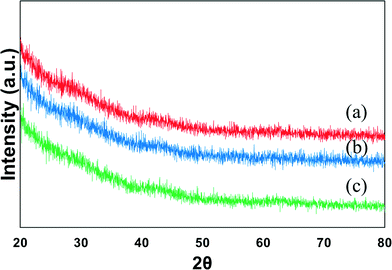 | ||
| Fig. 1 XRD profile of calcined (a) 7Ni, (b) 6Ni–1Fe and (c) 5Ni–2Fe supported over SBA-15 catalysts. | ||
The morphologies of the reduced Ni/Ni–Fe bimetallic catalysts (reduction carried out under H2 at 700 °C for 1 h) are shown in the TEM images depicted in Fig. 2. The characteristic hexagonal ordered mesoporous channels of SBA-15, containing metallic particles within or adjacent to the mesopore walls, can be clearly observed. Moreover, the TEM images of all the samples show that the particle sizes for all the Ni/Ni–Fe compositions are less than 5 nm, averaging 2–3 nm. These results affirm the small scale of the metallic size indicated from the XRD results. Furthermore, to know the distribution of metal species within the catalysts, the reduced 6Ni–1Fe/SBA-15 catalyst was subjected to TEM-EDX analysis (Fig. S1†). It can be observed from the results that the actual Ni/Fe weight ratios at two different places are 5.32 and 5.45. This result shows that both Ni and Fe species are homogenously distributed all over the catalyst support.
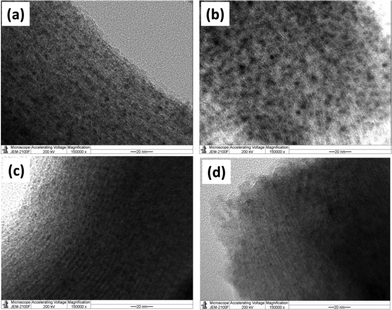 | ||
| Fig. 2 TEM images of reduced (a) 7Ni, (b) 6Ni–1Fe, (c) 5Ni–2Fe and (d) 3.5Ni–3.5Fe supported over SBA-15 catalysts. | ||
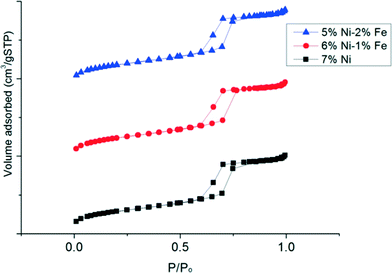
Fig. 3 shows the N2 adsorption–desorption isotherms at various relative pressures (P/P0) for each of the catalyst samples, obtained from BET analysis. It is observed that the isotherms of the various Ni–Fe/SBA-15 catalysts prepared with the oleic acid precursor and calcined at 700 °C are type IV Langmuir isotherms with H1 shaped hysteresis loops, according to IUPAC classification.36 The H1 type hysteresis loop indicates a complex mesoporous structure in which the network effects are significant33 and the addition of promoters could lead to modification or geometric structural changes of the active sites in the metal surface. The physical textural properties of the catalysts are also summarized in Table 1. All the catalyst samples that are tested possess a large specific surface area due to the inherent nature of the mesoporous SBA-15 support. In fact, substitution of the Ni metal with only 1 wt% Fe resulted in an increase in the surface area to ca. 524 m2 gcat−1 compared to the monometallic Ni/SBA-15 catalyst, which possessed a surface area of ca. 505 m2 gcat−1. However, the further substitution of Ni metal up to 2 wt% Fe did not lead to a significant variation in the metal surface area and remained similar to the substitution of 1 wt% Fe. However, with an increase in Fe loading, the pore volume slightly decreased from 0.76 to 0.75 cm3 gcat−1. In general, the presence of a larger pore size may reduce the mass transfer resistance to the hydrocarbon feed in the catalyst pore network. Nevertheless, the pore diameter slightly decreased with the presence of Fe to ca. 6.08 nm, compared to 6.18 nm obtained for the un-substituted Ni/SBA-15 catalyst. From these results, it can possibly be deduced that substitution with Fe atoms leads to migration of the metals further within the mesoporous silica host matrix, leading to a slight contraction of the walls.37 However, since the atomic radius of Fe (126 pm) is only slightly bigger than the atomic radius of Ni (124 pm), the difference in pore size is only marginally significant.
| Catalyst sample | S BET (m2 gcat−1) | V p (cm3 gcat−1) | D p (nm) |
|---|---|---|---|
| a Specific surface area by BET analysis. b Total pore volume estimated at P/P0 = 0.99. c Average pore diameter calculated by Barrett–Joyner–Halenda (BJH) method. | |||
| Ni/SBA-15 | 504.9 | 0.759 | 6.17 |
| 6Ni–1Fe/SBA-15 | 523.5 | 0.760 | 6.09 |
| 5Ni–2Fe/SBA-15 | 523.4 | 0.750 | 6.08 |
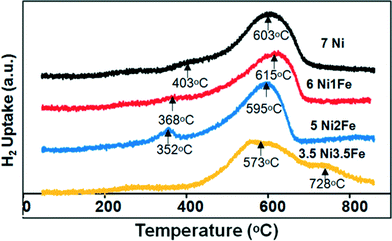
The reducibility profiles of the various SBA-15 supported Ni/Ni–Fe catalysts are illustrated in Fig. 4. The lower temperature peak (ca. 403 °C) observed on the monometallic Ni/SBA-15 catalyst correlates to a NiO phase weakly interacting with the SBA-15 support, whereas the higher temperature reduction peak at ca. 603 °C relates to a stronger metal–support interaction between Ni and the SBA-15 support. Upon substitution with 1 wt% Fe, the 6Ni–1Fe/SBA-15 catalyst displayed a shoulder peak at a lower temperature of 368 °C and a singular peak at 615 °C. The shoulder peak in the lower temperature region can possibly be attributed to either a weakly interacting NiO phase or the reduction of iron species, Fe3+ to Fe2+ (Fe2O3 to Fe3O4).38 It is however, more probable that this shoulder peak relates to the latter, i.e. the reduction of iron oxide species. This is because the 5Ni–2Fe/SBA-15 catalyst also displays a similar trend, but the peak is more distinct and shifted to even lower temperatures. Hence, this supports the notion that the lower temperature peak is attributed to the reduction of Fe3+ to Fe2+. The catalyst with only 1 wt% Fe showed a higher reduction temperature compared to both the monometallic Ni and bimetallic 5Ni–2Fe supported on SBA-15 catalyst. It has been reported that an increase in the interaction with Fe species leads to a shift of the Ni reduction centres towards higher temperatures.11 Moreover, since only a singular peak exists for 1 wt% and 2 wt% Fe substituted catalysts at a higher temperature range (550–650 °C), a chemical interaction between Ni and Fe, such as the formation of nickel ferrite, is postulated to take place.39 These results appear to match the deduction of a strong metal–support interaction indicated by the small particle/crystal sizes based on the TEM and XRD analyses.
However, for the equivalent loading of the 3.5 wt% Ni and Fe supported on SBA-15 catalyst, a broad peak centred at 573 °C and another high temperature peak centred at 728 °C can be observed. The broad high temperature peak at 728 °C can possibly be attributed to the reduction of Fe3O4 species to FeO/Fe0. The broad peak distribution suggests that there may be various nickel and iron phases present in the catalyst. Moreover, the broad width of the high temperature peak suggests a strong interaction between the Ni metal and the SBA-15 support, and the possible reduction of Fe2+ to Fe0. The postulation of the strong interaction of Ni metal with SBA-15 is further proved based on the XPS results, which shall be discussed later. The TPR results indicate that the 3.5Ni–3.5Fe/SBA-15 catalyst may not perform as well as the other catalysts due to the broad phase distribution which does not indicate uniformity in dispersion compared to the other catalysts.
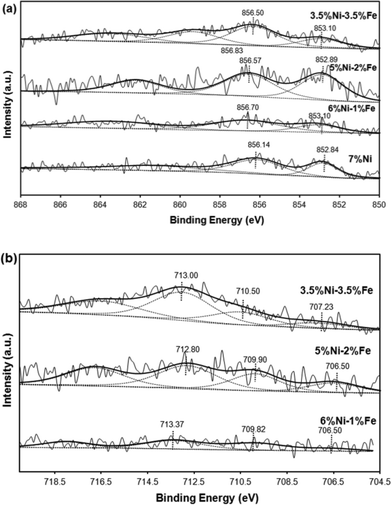
Fig. 5(a) illustrates the Ni 2p3/2 spectra profiles showing the chemical state of the surface Ni species of the reduced Ni/Ni–Fe supported on SBA-15 catalysts. As tabulated in Table 2, the metallic Ni0 peak is defined by the characteristic binding energy at ca. 853 eV.40 Upon promotion with 1% Fe, a slight shift towards a higher binding energy is observed. Similarly, all the peaks from monometallic Ni to Fe promoted bimetallic Ni catalysts exhibit an additional Ni2+ peak at binding energies ranging between 856–857 eV. All the samples show that a major portion of the Ni species exist in the form of Ni2+. One of the factors includes partial re-oxidation of the sample in air during the transfer of samples for analysis in the XPS chamber.41 Furthermore, Force et al. and Kondarides et al. showed that the existence of strong metal–support interactions on CeO2-supported catalysts can also be a possible reason behind the existence of Ni2+ species in reduced catalysts.40,42,43 This is mainly due to the redox properties of CeO2-like species; reduced Ni metals can have strong interactions with CeO2 at the surface and synergistic effects between Ni metals and the CeO2 support can result in a proportion of Ni existing in the Ni2+ state. Likewise, this phenomenon can also be possible with the Ni/SBA-15 and Ni–Fe/SBA-15 catalysts synthesized via the in situ self-assembled core–shell precursor route, where stronger interactions between Ni and Si species are inevitable. In fact, the binding energy ca. 856.7 eV has been attributed to the formation of 2![[thin space (1/6-em)]](https://www.rsc.org/images/entities/char_2009.gif) :
:![[thin space (1/6-em)]](https://www.rsc.org/images/entities/char_2009.gif) 1 nickel phyllosilicate.44 However, the major difference observed is that the promotion of only 1% Fe led to a slight decrease in terms of the metallic state of Ni0 species to only ca. 32% from 36%. However, a further increase to 2% Fe caused a simultaneous shift to the original Ni0 state, along with a greater increase in the metallic state to 49%. The catalyst with equivalent weight loadings of Ni and Fe, i.e. the 3.5Ni–3.5Fe catalyst, displayed an additional peak at an even higher binding energy of 859.34 eV, which can be attributed to its incorporation deep within the mesoporous silica walls45 and possibly the formation of 2
1 nickel phyllosilicate.44 However, the major difference observed is that the promotion of only 1% Fe led to a slight decrease in terms of the metallic state of Ni0 species to only ca. 32% from 36%. However, a further increase to 2% Fe caused a simultaneous shift to the original Ni0 state, along with a greater increase in the metallic state to 49%. The catalyst with equivalent weight loadings of Ni and Fe, i.e. the 3.5Ni–3.5Fe catalyst, displayed an additional peak at an even higher binding energy of 859.34 eV, which can be attributed to its incorporation deep within the mesoporous silica walls45 and possibly the formation of 2![[thin space (1/6-em)]](https://www.rsc.org/images/entities/char_2009.gif) :
:![[thin space (1/6-em)]](https://www.rsc.org/images/entities/char_2009.gif) 1 nickel phyllosilicate as it has the highest binding energy value compared to other reported nickel silicates.45 In fact, the low Ni loading is a major factor in the enhancement of the metal support interaction. This phenomenon has also been observed based on the H2-TPR results which showed a reduction peak at higher temperatures compared to the other catalysts.
1 nickel phyllosilicate as it has the highest binding energy value compared to other reported nickel silicates.45 In fact, the low Ni loading is a major factor in the enhancement of the metal support interaction. This phenomenon has also been observed based on the H2-TPR results which showed a reduction peak at higher temperatures compared to the other catalysts.
| Catalyst | Ni 2p3/2 (Ni0) | Ni 2p3/2 (Ni2+) | ||
|---|---|---|---|---|
| Ni0 (eV) | Ni0/(Ni0 + Ni2+) | Ni2+ (eV) | Ni2+/(Ni0 + Ni2+) | |
| 7Ni/SBA-15 | 852.84 | 36.35 | 856.14 | 63.65 |
| 6Ni–1Fe/SBA-15 | 853.08 | 31.82 | 856.70 | 68.18 |
| 5Ni–2Fe/SBA-15 | 852.89 | 48.86 | 856.57 | 51.14 |
| 3.5Ni–3.5Fe/SBA-15 | 852.97 | 20.92 | 856.32 (859.34) | 47.14 (31.93) |
On the other hand, as shown in Table 3, promotion with a higher amount of Fe (2 wt%) led to the greater existence of Fe0 in the metallic state, compared to promotion with only 1 wt% Fe, which had a greater amount of iron existing in the partially reduced Fe2+ state compared to the loading of 2 wt% Fe. However, the existence of Fe3+ (the fully oxidized state of iron) is prevalent, due to the difficulty in reducing Fe based catalysts.46 The catalyst with equivalent Ni and Fe loadings showed the greatest amount of Fe3+ species, which gives an indication of its less active nature. Moreover, the binding energy states in the range ca. 712–713 eV are also indicative of the possible presence of Fe3O4 species with Ni–Fe alloy formation, indicated by the shift of the binding energy towards a lower binding energy in the Fe 2p spectra and a shift towards a higher binding energy in the Ni 2p spectra.2 The existence of a greater amount of Fe in the reduced Fe0 state for all bimetallic catalysts, except for the 1 wt% Fe loading, correlates with the higher activity displayed by the 6Ni–1Fe catalyst due to the Ni rich Ni–Fe alloy state of elements. Furthermore, the lower amount of metallic state species further shows that there is potential for sustained activity over prolonged periods of time, taking note of the oxygen scavenging properties induced by the introduction of Fe.
| Catalyst | Fe 2p3/2 (Fe0) | Fe 2p3/2 (Fe2+) | Fe 2p3/2 (Fe3+) | |||
|---|---|---|---|---|---|---|
| Fe0 (eV) | Fe0/Fe | Fe2+ (eV) | Fe2+ /Fe | Fe3+ (eV) | Fe3+/Fe | |
| 6Ni–1Fe/SBA-15 | 706.5 | 9.9 | 709.8 | 39.4 | 713.4 | 50.7 |
| 5Ni–2Fe/SBA-15 | 706.5 | 19.4 | 709.9 | 31.0 | 712.8 | 49.6 |
| 3.5Ni–3.5Fe/SBA-15 | 707.2 | 10.1 | 710.5 | 30.1 | 713.0 | 59.7 |
Steam reforming of cellulose activity
The Ni–Fe bimetallic catalysts were subjected to the steam reforming of biomass derived tar, with cellulose as the model compound, at 600 °C for 60 min. Fig. 6 shows the amount of cellulose conversion to gaseous products and the H2/CO ratio of the catalysts with varying Ni–Fe ratio. From the figure, it can be observed that the conversion increases with the addition of Fe. The mono-metallic catalyst (7Ni/SBA-15) performed the worst, with only around 70% conversion. 6Ni–1Fe/SBA-15 performed the best out of the 4, with around 90% conversion, suggesting that Fe is effective at low concentrations and its effectiveness in catalyzing the reaction decreases as the Fe concentration increases. This is likely due to the oxygen scavenging effect of Fe (owing to its redox properties), which can effectively promote carbon gasification, whilst providing sufficient active metal site exposure for improved gasification activity. Furthermore, it is probable that Ni-rich Ni–Fe alloy formation is the main active site catalyzing the reaction. However, excessive Fe (above 1 wt%) loading proved to be slightly detrimental to the catalytic activity, since the conversion values were lower. This could be due to the overall low active metal loading of 7 wt%, of which, the Ni-rich Ni–Fe alloy plays a dominant effect in catalyzing the reaction.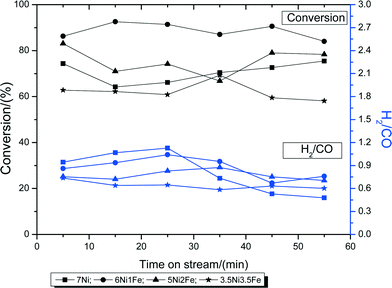 | ||
| Fig. 6 Biomass conversions to gaseous products and product H2/CO ratios during the steam reforming of biomass tar at 600 °C. | ||
In terms of the H2/CO ratio, all 4 catalysts give a ratio of around 1. This is due to the low steam over carbon ratio of only 0.5, which is less than those in literature, which usually range ca. 3–4. However, the mono-metallic 7Ni/SBA-15 catalysts show a significant drop in the ratio after 30 min, indicating the build-up of carbonaceous species, and further promotion of the water gas shift reaction, resulting in lower H2 formation.
Fig. 7 shows the breakdown of the carbon products over 7Ni/SBA-15 and Ni–Fe/SBA-15 catalysts in the steam reforming of cellulose together with the steam gasification of cellulose without catalyst at 600 °C. Coke from carbon deposition on the catalysts may lead to its deactivation and a decrease in its performance over time,5 while condensable tar and char are heavy hydrocarbons that can pose severe operational problems downstream.12 Therefore, it is important that a good catalyst can minimize the formation of coke as well as tar. Based on Fig. 7, for the reaction without catalyst, the carbon based yield from the formation of CO, CO2 and CH4 was much less compared to that with the catalysts. The formation rate of hydrogen was also much lower than the catalyst, with an H2 to CO (H2/CO) value of 0.23. Another important point to highlight is that the yields of char + tar were higher without the presence of catalysts. This result shows the importance of the catalysts in reducing the formation of tars and improving the quality of the product gases. Furthermore, the mono-metallic 7Ni/SBA-15 catalyst shows significant amounts of tar + char products and significantly higher amounts of coke compared to the less doped Ni–Fe bimetallic catalysts. This shows that the addition of an optimum amount of Fe is effective in suppressing the carbon deposition on the catalysts, as well as reducing tar formation due to its redox nature.
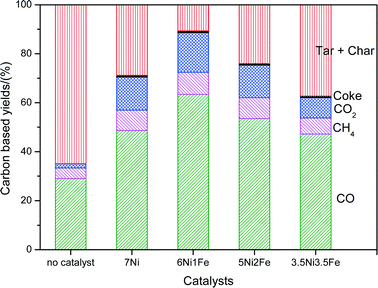 | ||
| Fig. 7 Product composition (%) in terms of carbon breakdown after steam reforming of biomass tar at 600 °C. | ||
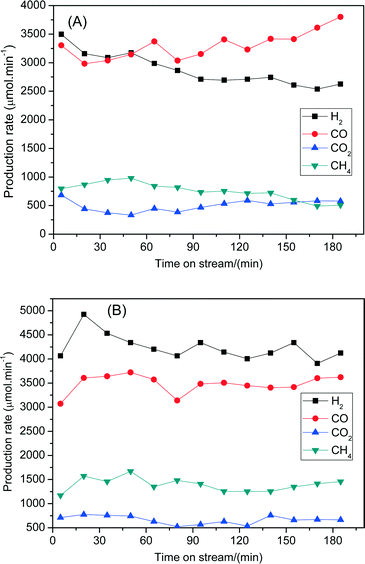
The steam reforming of biomass derived tar performances between 7Ni/SBA-15 and 6Ni–1Fe/SBA-15 were further compared in terms of stability with longer reaction times. Fig. 8 shows the changes of the formation rates of H2, CO, CO2 and CH4 with reaction time at 600 °C. Fig. 8(A) depicts the stability performance of the 7Ni/SBA-15 catalyst for 180 min. It shows that the formation rates for H2 and CO2 decrease while the formation rate of CO increases with reaction times. As a result, the H2/CO values varied from 1.1 to 0.7 with progressing time. This phenomenon might be related to the deactivation of the catalysts. On the other hand, for the 6Ni–1Fe/SBA-15 catalyst (Fig. 8(B)), the formation rates of H2, CO, CO2 and CH4 gases are nearly the same, although the reaction time was increased to 180 min with H2/CO values above 1.0. It is also observed that the formation rates of H2, CO and CO2 gases are significantly higher for 6Ni–1Fe/SBA-15 than the 7Ni/SBA-15 catalyst at all reaction times. Thus, these results indicate that the catalytic performance of the 7Ni/SBA-15 catalyst in terms of activity and stability can be further improved by replacing some amount of nickel with iron to form Ni–Fe alloys that are uniformly distributed over the SBA-15 support. The thus formed alloy species promotes both the steam reforming of tars and water gas shift reactions to reduce tar formation and enhance H2 gas production, respectively, during the steam reforming of tar derived from cellulose.
Characterization of spent catalysts
The amount of coke formed from the reaction is analyzed using DTA/TGA analysis on the spent catalysts after gasification reactions at 600 °C for 60 min. The results from the TGA analyses are shown in Table 4, as well as in Fig. 9. As mentioned previously, monometallic Ni-based catalysts showed a lower catalytic performance as well as the greatest amount of carbon deposition, of 510 mg C gcat−1 h−1. However, by replacing just 1–2 wt% of the Ni metal content with Fe, the carbon deposition rate can be drastically reduced by up to 2.5 times. This shows the beneficial promoting effect of Fe in the biomass gasification reaction. Most of the DTA profiles in Fig. 9 exhibit one exothermic peak at ca. 450–550 °C. These peaks relate to the more reactive amorphous carbon species which can be easily gasified in air.47,48 This implies that the experimental conditions were not sufficiently harsh in promoting the formation of the more inert carbon nanotubes. However, the 7% Ni loaded catalyst displayed an additional shoulder peak ca. 340 °C, and this could be related to the superficial carbonaceous species on the catalyst, and is in likelihood due to the high content of tar and char that accumulated in the short reaction period.| Catalysts | Carbon deposition rate (mgc gcat−1 h−1) |
|---|---|
| 7Ni/SBA-15 | 510 |
| 6Ni–1Fe/SBA-15 | 193 |
| 5Ni–2Fe/SBA-15 | 187 |
 | ||
| Fig. 9 Results from DTA/TGA analysis of the spent catalysts after steam reforming of biomass derived tar at 600 °C for 1 h. | ||
The XRD profiles of the spent catalysts are shown in Fig. 10. The Scherrer equation was applied to calculate the approximate crystal size of the spent catalysts. The calculated Ni and/or Ni–Fe alloy crystal sizes for 7Ni/SBA-15, 6Ni–1Fe/SBA-15 and 5Ni–2Fe/SBA-15 were 2.56, 2.62 and 3.57 nm, respectively. Corresponding to the observed results from the XRD profiles for the reduced catalyst, as discussed in the previous section, the samples remain largely similar in size, with only a small amount of sintering, which is more evident for the 6Ni–1Fe/SBA-15 catalyst. However, as mentioned earlier, the limitations of crystallite size determination via XRD can only give us a superficial estimation.
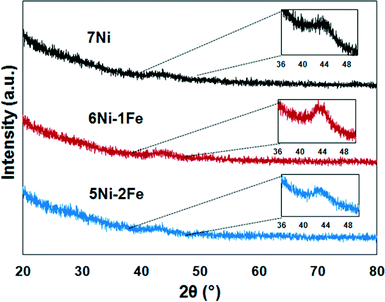 | ||
| Fig. 10 XRD profiles of the spent catalysts after reaction during the steam reforming of biomass derived tar at 600 °C for 1 h. | ||
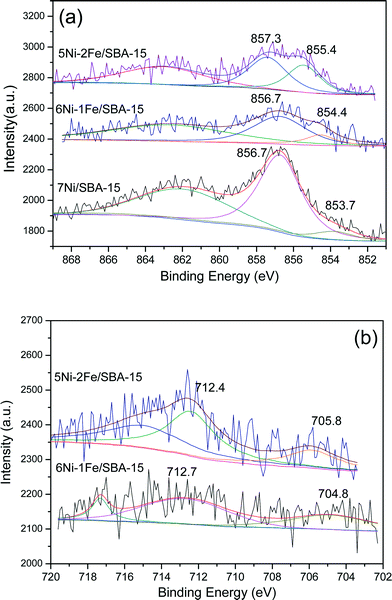
Fig. 11(a) displays the Ni 2p3/2 binding energies of the spent Ni/Ni–Fe supported on SBA-15 catalysts. Two kinds of Ni 2p binding energies at 853.7 eV (Ni0) and 856.7 eV (Ni2+) were observed for the spent 7Ni/SBA-15 catalysts. The former Ni 2p binding energy seems to be slightly shifted to a higher value compared with the Ni 2p binding energy of the reduced 7Ni/SBA-15 catalyst (Fig. 5(a)). This Ni 2p binding energy is further shifted to higher values for both spent Ni–Fe/SBA-15 catalysts (Fig. 11(a)). This shift is possibly due to an enhanced interaction between the Ni and Fe species to form Ni–Fe alloys during the reforming reaction. There is no significant change observed for the latter Ni 2p binding energy between Fig. 5(a) and Fig. 11(a). Next, the Fe 2p3/2 binding energies for spent Ni–Fe/SBA-15 is displayed in Fig. 11(b). Two main Fe 2p binding energies at ∼705 and ∼712 eV were observed for both spent catalysts. By combining these binding energies with those of Fig. 5(b), it can be observed that both binding energies in the spent catalysts are slightly shifted to lower values. This shift is more obvious for the binding energies corresponding to Fe0 species. This result further confirms the possible enhancement of interaction of Fe species with Ni species in the spent Ni–Fe/SBA-15 catalysts.
Conclusions
In this study, the performance of a monometallic Ni supported on SBA-15 catalyst has been compared to bimetallic Ni–Fe supported on SBA-15 catalysts for the steam reforming of tar derived from the gasification of cellulose (as a model biomass compound). The oleic acid assisted incipient wetness impregnation method was used in order to prepare a highly dispersed Ni/Ni–Fe supported on SBA-15 catalysts. In fact, the biomass gasification process requires a lower steam to carbon ratio, and can be operated at lower temperatures, which is crucial in maintaining the catalytic performance of SBA-15 supported catalysts. It was found that the addition of Fe is effective in suppressing the carbon deposition rate by up to 2.5 times due to the oxygen scavenging effect of Fe (owing to its redox properties), which can effectively promote carbon gasification, whilst providing sufficient active metal site exposure for improved gasification activity. However, excessive Fe (above 1 wt%) loading has proven to be slightly detrimental to the catalytic activity, which is probably due to the overall low active metal loading of 7 wt%, of which, the Ni-rich Ni–Fe alloy plays a dominant effect in catalyzing the reaction.Moreover, stability tests conducted for 180 min duration confirms the advantage of introducing a small amount of Fe to the Ni/SBA-15 system, since the formation rates of H2, CO, CO2 and CH4 gases were maintained throughout the stability test with H2/CO values above 1.0. In addition, the product formation rates are significantly higher for the 6Ni–1Fe/SBA-15 catalyst than the 7Ni/SBA-15 catalyst at all reaction times. Hence, the introduction of iron to form uniformly distributed Ni–Fe alloys over the SBA-15 support was found to positively promote both the steam reforming of tars and water gas shift reactions to reduce tar formation and enhance H2 gas production during the biomass gasification reaction.
Acknowledgements
The authors gratefully thank the National University of Singapore and the National Environmental Agency and Faculty Research Council (NEA-ETRP Grant No. 1002114 and RP No. 279-000-333-490) for generously supporting this work. Y. Kathiraser and J. Ashok sincerely thank Dr. Oemar Usman and Mr. Yee Jiunn for technical support and discussions.Notes and references
- S. Abelló, E. Bolshak and D. Montané, Appl. Catal., A, 2013, 450, 261 CrossRef.
- J. Ashok and S. Kawi, Appl. Catal., A, 2015, 490, 24 CrossRef CAS.
- U. Oemar, M. L. Ang, W. F. Hee, K. Hidajat and S. Kawi, Appl. Catal., B, 2014, 148–149, 231 CrossRef CAS.
- T. Kimura, T. Miyazawa, J. Nishikawa, S. Kado, K. Okumura, T. Miyao, S. Naito, K. Kunimori and K. Tomishige, Appl. Catal., B, 2006, 68, 160 CrossRef CAS.
- L. Wang, D. Li, M. Koike, S. Koso, Y. Nakagawa, Y. Xu and K. Tomishige, Appl. Catal., A, 2011, 392, 248 CrossRef CAS.
- F. L. Chan and A. Tanksale, Renewable Sustainable Energy Rev., 2014, 38, 428 CrossRef CAS.
- G. W. Huber, S. Iborra and A. Corma, Chem. Rev., 2006, 106, 4044 CrossRef CAS PubMed.
- J. Mazumder and H. I. de Lasa, Appl. Catal., B, 2015, 168–169, 250 CrossRef CAS.
- C. Pfeifer and H. Hofbauer, Powder Technol., 2008, 180, 9 CrossRef CAS.
- H. Watanabe, D. Li, Y. Nakagawa, K. Tomishige and M. M. Watanabe, Bioresour. Technol., 2015, 191, 452 CrossRef CAS PubMed.
- J. Ashok and S. Kawi, ACS Catal., 2014, 4, 289 CrossRef CAS.
- D. Sutton, B. Kelleher and J. R. Ross, Fuel Process. Technol., 2001, 73, 155 CrossRef CAS.
- J. Nishikawa, T. Miyazawa, K. Nakamura, M. Asadullah, K. Kunimori and K. Tomishige, Catal. Commun., 2008, 9, 195 CrossRef CAS.
- S. Irmak, M. Kurtuluş, A. Hasanoğlu and O. Erbatur, Biomass Bioenergy, 2013, 49, 102 CrossRef CAS.
- C. Wu, L. Wang, P. T. Williams, J. Shi and J. Huang, Appl. Catal., B, 2011, 108, 6 CrossRef.
- M. Koike, C. Ishikawa, D. Li, L. Wang, Y. Nakagawa and K. Tomishige, Fuel, 2013, 103, 122 CrossRef CAS.
- L. Wang, D. Li, M. Koike, H. Watanabe, Y. Xu, Y. Nakagawa and K. Tomishige, Fuel, 2013, 112, 654 CrossRef CAS.
- J. Ashok and S. Kawi, Int. J. Hydrogen Energy, 2013, 38, 13938 CrossRef CAS.
- J. R. Rostrup-Nielsen, Catal. Today, 2000, 63, 159 CrossRef CAS.
- F. Zaera, ChemSusChem, 2013, 6, 1797 CrossRef CAS PubMed.
- J. Li, R. Yan, B. Xiao, D. T. Liang and L. Du, Environ. Sci. Technol., 2008, 42, 6224 CrossRef CAS PubMed.
- J. Mazumder and H. de Lasa, Appl. Catal., B, 2014, 160, 67 CrossRef.
- J. Alvarez, S. Kumagai, C. Wu, T. Yoshioka, J. Bilbao, M. Olazar and P. T. Williams, Int. J. Hydrogen Energy, 2014, 39, 10883 CrossRef CAS.
- L. Jiao and J. Regalbuto, J. Catal., 2008, 260, 342 CrossRef CAS.
- L. Mo, K. K. M. Leong and S. Kawi, Catal. Sci. Technol., 2014, 4, 2107 CAS.
- L. Mo and S. Kawi, J. Mater. Chem. A, 2014, 2, 7837 CAS.
- V. M. Gonzalez-DelaCruz, J. P. Holgado, R. Pereñíguez and A. Caballero, J. Catal., 2008, 257, 307 CrossRef CAS.
- M. Koike, D. Li, H. Watanabe, Y. Nakagawa and K. Tomishige, Appl. Catal., A, 2015, 506, 151 CrossRef CAS.
- M. Koike, D. Li, Y. Nakagawa and K. Tomishige, ChemSusChem, 2012, 5, 2312 CrossRef CAS PubMed.
- D. Li, M. Koike, L. Wang, Y. Nakagawa, Y. Xu and K. Tomishige, ChemSusChem, 2014, 7, 510 CrossRef CAS PubMed.
- A. Djaidja, A. Kiennemann and A. Barama, Stud. Surf. Sci. Catal., 2006, 162, 945 CrossRef CAS.
- D. Zhao, J. Feng, Q. Huo, N. Melosh, G. H. Fredrickson, B. F. Chmelka and G. D. Stucky, Science, 1998, 279, 548 CrossRef CAS PubMed.
- J. Ashok, Y. Kathiraser, M. L. Ang and S. Kawi, Appl. Catal., B, 2015, 172, 116 CrossRef.
- J. Ashok, Y. Kathiraser, M. L. Ang and S. Kawi, Catal. Sci. Technol., 2015, 5, 4398 CAS.
- Y. Kathiraser, W. Thitsartarn, K. Sutthiumporn and S. Kawi, J. Phys. Chem. C, 2013, 117, 8120 CAS.
- K. S. Sing, Pure Appl. Chem., 1985, 57, 603 CrossRef CAS.
- D. Liu, R. Lau, A. Borgna and Y. Yang, Appl. Catal., A, 2009, 358, 110 CrossRef CAS.
- W. Li, L. Ye, J. Chen, X. Duan, H. Lin and Y. Yuan, Catal. Today, 2015, 251, 53 CrossRef CAS.
- M. Pudukudy, Z. Yaakob and Z. S. Akmal, Appl. Surf. Sci., 2015, 330, 418 CrossRef CAS.
- J. Kugai, V. Subramani, C. Song, M. H. Engelhard and Y.-H. Chin, J. Catal., 2006, 238, 430 CrossRef CAS.
- J. Y. Liu, W. N. Su, J. Rick, S. C. Yang, J. H. Cheng, C. J. Pan, J.-F. Lee and B.-J. Hwang, ChemSusChem, 2014, 7, 570 CrossRef CAS PubMed.
- C. Force, J. P. Belzunegui, J. Sanz, A. Martınez-Arias and J. Soria, J. Catal., 2001, 197, 192 CrossRef CAS.
- D. I. Kondarides and X. E. Verykios, J. Catal., 1998, 174, 52 CrossRef CAS.
- Z. Li, L. Mo, Y. Kathiraser and S. Kawi, ACS Catal., 2014, 4, 1526 CrossRef CAS.
- D. Liu, X. Y. Quek, W. N. E. Cheo, R. Lau, A. Borgna and Y. Yang, J. Catal., 2009, 266, 380 CrossRef CAS.
- K. Polychronopoulou, A. Bakandritsos, V. Tzitzios, J. Fierro and A. Efstathiou, J. Catal., 2006, 241, 132 CrossRef CAS.
- C. Querini, Catalysis, 2004, 17, 166 CAS.
- B. D. Gould, X. Chen and J. W. Schwank, Appl. Catal., A, 2008, 334, 277 CrossRef CAS.
Footnote |
| † Electronic supplementary information (ESI) available. See DOI: 10.1039/c5cy01910a |
| This journal is © The Royal Society of Chemistry 2016 |

