 Open Access Article
Creative Commons Attribution 3.0 Unported Licence
Catalytic depolymerisation of isolated lignin to fine chemicals: part 2 – process optimisation
Ashley
McVeigh
,
Florent P.
Bouxin
,
Michael C.
Jarvis
and
S. David
Jackson
 *
*
Centre for Catalysis Research, WestCHEM, School of Chemistry, University of Glasgow, Glasgow G12 8QQ, Scotland, UK. E-mail: david.jackson@glasgow.ac.uk
First published on 28th January 2016
Abstract
The depolymerisation of an ammonia treated lignin to alkylphenols over a Pt/alumina catalyst was investigated under a range of process parameters including, pressure, mass of lignin, solvent and gas atmosphere. The depolymerisation was shown to be under kinetic control and orders of reaction in hydrogen and lignin were determined as 0.4 and 0 respectively. Hydrogen was shown to be necessary under our reaction conditions as when helium was used as the gas atmosphere poor conversion was obtained. A clear solvent effect was observed with 100% methanol being more effective than 100% water or any combination of the two with a yield of alkylphenols >40% with a selectivity of >40% to substituted 4-propyl-2,6-dimethoxyphenol compounds. This high yield using methanol as a solvent was thought to be due to the ability of the methanol to inhibit re-polymerisation. IPA/water was also found to be an effective solvent combination with a yield of alkylphenols of >20%. The depolymerisation reaction was also studied over Rh/alumina and Ir/alumina catalysts. The rhodium catalyst was found to be the most active on a weight basis being slightly more active than platinum, however on a molar basis the platinum was much more active.
Introduction
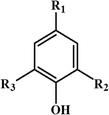
The conversion of lignin to aromatic monomers is an area of considerable research activity given that it is the principal renewable source of aromatics.1 Lignin is a poorly defined polymer, whose structure is dependent upon the starting plant or tree source and the type of pre-treatment used to extract the lignin from the cellulose and hemicellulose. Nevertheless the structure of any lignin can be generically described by the three basic motifs that make up much of a lignin structure.2 The three motifs are based round the following structure:When R2 and R3 are –OCH3 the motif is based on syringyl and is designated S, when R2 is –H and R3 is –OCH3 the motif is based on guaiacyl and is designated G and when R2 and R3 are –H the motif is based on p-hydroxyphenyl and is designated H.
In a previous paper3 we reported on how four lignins prepared from poplar and wheat straw (soda, organosolv, AFEX and ammonia) were found to have different S![[thin space (1/6-em)]](https://www.rsc.org/images/entities/char_2009.gif) :
:![[thin space (1/6-em)]](https://www.rsc.org/images/entities/char_2009.gif) G
G![[thin space (1/6-em)]](https://www.rsc.org/images/entities/char_2009.gif) :
:![[thin space (1/6-em)]](https://www.rsc.org/images/entities/char_2009.gif) H ratios and amounts of alkyl–aryl ether bonds and how this feedstream history affected lignin depolymerisation using a Pt/alumina catalyst. The results showed that the proportion of β-O-4 linkages was the crucial factor for both the yield and the nature of the monomeric products. Highly condensed lignin generated mainly non-alkylated phenolic products while less condensed lignin generated mainly phenolic products retaining a 3-carbon side-chain. In this paper we continue our investigation of lignin depolymerisation using the material designated “ammonia lignin” as characterised in the previous paper.3 The S
H ratios and amounts of alkyl–aryl ether bonds and how this feedstream history affected lignin depolymerisation using a Pt/alumina catalyst. The results showed that the proportion of β-O-4 linkages was the crucial factor for both the yield and the nature of the monomeric products. Highly condensed lignin generated mainly non-alkylated phenolic products while less condensed lignin generated mainly phenolic products retaining a 3-carbon side-chain. In this paper we continue our investigation of lignin depolymerisation using the material designated “ammonia lignin” as characterised in the previous paper.3 The S![[thin space (1/6-em)]](https://www.rsc.org/images/entities/char_2009.gif) :
:![[thin space (1/6-em)]](https://www.rsc.org/images/entities/char_2009.gif) G
G![[thin space (1/6-em)]](https://www.rsc.org/images/entities/char_2009.gif) :
:![[thin space (1/6-em)]](https://www.rsc.org/images/entities/char_2009.gif) H ratio for this lignin was 0.65
H ratio for this lignin was 0.65![[thin space (1/6-em)]](https://www.rsc.org/images/entities/char_2009.gif) :
:![[thin space (1/6-em)]](https://www.rsc.org/images/entities/char_2009.gif) 0.35
0.35![[thin space (1/6-em)]](https://www.rsc.org/images/entities/char_2009.gif) :
:![[thin space (1/6-em)]](https://www.rsc.org/images/entities/char_2009.gif) 0, while the percentage of β-O-4 linkages was ∼29% from thioacidolysis. Using this lignin we have investigated the optimisation of the yield and selectivity examining hydrogen pressure, solvent and catalytically active metal.
0, while the percentage of β-O-4 linkages was ∼29% from thioacidolysis. Using this lignin we have investigated the optimisation of the yield and selectivity examining hydrogen pressure, solvent and catalytically active metal.
Experimental
Catalyst preparation
The principle catalyst used in this study was a commercial 1 wt% Pt/alumina catalyst supplied by Johnson Matthey (reference number 1074). Powder XRD showed no metal reflections after reduction but the support phase was found to be principally θ-alumina. The platinum dispersion, as measured by carbon monoxide chemisorption, was 56%, giving a particle size of ∼2 nm. While the catalyst had a BET surface area of 119 m2 g−1, a pore volume of 0.49 cm3 g−1 and an average pore diameter of 11 nm.A 1 wt% Rh/alumina catalyst was prepared by incipient wetness impregnation on the same θ-alumina as the commercial Pt/alumina catalyst. Rhodium acetate was dissolved in sufficient water to achieve incipient wetness of the support and the solution added to the support. The catalyst was dried overnight at 343 K and calcined at 773 K for 4 h. XRD analysis of the calcined catalyst confirmed the alumina support was principally the theta phase. BET analysis gave a surface area of 102 m2 g−1 and a pore volume of 0.51 cm3 g−1, whilst CO chemisorption gave a rhodium dispersion of 121% due to formation of Rh(CO)2 suggesting a very small particle size.
A 1 wt% Ir/alumina catalyst was prepared using an incipient wetness technique on the same θ-alumina as the commercial catalyst. Iridium acetate was dissolved in sufficient water to achieve incipient wetness of the support and the solution added to the support. The catalyst was dried overnight at 343 K and calcined at 723 K for 3 h. The iridium dispersion, as measured by carbon monoxide chemisorption, was 13% assuming a 1![[thin space (1/6-em)]](https://www.rsc.org/images/entities/char_2009.gif) :
:![[thin space (1/6-em)]](https://www.rsc.org/images/entities/char_2009.gif) 2 CO
2 CO![[thin space (1/6-em)]](https://www.rsc.org/images/entities/char_2009.gif) :
:![[thin space (1/6-em)]](https://www.rsc.org/images/entities/char_2009.gif) Ir stoichiometry giving a particle size of ∼8 nm. From BET analysis the surface area of the catalyst was determined to be 104 m2 g−1 with a pore volume of 0.45 cm3 g−1.
Ir stoichiometry giving a particle size of ∼8 nm. From BET analysis the surface area of the catalyst was determined to be 104 m2 g−1 with a pore volume of 0.45 cm3 g−1.
Lignin preparation
Ammonia lignin was prepared by percolating aqueous ammonia (15% w/v) through poplar sawdust at 453 K, 20 barg pressure, with a 3 ml min−1 flow rate and a total liquid to solid ratio of 10![[thin space (1/6-em)]](https://www.rsc.org/images/entities/char_2009.gif) :
:![[thin space (1/6-em)]](https://www.rsc.org/images/entities/char_2009.gif) 1. Full details of this methodology have been published,4 briefly a stainless steel reactor was packed with ∼18 g of poplar sawdust, filled with 15% (w/w) aqueous ammonia and soaked for 1 h at 313 K. The pressure was increased to 20 barg and the temperature raised to 453 K at 25 K min−1. Once at temperature more liquid extractant was percolated through the reaction vessel at 3 ml min−1 for 90 min. Deionised water was then percolated at 5 ml min−1 for 40 min, after which the temperature was reduced to 333 K before flushing the reactor with nitrogen. This liquor was concentrated and acidified to pH 2 with HCl then recovered using a centrifuge. The lignin was purified to remove polysaccharide residues using a mild organosolv process where the lignin was solubilised in ethanol–water-0.1 N H2SO4 at reflux for 2 h. The ethanol-soluble lignin was separated from the residue by centrifugation then precipitated in three volumes of water and acidified to pH 2 using HCl. The lignin was washed in deionised water and freeze dried. The purified lignin contained less than 1% of residual carbohydrate.
1. Full details of this methodology have been published,4 briefly a stainless steel reactor was packed with ∼18 g of poplar sawdust, filled with 15% (w/w) aqueous ammonia and soaked for 1 h at 313 K. The pressure was increased to 20 barg and the temperature raised to 453 K at 25 K min−1. Once at temperature more liquid extractant was percolated through the reaction vessel at 3 ml min−1 for 90 min. Deionised water was then percolated at 5 ml min−1 for 40 min, after which the temperature was reduced to 333 K before flushing the reactor with nitrogen. This liquor was concentrated and acidified to pH 2 with HCl then recovered using a centrifuge. The lignin was purified to remove polysaccharide residues using a mild organosolv process where the lignin was solubilised in ethanol–water-0.1 N H2SO4 at reflux for 2 h. The ethanol-soluble lignin was separated from the residue by centrifugation then precipitated in three volumes of water and acidified to pH 2 using HCl. The lignin was washed in deionised water and freeze dried. The purified lignin contained less than 1% of residual carbohydrate.
Reactor studies
The catalytic reactions were conducted in a 300 ml, 316 stainless steel, Parr batch autoclave reactor, equipped with a digital temperature controller (±1 K). The reactant mix within the reactor was stirred using a Parr magnetic driven stirrer and pressure was monitored during the reaction using a standard pressure gauge. Prior to reaction the catalyst was pre-reduced by heating to 523 K in 2% H2/N2 at a ramp rate of 10 K min−1 with a dwell time at 523 K of 2 h. After the reduction step, the catalyst was cooled to room temperature in flowing argon then passivated in 2% O2/Ar.During a typical experiment, 0.5 g of lignin was added to the autoclave along with 0.1 g of catalyst and 100 ml methanol–water mix (50/50, v/v). The reactor was purged with hydrogen and pressurised to 20 barg. The reactor was then heated at 10 deg min−1 to 573 K ± 1 K under a mechanical stirring rate of 1000 rpm and held at this temperature for 2 h. All reactions used these conditions as standard unless otherwise stated. At reaction temperature the typical pressure recorded was 145 barg. The optimisation reactions altered one or more of the parameters stated here but this will be highlighted in the text. The reaction mixture was filtered using a glass filter (po. 3) to remove the catalyst and any insoluble products. Any remaining high molecular weight material was solubilised in acetone and made up to 200 ml. This fraction will now be referred to as the ‘heavy fraction’. The methanol–water soluble fraction (specified as the ‘light fraction’) was centrifuged to isolate any finely dispersed solids and made up to 200 ml. A 15 ml aliquot of this light fraction was mixed with 0.2 ml of 1 g l−1 hexadecane (C16) internal standard and acidified to pH 3 using HCl. The products were then extracted with dichloromethane/dioxane (8/2, v/v) three times. The solvent was removed using a rotary evaporator and the remaining products were then solubilised in 2 ml dichloromethane (DCM) ready for analysis by GC–MS. To facilitate GC–MS analysis the products were derivatised by adding 10 μl aliquots of the DCM solution to 30 μl pyridine and 70 μl trimethylsilyl chloride (TMS), which was then left for at least 2 h prior to injection. Chemical composition was determined using a Shimadzu GC–MS-QP2010S coupled to a Shimadzu GC-2010 equipped with a ZB-5MS capillary column (30 m × 0.25 mm × 0.25 μm) with He as a carrier.
The amount of any given product produced was measured on the total ion chromatogram (TIC), and based on reference compounds and the C16 internal standard the quantity estimated. Due to the amount of products produced and their limited commercial availability, four standards were run in order to calculate a response factor. Varying concentrations (0.1, 0.5, 1, 5 and 10 g l−1) were prepared for each reference compound, using the C16 internal standard (10 g l−1). The reference samples were then run on the GC–MS using the same conditions described previously. The TMS was used to derivatise hydroxyl groups present on a given molecule. The reference compounds and their derivatised versions were guaiacol, 2,6-dimethoxyphenol, 2-methoxy-4-propylphenol and 4-methyl-2,6-dimethoxyphenol. The following equation was used to calculate the response factor (α):
| α = (Intensity of reference/Intensity of internal standard) × (Mass of internal standard/Mass of reference). |
It was possible to obtain a linear relationship of intensity against mass for each reference compound and therefore calculate the resultant gradient which is equal to the response factor (α). This relationship was determined for each reference compound used and summarised in Table 1.
| Reference compound | Type of unit | Response factor (α) |
|---|---|---|
| Guaiacol | Guaiacyl (G) | 0.833 |
| 2,6-Dimethoxyphenol | Syringyl (S) | 0.737 |
| 2-Methoxy-4-propylphenol | Guaiacyl (G) | 0.860 |
| 4-Methyl-2,6-dimethoxyphenol | Syringyl (S) | 0.771 |
| Phenol | p-Hydroxyphenyl (H) | 0.95 |
From the data presented in Table 1, there was an obvious trend between the type of monomer unit, with respect to S or G, and the resultant response factor. Therefore we assumed the response factor for each of the other identified products based on their structure, with respect to H, G or S. The response factors for all other S, G and H units were deemed to be 0.75, 0.85 and 0.95 respectively.
In terms of the peaks collected through GC–MS analysis of the light fraction, 21 monomeric aromatic products were successfully identified through mass fragment data analysis for each peak based on the reference data and knowledge of the lignin structure. It was found that the reactions produced a range of alkylphenolic products with various functional groups. The absence of ring hydrogenation was confirmed through collaborative 2D NMR work,3 which showed an abundance of cross peaks in the aromatic region and no cyclohexanols were detected using GC–MS analysis. The presence of BTX molecules was also investigated but none could be found using UV-vis spectroscopy or GC-FID analysis. Selectivity, where used, is defined as S = the amount of the specified alkylphenol species/the total amount of alkylphenol detected species.
Gel permeation chromatography (GPC)
In order to determine the molecular weight distribution of each sample, 5 mg of lignin was acetylated in 0.5 ml of pyridine and 0.5 ml of acetic anhydride overnight. For the analysis of the catalytic products, equal volumes of both the light and heavy fraction (1 ml) were mixed together in order to give an overall representation of the product weight distribution. The solvents were evaporated to dryness then 0.5 ml of pyridine and 0.5 ml of acetic anhydride was added to solubilise and acetylate the products overnight. The solvents were then removed under N2 blowing and 2 ml of tetrahydrofuran (THF) was added to solubilise the products prior to injection. For calibration purposes, polystyrene standards (PS) were prepared and run and gave a line equation of y = −0.031x3 + 1.2581x2 − 17.264x + 83.146. The PS standards ranged from 474 to 28![[thin space (1/6-em)]](https://www.rsc.org/images/entities/char_2009.gif) 000 g mol−1 and were diluted in THF to a concentration of 0.5 g l−1. GPC analysis was performed on a Gilson pump system equipped with a UV detector (280 nm). A set of PS/DVB columns (5 m, 300 × 7.5 mm, 50 and 500 Å, Polymer Lab) set at 303 K was used with an injection volume of 100 μL and a THF eluent flow rate of 1 ml min−1. ChromPerfect software managed the data.
000 g mol−1 and were diluted in THF to a concentration of 0.5 g l−1. GPC analysis was performed on a Gilson pump system equipped with a UV detector (280 nm). A set of PS/DVB columns (5 m, 300 × 7.5 mm, 50 and 500 Å, Polymer Lab) set at 303 K was used with an injection volume of 100 μL and a THF eluent flow rate of 1 ml min−1. ChromPerfect software managed the data.
Results/discussion
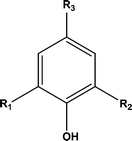
Prior to the catalytic study it was important to establish what the effects of solvent and hydrogen pressure were on lignin depolymerisation. Hence reactions were carried out under 20 barg hydrogen pressure with methanol–water as the solvent in the absence of a catalyst. Twenty one monomeric aromatic structures (see Table 2) were identified all with basic motif:| Abbreviation | R1/R2/R3 group | Product name |
|---|---|---|
| H0 | R1![[double bond, length as m-dash]](https://www.rsc.org/images/entities/char_e001.gif) R2 R2![[double bond, length as m-dash]](https://www.rsc.org/images/entities/char_e001.gif) R3 R3![[double bond, length as m-dash]](https://www.rsc.org/images/entities/char_e001.gif) H H |
Phenol |
| H1 | R1![[double bond, length as m-dash]](https://www.rsc.org/images/entities/char_e001.gif) R2 R2![[double bond, length as m-dash]](https://www.rsc.org/images/entities/char_e001.gif) H; R3 H; R3![[double bond, length as m-dash]](https://www.rsc.org/images/entities/char_e001.gif) CH3 CH3 |
4-Methylphenol (p-cresol) |
| H2 | R1![[double bond, length as m-dash]](https://www.rsc.org/images/entities/char_e001.gif) R2 R2![[double bond, length as m-dash]](https://www.rsc.org/images/entities/char_e001.gif) H; R3 H; R3![[double bond, length as m-dash]](https://www.rsc.org/images/entities/char_e001.gif) CH2CH3 CH2CH3 |
4-Ethylphenol |
| H3 | R1![[double bond, length as m-dash]](https://www.rsc.org/images/entities/char_e001.gif) R2 R2![[double bond, length as m-dash]](https://www.rsc.org/images/entities/char_e001.gif) H; R3 H; R3![[double bond, length as m-dash]](https://www.rsc.org/images/entities/char_e001.gif) CH2CH2CH3 CH2CH2CH3 |
4-Propylphenol |
| G0 | R1![[double bond, length as m-dash]](https://www.rsc.org/images/entities/char_e001.gif) R3 R3![[double bond, length as m-dash]](https://www.rsc.org/images/entities/char_e001.gif) H; R2 H; R2![[double bond, length as m-dash]](https://www.rsc.org/images/entities/char_e001.gif) OCH3 OCH3 |
2-Methoxyphenol (guaiacol) |
| G(OH)0 | R1![[double bond, length as m-dash]](https://www.rsc.org/images/entities/char_e001.gif) R3 R3![[double bond, length as m-dash]](https://www.rsc.org/images/entities/char_e001.gif) H; R2 H; R2![[double bond, length as m-dash]](https://www.rsc.org/images/entities/char_e001.gif) OH OH |
1,2-Dihydroxybenzene (catechol) |
| G1 | R1![[double bond, length as m-dash]](https://www.rsc.org/images/entities/char_e001.gif) H; R2 H; R2![[double bond, length as m-dash]](https://www.rsc.org/images/entities/char_e001.gif) OCH3; R3 OCH3; R3![[double bond, length as m-dash]](https://www.rsc.org/images/entities/char_e001.gif) CH3 CH3 |
2-Methoxy-4-methylphenol |
| G2 | R1![[double bond, length as m-dash]](https://www.rsc.org/images/entities/char_e001.gif) H; R2 H; R2![[double bond, length as m-dash]](https://www.rsc.org/images/entities/char_e001.gif) OCH3; R3 OCH3; R3![[double bond, length as m-dash]](https://www.rsc.org/images/entities/char_e001.gif) CH2CH3 CH2CH3 |
4-Ethyl-2-methoxyphenol |
| G(OH)2 | R1![[double bond, length as m-dash]](https://www.rsc.org/images/entities/char_e001.gif) H; R2 H; R2![[double bond, length as m-dash]](https://www.rsc.org/images/entities/char_e001.gif) OH; R3 OH; R3![[double bond, length as m-dash]](https://www.rsc.org/images/entities/char_e001.gif) CH2CH3 CH2CH3 |
4-Ethylbenzene-1,2-diol |
| G3 | R1![[double bond, length as m-dash]](https://www.rsc.org/images/entities/char_e001.gif) H; R2 H; R2![[double bond, length as m-dash]](https://www.rsc.org/images/entities/char_e001.gif) OCH3; R3 OCH3; R3![[double bond, length as m-dash]](https://www.rsc.org/images/entities/char_e001.gif) CH2CH2CH3 CH2CH2CH3 |
2-Methoxy-4-propylphenol |
| G3(i) | R1![[double bond, length as m-dash]](https://www.rsc.org/images/entities/char_e001.gif) H; R2 H; R2![[double bond, length as m-dash]](https://www.rsc.org/images/entities/char_e001.gif) OCH3; R3 OCH3; R3![[double bond, length as m-dash]](https://www.rsc.org/images/entities/char_e001.gif) CH CH![[double bond, length as m-dash]](https://www.rsc.org/images/entities/char_e001.gif) CHCH3 CHCH3 |
2-Methoxy-4-propenylphenol |
| G3(OMe) | R1![[double bond, length as m-dash]](https://www.rsc.org/images/entities/char_e001.gif) H; R2 H; R2![[double bond, length as m-dash]](https://www.rsc.org/images/entities/char_e001.gif) OCH3; R3 OCH3; R3![[double bond, length as m-dash]](https://www.rsc.org/images/entities/char_e001.gif) CH2CH2CH2OCH3 CH2CH2CH2OCH3 |
2-Methoxy-4-(3-methoxypropyl)phenol |
| G3(OH) | R1![[double bond, length as m-dash]](https://www.rsc.org/images/entities/char_e001.gif) H; R2 H; R2![[double bond, length as m-dash]](https://www.rsc.org/images/entities/char_e001.gif) OCH3; R3 OCH3; R3![[double bond, length as m-dash]](https://www.rsc.org/images/entities/char_e001.gif) CH2CH2CH2OH CH2CH2CH2OH |
4-(3-Hydroxypropyl)-2-methoxyphenol |
| S0 | R1![[double bond, length as m-dash]](https://www.rsc.org/images/entities/char_e001.gif) R2 R2![[double bond, length as m-dash]](https://www.rsc.org/images/entities/char_e001.gif) OCH3; R3 OCH3; R3![[double bond, length as m-dash]](https://www.rsc.org/images/entities/char_e001.gif) H H |
2,6-Dimethoxyphenol (syringol) |
| S1 | R1![[double bond, length as m-dash]](https://www.rsc.org/images/entities/char_e001.gif) R2 R2![[double bond, length as m-dash]](https://www.rsc.org/images/entities/char_e001.gif) OCH3; R3 OCH3; R3![[double bond, length as m-dash]](https://www.rsc.org/images/entities/char_e001.gif) CH3 CH3 |
2,6-Dimethoxy-4-methylphenol |
| S2 | R1![[double bond, length as m-dash]](https://www.rsc.org/images/entities/char_e001.gif) R2 R2![[double bond, length as m-dash]](https://www.rsc.org/images/entities/char_e001.gif) OCH3; R3 OCH3; R3![[double bond, length as m-dash]](https://www.rsc.org/images/entities/char_e001.gif) CH2CH3 CH2CH3 |
4-Ethyl-2,6-dimethoxyphenol |
| S3 | R1![[double bond, length as m-dash]](https://www.rsc.org/images/entities/char_e001.gif) R2 R2![[double bond, length as m-dash]](https://www.rsc.org/images/entities/char_e001.gif) OCH3; R3 OCH3; R3![[double bond, length as m-dash]](https://www.rsc.org/images/entities/char_e001.gif) CH2CH2CH3 CH2CH2CH3 |
2,6-Dimethoxy-4-propylphenol |
| S3(i) | R1![[double bond, length as m-dash]](https://www.rsc.org/images/entities/char_e001.gif) R2 R2![[double bond, length as m-dash]](https://www.rsc.org/images/entities/char_e001.gif) OCH3; R3 OCH3; R3![[double bond, length as m-dash]](https://www.rsc.org/images/entities/char_e001.gif) CH CH![[double bond, length as m-dash]](https://www.rsc.org/images/entities/char_e001.gif) CHCH3 CHCH3 |
2,6-Dimethoxy-4-propenylphenol |
| S3(OMe) | R1![[double bond, length as m-dash]](https://www.rsc.org/images/entities/char_e001.gif) R2 R2![[double bond, length as m-dash]](https://www.rsc.org/images/entities/char_e001.gif) OCH3; R3 OCH3; R3![[double bond, length as m-dash]](https://www.rsc.org/images/entities/char_e001.gif) CH2CH2CH2OCH3 CH2CH2CH2OCH3 |
2,6-dimethoxy-4-(3-methoxypropyl)phenol |
| S3(OH) | R1![[double bond, length as m-dash]](https://www.rsc.org/images/entities/char_e001.gif) R2 R2![[double bond, length as m-dash]](https://www.rsc.org/images/entities/char_e001.gif) OCH3; R3 OCH3; R3![[double bond, length as m-dash]](https://www.rsc.org/images/entities/char_e001.gif) CH2CH2CH2OH CH2CH2CH2OH |
4-(3-Hydroxypropyl)-2,6-dimethoxyphenol |
| S(OH)3(OH) | R1![[double bond, length as m-dash]](https://www.rsc.org/images/entities/char_e001.gif) OH; R2 OH; R2![[double bond, length as m-dash]](https://www.rsc.org/images/entities/char_e001.gif) OCH3; R3 OCH3; R3![[double bond, length as m-dash]](https://www.rsc.org/images/entities/char_e001.gif) CH2CH2CH2OH CH2CH2CH2OH |
5-(3-Hydroxypropyl)-3-methoxybenzene-1,2-diol |
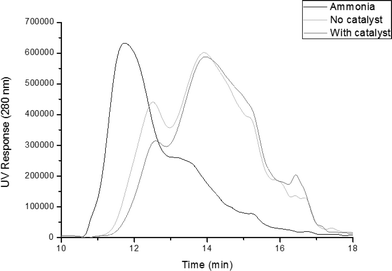
GPC profiles of the starting ammonia lignin and those obtained after reaction, with and without the Pt/alumina catalyst are shown in Fig. 1. It should be remembered that equal volumes of both the light and heavy fractions were mixed together in order to give an overall representation of the product weight distribution. It is evident from these plots that there was a clear shift to lower molecular weights from ∼11.5 min to ∼14 min. Analysis of the profiles reveals that the molecular weight of the catalytic products was 1042 Da, which is 26.8% of that calculated for the ammonia lignin (3884 Da). This is in comparison to the run without catalyst, which produced products with a molecular weight of 1304 Da. Moreover, the polydispersity of the ammonia lignin decreased from 2.45 to 1.96 and 1.75 for the tests without and with catalyst respectively. This indicates that the lignin fragment size was much more uniform than the starting lignin after both reactions. Therefore although the thermal reaction does initiate depolymerisation, the catalytic reaction is more effective.
Estimation of the amount of monomers produced by GC–MS analysis showed significant differences when the reaction was performed with and without a catalyst as shown in Fig. 2. The reaction without catalyst showed a lower overall yield of 6.8% and generated mainly phenol (H0), guaiacol (G0) and syringol (S0) with selectivities of 45%, 7% and 24% respectively. In the presence of the Pt/alumina catalyst, the yield was increased to 16.4% and, unlike the non-catalytic reaction, which promoted dealkylation, the products obtained in the catalytic test were able to maintain the alkyl chain with various functional groups attached to the terminal γ-carbon. Although there was no obvious selectivity towards one particular product, phenol (14%), syringol (11%), propylsyringol (S3) (16%) and propenylsyringol (S3i) (10%) were the main products obtained, showing a selectivity towards S-units. Indeed by implementing the use of a catalyst, the selectivity towards S-units increased from 37% to 60%, and phenol decreased from 45% to 14%. The S![[thin space (1/6-em)]](https://www.rsc.org/images/entities/char_2009.gif) :
:![[thin space (1/6-em)]](https://www.rsc.org/images/entities/char_2009.gif) G ratio for the products is 0.7
G ratio for the products is 0.7![[thin space (1/6-em)]](https://www.rsc.org/images/entities/char_2009.gif) :
:![[thin space (1/6-em)]](https://www.rsc.org/images/entities/char_2009.gif) 0.3, which is close to the S
0.3, which is close to the S![[thin space (1/6-em)]](https://www.rsc.org/images/entities/char_2009.gif) :
:![[thin space (1/6-em)]](https://www.rsc.org/images/entities/char_2009.gif) G ratio of the starting lignin as measured by thioacidolysis. Hence these results are in keeping with the conclusions of our earlier paper,3 where it was shown that the β-O-4 linkages were the ones most likely to be broken in the catalytic reaction. Nevertheless other linkages are also broken catalytically as well as thermally; the production of phenol when no H form was detected indicates that demethoxylation can take place. This is in agreement with recent publications on lignin pyrolysis5,6 that reported phenol as a major product at temperatures as low as 523 K.5
G ratio of the starting lignin as measured by thioacidolysis. Hence these results are in keeping with the conclusions of our earlier paper,3 where it was shown that the β-O-4 linkages were the ones most likely to be broken in the catalytic reaction. Nevertheless other linkages are also broken catalytically as well as thermally; the production of phenol when no H form was detected indicates that demethoxylation can take place. This is in agreement with recent publications on lignin pyrolysis5,6 that reported phenol as a major product at temperatures as low as 523 K.5
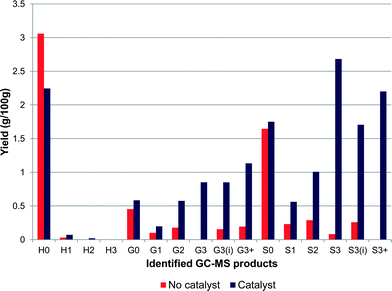 | ||
| Fig. 2 Ammonia lignin monomer yield after reaction in the presence and absence of 1 wt% Pt/alumina (yields are estimated by GC–MS analysis). | ||
Effect of stirring speed
To investigate whether film mass transfer had an effect on the reaction rate, three experiments were carried out with different stirrer speeds, while maintaining all other reaction conditions constant. The experiments were carried out at 500, 1000 and 1500 rpm and gave yields of 6.7%, 16.4% and 15.9% respectively. The larger change in monomer yield between 500 and 1000 rpm would suggest that the reaction was diffusion controlled at this point, whereas little difference between 1000 and 1500 rpm would suggest that the reaction then became kinetically controlled. Hence all reactions were performed at 1000 rpm.Effect of alumina support
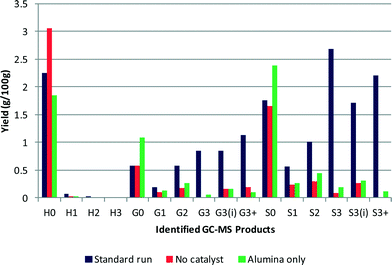
The alumina support was also tested in the absence of platinum to determine its stability and whether it had any catalytic activity. The GC–MS results are shown in Fig. 3 and reveal that the alumina support does have some catalytic activity. The overall yield of monomeric products obtained using the alumina support was slightly higher at 7.4%, than the test without catalyst, with generally more of each product produced except phenol. The molecular weight of the residual polymeric species was 1087 Da, which is similar to that for the catalyst test as was the polydispersity at 1.79.In high temperature water environments alumina supports may not be stable and can hydrate. Indeed a recent study investigated the stability of γ-alumina under aqueous phase reforming conditions using hot water and found that γ-alumina converted to hydrated boehmite at 473 K and above.7 The authors did however note that the presence of metal particles resulted in a significant decrease in the rate of boehmite formation. Furthermore, research has shown that the presence of oxygenates can enhance the stability of the support material by blocking the surface of the support with carbonaceous material thus preventing hydrolysis of the alumina.8,9 The type of oxygen functionality did not influence the stabilisation of the support and it was suggested that this meant that the different oxygenated molecules eventually formed the same surface oxygen species. It was also put forward that hydrolysis was prevented because the oxygen functionalities coordinated with the unsaturated alumina sites thus preventing the water molecules from accessing the sites. Additionally, the use of ethanol was proven to slow down the formation of boehmite crystals to some extent as well.8,9 Therefore although the alumina used in this study was θ-alumina, which may be expected to be more stable, after reaction the alumina support was analysed by XRD and BET. The diffraction pattern obtained of the support post-reaction did not differ from that obtained prior to reaction and there was no significant change in the support surface area after reaction. No boehmite reflections were observed and it was confirmed that the support had remained in the θ-phase, hence hydration had not taken place during the reaction.
Effect of hydrogen
The reaction was altered to note the effect of hydrogen by replacing the hydrogen with helium (4 barg). In the literature, aqueous-phase reforming (APR) using Pt/alumina catalysts in an inert atmosphere had been used for the production of hydrogen and alkanes from lignin samples.10 These studies showed that at temperatures of 498 K and helium pressures of 29 barg, conversions of 9.8–14.6% were achievable with four different types of lignins.10 This work was expanded using a 50/50 water/ethanol mix as a solvent,11 where higher yields were obtained. In comparison, the reactions shown here (Fig. 4), albeit at lower pressures than the literature, gave a much lower yield. The yields for the reaction with and without catalyst in helium were 5.4% and 4.8% respectively, the catalyst aided the production of alkylated products whereas in the absence of catalyst, guaiacol and syringol were favoured. From GPC the molecular weight of the residual polymer was 1370 Da for both experiments using helium. This value is much higher than that found when hydrogen is present (1042 Da). The polydispersity was also higher at 1.90 compared with 1.75 for catalyst with hydrogen. It is clear from these results that in our system the presence of hydrogen does drive the reaction to give better overall yields.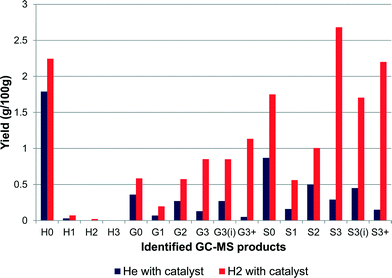 | ||
| Fig. 4 Reactions with hydrogen and with helium gas atmospheres (yields are estimated by GC–MS analysis). | ||
Effect of hydrogen pressure
The effect of hydrogen pressure on the depolymerisation reaction was studied at 0 barg, 10 barg, 20 barg and 30 barg initial pressures. The maximum pressures obtained during these tests also varied with starting pressure, with a 0 barg initial pressure the maximum pressure observed under reaction conditions was 70 barg. Whereas with a starting pressure of 30 barg a maximum pressure of 160 barg was observed. The results are shown in Fig. 5 and it can be seen that there is a clear increase in the yield of each product with increasing pressure. The yields obtained for 0 barg, 10 barg, 20 barg and 30 barg hydrogen pressures were 5.7%, 11.8%, 16.4% and 18.9% respectively. This gives an order of reaction in hydrogen of 0.4, implying a typical dissociative adsorption of hydrogen on the platinum with it being the less strongly bound reactant. Changing the mass of lignin (0.25–1 g) gave no change in the rate indicating a zero order. In the literature9 higher selectivity to ring hydrogenated products from p-cresol (a lignin model compound, delineated H1 in our code) was shown at high hydrogen pressures, which was attributed to an increase in hydrogen availability.12 However in our tests this was not observed. Although the yield from the lignin sample increased, it was not accompanied by an increase in ring hydrogenation, rather the yield of aromatics increased. This comparison between the model compound and lignin reveals the difficulty of assessing how lignin may react using a model compound system. In the model system hydrogenation and hydrodeoxygenation are the principal reactions,12 whereas with lignin other reactions such as hydrogenolysis of C–O and C–C bonds take precedence.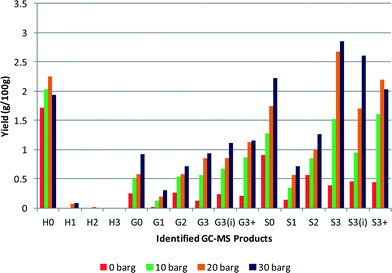 | ||
| Fig. 5 Effect of changing initial hydrogen pressure, all other conditions identical (yields are estimated by GC–MS analysis). | ||
Effect of solvent composition
In the present study a 50![[thin space (1/6-em)]](https://www.rsc.org/images/entities/char_2009.gif) :
:![[thin space (1/6-em)]](https://www.rsc.org/images/entities/char_2009.gif) 50 v/v methanol/water mixture was used for the majority of the experiments. In this section the effect of solvent composition on monomer yields is investigated. With a reaction temperature of 573 K and in the constrained volume of the reactor the methanol solvent will exceed its critical point (513 K, 78.5 bar) and form a supercritical fluid. In general, when a gas and liquid mixture are heated, thermal expansion causes the liquid to become less dense and the gas to become denser. At the critical point, these two densities become equal and they lose their distinction, which brings certain advantages such as faster mass and heat transfer, liquid-like density and dissolving power, and gas-like diffusivity and viscosity.13 Lignin has been shown to depolymerise in aqueous conditions under subcritical or supercritical conditions at relatively low temperatures (553–673 K), at 200–250 barg pressure with varying residence times and lignin–water ratios.14 At conditions close to, or at, the critical point of water (647 K, 218 bar), the use of water holds advantages such as high solubility of organic substances, low viscosity, good thermal stability and high concentration of H+ and OH−.14 Supercritical water is also known to aid reactions such as hydrolysis, which is ideal for the cracking of lignin.15,16 However the main disadvantages include the high temperatures and pressures required to obtain supercritical water (647 K, 218 bar) and problematic char production. Other studies have proposed the use of water mixed with other solvents and have shown that phenol, catechol, guaiacol, and methoxy phenols are formed from the hydrolysis of ether linkages, which can be hydrolysed further at the methoxy position.14 The aromatic ring has also proven to be stable under these conditions14 and other advantages include increased lignin solubility and the prevention of cross-linking reactions.16,17 Research has been carried out using water–acetone,18 water–phenol19 and water–ethanol20 mixtures with varying success.
50 v/v methanol/water mixture was used for the majority of the experiments. In this section the effect of solvent composition on monomer yields is investigated. With a reaction temperature of 573 K and in the constrained volume of the reactor the methanol solvent will exceed its critical point (513 K, 78.5 bar) and form a supercritical fluid. In general, when a gas and liquid mixture are heated, thermal expansion causes the liquid to become less dense and the gas to become denser. At the critical point, these two densities become equal and they lose their distinction, which brings certain advantages such as faster mass and heat transfer, liquid-like density and dissolving power, and gas-like diffusivity and viscosity.13 Lignin has been shown to depolymerise in aqueous conditions under subcritical or supercritical conditions at relatively low temperatures (553–673 K), at 200–250 barg pressure with varying residence times and lignin–water ratios.14 At conditions close to, or at, the critical point of water (647 K, 218 bar), the use of water holds advantages such as high solubility of organic substances, low viscosity, good thermal stability and high concentration of H+ and OH−.14 Supercritical water is also known to aid reactions such as hydrolysis, which is ideal for the cracking of lignin.15,16 However the main disadvantages include the high temperatures and pressures required to obtain supercritical water (647 K, 218 bar) and problematic char production. Other studies have proposed the use of water mixed with other solvents and have shown that phenol, catechol, guaiacol, and methoxy phenols are formed from the hydrolysis of ether linkages, which can be hydrolysed further at the methoxy position.14 The aromatic ring has also proven to be stable under these conditions14 and other advantages include increased lignin solubility and the prevention of cross-linking reactions.16,17 Research has been carried out using water–acetone,18 water–phenol19 and water–ethanol20 mixtures with varying success.
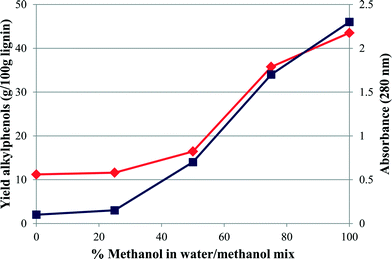
Fig. 6 and 7 show the effect on the overall yield and the specific alkylphenol yield of changing the solvent from 100% water to 100% methanol. The use of water was observed to be less effective than the methanol–water co-solvent for higher overall product yields. It is worth noting that the maximum pressure during the reaction with 100% water was 187 barg so much less than is required to produce scH2O, whereas with 100% methanol as the solvent the maximum pressure was 160 barg significantly in excess of that required to produce scCH3OH. As the methanol concentration was increased from 0 to 100%, the product yields increased from 11.2% to 43.5%.
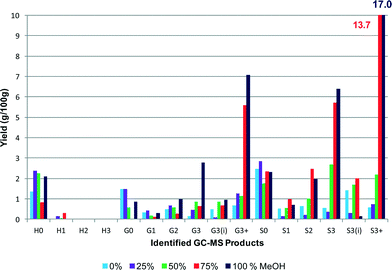 | ||
| Fig. 7 Effect of MeOH–water solvent composition on alkyl phenol yield. The yields for the S3+ monomers are shown at the top of the graph (yields are estimated by GC–MS analysis). | ||
The yield of 43.5%, which was obtained at a concentration of 100% methanol, also gave the highest selectivity towards one particular product, namely 4-(3-hydroxypropyl)-2,6-dimethoxyphenol (38%, S3(OH)), suggesting that some control over selectivity could be achieved dependent upon the nature of the starting lignin. A more detailed figure (Fig. 8) is shown separating the components of the G3+ and S3+ species. What is immediately obvious is that alkylphenols 4-(3-hydroxypropyl)-2-methoxyphenol (G3(OH)), 2,6-dimethoxy-4-propylphenol (S3) and 4-(3-hydroxypropyl)-2,6-dimethoxyphenol (S3(OH)) are highly favoured. These results indicate that by using 100% methanol, or a methanol–water mixture, condensation of the lignin was inhibited allowing greater depolymerisation. Indeed for the experiment using 100% methanol the molecular weight of the residual polymer was reduced to 918 Da, a reduction of 76% from that of the starting lignin. The reason that methanol is so effective may be due to its ability to stabilise free radicals generated during the depolymerisation by acting as a capping-agent.18 Indeed in a recent study Hensen and co-workers21 showed that supercritical ethanol acted as a capping agent resulting in a high depolymerisation yield from lignin of over 80% with no char formation. The sc-ethanol also acted as a formaldehyde scavenger, which helped minimise lignin recombination, a key aspect in minimising char.21
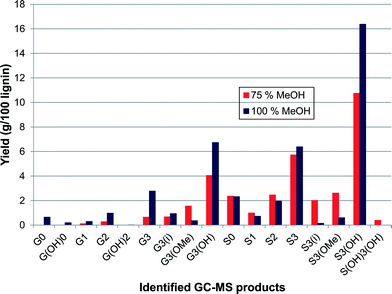 | ||
| Fig. 8 Expanded breakdown of S and G alkylphenol products obtained with 25/75% water/methanol and 100% methanol as solvents (yields are estimated by GC–MS analysis). | ||
However a simpler explanation may also be relevant, Fig. 6 also shows a measure of the solubility of lignin in the solvent mix and it can be seen that activity and solubility follow similar shaped lines. Therefore it is possible that much of the improved yield found as the methanol concentration increases is due to increased solubility of the lignin22 allowing more effective interaction with the catalyst. Indeed a similar effect was found by Minami and Saka23 when examining the effect of scMeOH on woody biomass. In that study a high water content in the scMeOH resulted in low solubility of lignin-derived products causing a reduction in yield. Pure alcohol solvents have also been examined by Song et al.24 over a nickel catalyst. In that study the solubility of the lignin in the solvents was determined to be a significant factor in their efficacy, although other factors such as hydrogen transfer were also proposed.24 Methanol has also been used as a hydrogen transfer agent.25 In a recent study a copper catalyst was used to generate hydrogen via in situ methanol decomposition and this hydrogen (and carbon monoxide) facilitated lignin depolymerisation and hydrogenation.25
Isopropanol (IPA) had been used, in conjunction with formic acid, for solvent liquefaction of lignin, in air via solvolysis.26 It was found that the highest amount of phenolics was obtained after treatment with formic acid and methanol or isopropanol, which suggested that IPA would be a suitable solvent in our process. Fig. 9 compares the product distribution obtained using methanol–water and IPA–water (50![[thin space (1/6-em)]](https://www.rsc.org/images/entities/char_2009.gif) :
:![[thin space (1/6-em)]](https://www.rsc.org/images/entities/char_2009.gif) 50 v/v). The experiment using IPA–water yielded 24.3% of monomeric products in comparison to 16.4% obtained using the standard MeOH–water mix. Although the IPA–water solvent resulted in a general improvement in yield it principally favoured the longer chain alkyl products for both G and S motifs.
50 v/v). The experiment using IPA–water yielded 24.3% of monomeric products in comparison to 16.4% obtained using the standard MeOH–water mix. Although the IPA–water solvent resulted in a general improvement in yield it principally favoured the longer chain alkyl products for both G and S motifs.
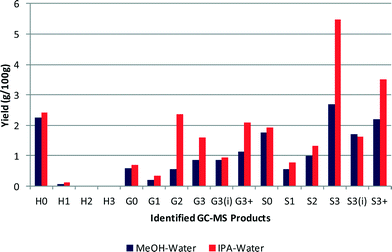 | ||
| Fig. 9 Comparison between methanol and IPA as a co-solvent with water in a 50/50 mix (yields are estimated by GC–MS analysis). | ||
Given that isopropanol has a slightly lower critical point (508 K, 54 bar) compared to methanol (513 K, 78.5 bar) IPA will have reached its critical point (maximum pressure during reaction 130 barg) thus aiding the depolymerisation reaction in a manner similar to methanol. Nevertheless IPA being a more effective solvent than methanol was slightly surprising given that it is less polar and hence would have a lower ability to dissolve lignin and solubilise water. However it is possible that some IPA underwent catalytic dehydrogenation to acetone under our standard reaction conditions to give an IPA–acetone–water mix during the reaction. Acetone is capable of dissolving the lignin and its heavier products, so such a mix would promote dissolution of the lignin and its intermediates. Moreover, IPA is also known to donate hydrogen during its dehydrogenation to acetone.
Hydrogen donor solvents (HDSs) were first used in coal liquefaction to stabilise free radicals that would otherwise form char27 so it is possible that any IPA/acetone solvent mix reduced re-polymerisation of the lignin by stabilising reactive phenols or reaction intermediates. Work comparing IPA against tetralin28 found that the IPA system showed higher selectivity to alkylated products than the tetralin system due to the higher hydrogen donor capability of IPA. The authors concluded that, in agreement with our results, HDSs were effective in converting lignin.28 However at this stage we have no evidence that transfer hydrogenation is occurring.
Effect of alternative precious metals
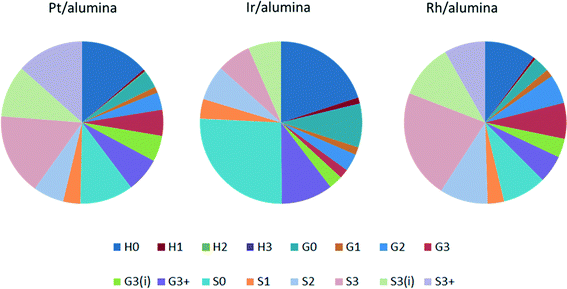
Three precious metal catalysts were tested to give an initial study on the effects of changing the active metal. The catalysts used were 1 wt% Pt/alumina, 1 wt% Ir/alumina and 1 wt% Rh/alumina. The three catalysts were compared under the same standard conditions. As shown in Fig. 10, the product distribution varied considerably with respect to the catalyst employed. The overall monomeric yields were 16.4%, 9.3% and 19.9% for the Pt-, Ir- and Rh/alumina catalysts respectively. The low monomer yield for the Ir/alumina was just slightly greater than that found for the alumina support (7.4%). Indeed the yields for H0, G0 and S0 are very similar. However a careful comparison (Fig. 10cf.Fig. 3) shows that the Ir/alumina does give higher yields for nearly all the monomers. Nevertheless this data suggests that the iridium catalyst is not particularly effective for lignin depolymerisation. The Pt and Rh catalysts gave relatively similar results but the Rh catalyst favoured cleavage at the terminal γ-group (S3), which suggests that it was more effective at cleaving alkyl–aryl bonds, which would be expected from hydrogenolysis literature where Rh is much more effective than Pt.29 With regards to the different product selectivities (Fig. 11), the platinum and rhodium catalysts show relatively similar product selectivities overall (∼61% S, 26% G and ∼13% H) with both catalysts favouring the production of S3 products. This is in comparison to the iridium catalyst, which gave a very different selectivity plot (∼50% S, ∼29% G and ∼21 H) and favoured non-alkylated products such as syringol (S0, 26%) and phenol (H0, 20%).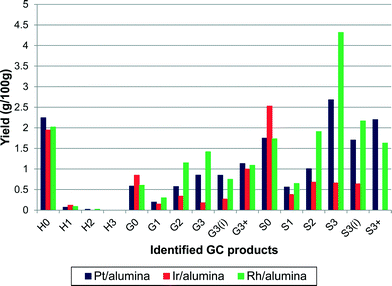 | ||
| Fig. 10 Effect of changing catalytically active metal on the yield of alkylphenols (yields are estimated by GC–MS analysis). | ||
Conclusions
In our previous paper3 it was shown that, in agreement with other studies, that a key component related to the depolymerisation of lignin is the concentration of β-O-4 linkages and that this varied dependent upon the plant source of the lignin and the pre-treatment. In this paper we have extended that work to show that the system is sensitive to hydrogen pressure and solvent. A tentative order in hydrogen of 0.4 was observed suggesting classical weak dissociative adsorption, while strong adsorption of the lignin was in keeping with the zero order of reaction. The optimum results were obtained with 100% methanol as the solvent giving a conversion of >40%. This may be due to the methanol being able to cap radical fragments and inhibit re-polymerisation. However it may also be due to an increased solubility of lignin allowing a more facile lignin/catalyst interaction. IPA/water (50/50 v/v) was also shown to be an effective solvent medium with a higher lignin conversion than methanol/water (50/50 v/v). This may be due to the formation of an IPA/acetone/water mixture under reaction conditions. The solvent effects observed in this study suggest that there is considerable potential in optimising the solvent system for lignin depolymerisation. Examining different active metals revealed a lack of activity for iridium but that on a weight basis rhodium was most effective in lignin depolymerisation. The yield of alkylphenols was enhanced with rhodium and there was some evidence that the rhodium facilitated the rupture of alkyl–aryl bonds more efficiently than platinum but this would require further study. On a molar basis platinum was the most active metal by almost a factor of two. Our results suggest that the catalytic process for the conversion of lignin to aromatic monomers is far from optimised.Acknowledgements
The research reported here was funded by BBSRC and a consortium of industry partners comprising the IBTI Club. Specifically the authors would like to acknowledge funding support from the BBSRC for FB (BB/I005528/1) and AMcV (BB/J500823/1). The authors also wish to record their thanks to Prof. K. Wilson and Mr. C. Parlett of Aston University for their help in obtaining the iridium catalyst dispersion.References
- P. Azadi, O. R. Inderwildi, R. Farnood and D. A. King, Renewable Sustainable Energy Rev., 2013, 21, 506–523 CrossRef CAS
.
-
E. Sjöström, Wood Chemistry: Fundamentals and Application, Academic Press, Orlando, 1993, p. 293 Search PubMed
.
- F. P. Bouxin, A. McVeigh, F. Tran, N. J. Westwood, M. C. Jarvis and S. D. Jackson, Green Chem., 2015, 17, 1235–1242 RSC
.
- F. P. Bouxin, M. C. Jarvis and S. D. Jackson, Bioresour. Technol., 2014, 162, 236–242 CrossRef CAS PubMed
.
- J. Kibet, L. Khachatryan and B. Dellinger, Environ. Sci. Technol., 2012, 46, 12994–13001 CrossRef CAS PubMed
.
-
R. W. Thring, E. Chornet, R. P. Overend and M. Heitz, Lignin Properties and Materials, ACS, Washington DC, 1989, pp. 228–244 Search PubMed
.
- R. M. Ravenelle, J. R. Copeland, W. Kim, J. C. Crittenden and C. Sievers, ACS Catal., 2011, 1, 552–561 CrossRef CAS
.
-
A. L. Jongerius, Catalytic conversion of lignin for the production of aromatics, in Faculty of Science, Thesis, University of Utrecht: Utrecht, Netherlands, 2013 Search PubMed
.
- R. M. Ravenelle, J. R. Copeland, A. H. V. Pelt, J. C. Crittenden and C. Sievers, Top. Catal., 2012, 55, 162–174 CrossRef CAS
.
- J. Zakzeski and B. M. Weckhuysen, ChemSusChem, 2011, 4, 369–378 CrossRef CAS PubMed
.
- J. Zakzesk, A. L. Jongerius, P. C. A. Bruijnincx and B. M. Weckhuysen, ChemSusChem, 2012, 5, 1602–1609 CrossRef PubMed
.
- H. Wan, R. V. Chaudhari and B. Subramaniam, Top. Catal., 2012, 55, 129–139 CrossRef CAS
.
- D. Wen, H. Jiang and K. Zhang, Prog. Nat. Sci., 2009, 19, 273–284 CrossRef CAS
.
- B. Joffres, D. Laurenti, N. Charon, A. Daudin, A. Quignard and C. Geantet, Oil Gas Sci. Technol., 2013, 68, 753–763 CrossRef CAS
.
- S. E. Hunter and P. E. Savage, Chem. Eng. Sci., 2004, 59, 4903–4909 CrossRef CAS
.
- S. Kang, X. Li, J. Fan and J. Chang, Renewable Sustainable Energy Rev., 2013, 27, 546–558 CrossRef CAS
.
- B. Zhang, H. J. Huang and S. Ramaswamy, Appl. Biochem. Biotechnol., 2008, 147, 119–131 CrossRef CAS PubMed
.
- R. J. A. Gosselink, W. Teunissen, J. E. G. V. Dam, E. de Jong, G. Gellerstedt, E. L. Scott and J. P. M. Sanders, Bioresour. Technol., 2012, 118, 648–651 CrossRef PubMed
.
- M. Saisu, T. Sato, M. Watanabe, T. Adschiri and K. Arai, Energy Fuels, 2003, 17, 922–928 CrossRef CAS
.
- Y. Ye, Y. Zhang, J. Fan and J. Chang, Bioresour. Technol., 2012, 118, 648–651 CrossRef CAS PubMed
.
- X. Huang, T. I. Korányi, M. D. Boot and E. J. M. Hensen, Green Chem., 2015, 17, 4941–4950 RSC
.
- Y. Ye, Y. Zhang, J. Fan and J. Chang, Ind. Eng. Chem. Res., 2012, 51, 103–110 CrossRef CAS
.
- E. Minami and S. Saka, J. Wood Sci., 2005, 51, 395–400 CrossRef CAS
.
- Q. Song, F. Wang, J. Cai, Y. Wang, J. Zhang, W. Yu and J. Xu, Energy Environ. Sci., 2013, 6, 994–1007 CAS
.
- K. Barta, T. D. Matson, M. L. Fettig, S. L. Scott, A. V. Iretskii and P. C. Ford, Green Chem., 2010, 12, 1640–1647 RSC
.
- M. Kalabova, S. Suty, T. Lauko, M. Jablonsky, A. Haz, A. Sladkova and I. Surina, in 5th International Scientific Conference Renewable Energy Sources, Slovak Republic, 2014 Search PubMed.
- N. P. Vasilakos and D. M. Austgen, Ind. Eng. Chem. Process Des. Dev., 1985, 24, 304–311 CAS
.
- K. H. Kim, R. C. Brown, M. Kieffer and X. Bai, Energy Fuels, 2014, 28, 6429–6437 CrossRef CAS
.
- J. H. Sinfelt, Catal. Rev., 1970, 3, 175–205 Search PubMed
.
| This journal is © The Royal Society of Chemistry 2016 |

