 Open Access Article
The effect of gold on modern bimetallic Au–Cu/MWCNT catalysts for the oxy-steam reforming of methanol
Pawel
Mierczynski
*a,
Krasimir
Vasilev
b,
Agnieszka
Mierczynska
c,
Waldemar
Maniukiewicz
a,
Radoslaw
Ciesielski
a,
Jacek
Rogowski
a,
Iwona M.
Szynkowska
a,
A. Yu.
Trifonov
d,
Sergey V.
Dubkov
d,
Dmitry G.
Gromov
d and
Tomasz P.
Maniecki
a
aInstitute of General and Ecological Chemistry, Lodz University of Technology, Zeromskiego 116, 90-924 Lodz, Poland. E-mail: pawel.mierczynski@p.lodz.pl; mierczyn25@wp.pl; Fax: 0048 42 631 31 28; Tel: + 48 42 631 31 24
bMawson Institute, University of South Australia, Mawson Lakes SA 5095, Adelaide, Australia
cThe Australian Wine Research Institute, Waite Precinct, Hartley Grove cnr Paratoo Road, Urrbrae (Adelaide), SA 5064, Australia
dNational Research University of Electronic Technology (MIET), pr. 4806 5, Zelenograd, Moscow, 124498 Russia
First published on 8th January 2016
Abstract
Copper and gold doped copper catalysts supported on multi-walled carbon nanotubes were prepared by wet impregnation and deposition–precipitation methods, respectively. The catalysts were tested in the oxy-steam reforming of methanol (OSRM) and characterized by XRD, SEM-EDS, TOF-SIMS, thermo-gravimetric analysis and temperature-programmed desorption of ammonia. The reactivity results showed the promotion effect of gold on the activity and selectivity of the copper catalysts in the OSRM. The formed Cu–Au alloy as an active phase was responsible for the activity and selectivity improvement of the bimetallic catalysts in the oxy-steam reforming of methanol. The formation of an Au–Cu alloy was confirmed by the XRD, TOF-SIMS and SEM-EDS techniques. The reducibility and acidity of the tested catalysts are important factors, which influence the activity of the copper and gold–copper catalysts.
Introduction
Hydrogen fuel cells enable the generation of electric energy in an ecologically clean way. The use of fuel cells instead of the traditional methods could reduce carbon dioxide emissions by 40%–60% and nitrogen oxide emissions by 50%–90%, which is expected to have a significant impact on the environment. Hydrogen is also an ideal fuel for every means of transport (cars, railways, ships and space ships) because it is utilized without environmental contamination and the only waste product is water.An attractive solution to problems associated with storing molecular hydrogen involves the catalytic production of hydrogen from a high-energy liquid fuel such as methanol.1
Hydrogen can be synthesized as a result of the catalytic reforming of methanol, partial oxidation of methanol or oxy-steam reforming of methanol. The thermodynamics of the partial oxidation and steam reforming of methanol suggests that the most energetically favourable solution is a combination of these two reactions in one process. Heat accompanying the oxy-steam reforming of methanol is sufficient to run this autothermal reaction, which enables utilization in applications (e.g. fuel cells) and improves the economics of the hydrogen fusion process.2 Depending on the reagent stoichiometry, the reactions take place according to the following equations: oxidation of methanol:
| CH3OH + 0.25 O2 ↔ 0.5 CO2 + 0.5 CO + 2H2 ΔH ° = − 50.8 kJ mol−1 |
| CH3OH + H2O ↔ CO2 + 3H2 ΔH° = 49.7 kJ mol−1 |
| CH3OH + 0.25 O2 + 0.5 H2O ↔ CO2 + 2.5 H2 ΔH° = − 71.4 kJ mol−1 |
The typical catalysts used in the reforming of methanol are Cu, Ni, Co, Fe, Pd, Pt, Ru, Au, Ir, and Ag supported on mono-Al2O3, ZnO, CeO2, MgO, La2O3, SiO2,4–8 and binary oxides such as ZnO–Al2O3, CeO2–ZrO2, SiO2–SnO2, and Al2O3–CeO2.7–10 These catalytic systems are prepared using different methods including microemulsion,11 aerogel,12 coprecipitation,13 sol–gel,14 impregnation15 and combustion synthesis. The most common catalysts used for the methanol reforming reaction are the copper supported catalysts. High values of copper dispersion, metal surface area, along with a small particle size, are the targets to attain highly active catalysts. Numerous published reports deal with the addition of promoters10,16–19 and the influence of the preparation method2,13,20,21 on the catalytic properties of the copper supported catalysts are examined. Despite the high activity and selectivity of copper catalysts such as CuO/ZnO, CuO/ZnO/Al2O3 in the methanol oxidation reaction, there are still ongoing issues concerned with their yield, selectivity and enhancement of their stability.22
In the past decades there has been increased interest in catalysts supported on gold. This is mainly based on the pioneering report of Haruta et al. which showed the high activity of gold nanoparticles supported on TiO2 or Fe2O3 oxides in the oxidation reaction of carbon monoxide carried out at low temperature.23 Since then, gold supported catalysts have been tested in a number of chemical processes such as the low temperature conversion of methane with water vapour, conversion of carbon monoxide with water vapour (WGS),24 hydrogenation and dehydrogenation reactions,24–27 oxidation of CO,28 selective oxidation of hydrocarbons29,30 and selective oxidation of alcohols and aldehydes in fuel cell technology and in pollution control.
Furthermore, we decided to promote the copper catalysts supported on MWCNTs by gold because of its well-known CO oxidation activity.31 The literature data regarding the reforming of methanol have confirmed the high activity of gold catalysts and they have shown a low selectivity towards the formation of carbon monoxide.32–35
Bimetallic Au–Cu catalysts have shown high activity in various reactions due to the alloy formed, which is the active phase compared to the individual Au and Cu catalysts. The classification of the Au–Cu alloy depends strongly on the origin of the CuO species which could be highly dispersed, bulky types and/or on the oxidation states of the Cu species (Cu2+, Cu+, and Cu0).32
While there are a handful of publications concerned with Cu/CNT36,37 catalysts in the steam reforming of methanol, there are no published papers that report the role of bimetallic Au–Cu/CNT catalysts in hydrogen production.
To fill this gap, we investigate the potential of bimetallic Au–Cu catalysts deposited on carbon nanotubes in the oxy-steam reforming of methanol. The selection of the active phase components for the catalysts used in this work (Cu, Au) was based on their reactivity, both in relation to hydrogen, as well as carbon monoxide (unwanted reaction product). The well-known copper catalysts supported on a metal oxide are highly active in the reforming of methanol reaction.22,38 However, copper catalysts do not exhibit satisfactory selectivity and stability in the methanol reforming reaction. One way to increase the selectivity and stability of the catalyst system is by the promotion of a copper catalyst by introduction of a small amount of a noble metal. The ideal promoter which increases the activity, selectivity and stability in many catalytic processes is gold as evidenced by the number of reports in the literature concerning gold catalysts.24,26,30,32,39–46
The main advantages of using carbon nanotubes (CNTs) as a catalyst support are their high purity, high thermal and mechanical stability, occurrence of specific interaction on the support–metal boundary, adsorption of catalytically active nanoparticles on the external wall of CNTs, and the CNT electron structure. CNTs with good conductivity are also proposed to promote the spillover effect. Additionally, the possibility of introducing functional groups into the surface of the carbon nanotubes allows tuning the sorption properties of the resulting nanomaterial. All these features of carbon nanotubes have a huge impact on the activity and selectivity of catalysts supported on CNTs.47–53 The choice of carrier material has been dictated by the special properties of carbon nanotubes which could provide an ideal material for electrodes used in fuel cell technology. In addition, this work proved that gold–copper catalysts supported on multi-walled carbon nanotubes (MWCNTs) allow to achieve a high yield of hydrogen production in parallel with a high content of carbon monoxide in the reaction product. Carbon monoxide can be oxidized in the next step to carbon dioxide, which makes these catalytic systems possible for use in fuel cell technology. The high activity of such systems can lead to the replacement of platinum electrodes since they exhibit superior activity in the presence of a high content of carbon monoxide in a product mixture.
The specific aims of this work are to determine the effect of gold on the physicochemical properties and catalytic reactivity of copper supported catalysts in the oxy-steam reforming of methanol and to correlate the physicochemical properties of the prepared systems with their catalytic activity in the oxy-steam reforming of methanol. The monometallic copper and bimetallic Au–Cu/MWCNT supported catalysts were prepared by a wet aqueous impregnation method and a deposition–precipitation method, respectively. Their physicochemical properties were investigated using thermo-gravimetric analysis (TG), X-ray diffraction (XRD), temperature-programmed reduction (TPR-H2), TOF-SIMS, SEM-EDS and temperature-programmed desorption of ammonia (TPD-NH3) methods. Catalytic activity tests in the oxy-steam reforming of methanol were carried out using a fixed bed quartz microreactor under atmospheric pressure in the temperature range of 200–300 °C.
Experimental
Preparation of catalysts
In the first stage of the preparation of the bimetallic supported catalysts, an aqueous solution of chloroauric acid was added into the solution containing the suspended Cu/MWCNT catalyst which was calcined in an air atmosphere at 350 °C for 4 h. The resulting solution was stirred at 65 °C. In the next step, urea was used to achieve a pH value of 8. The gold loading on the catalyst was 1 wt%. After aging for two hours, the precipitate was filtered and washed with hot water until no chloride ions were detected using a 0.1 M AgNO3 solution. Then, the resulting precipitate was dried overnight in air at 80 °C, and afterwards it was calcined at 180 °C for 4 h in an air atmosphere. The copper and gold or nickel and gold loadings were 20 wt% and 0.5, 1, 5 wt%, respectively.
Characterization of the catalysts
XRD “in situ” measurements
Approximately 150 mg of the sample, which had been ground in an agate mortar, was packed in a glass ceramic (Macor) sample holder. The gas mixture 5% H2–95% Ar was used as a reducing reagent for the 5% Au–20% Cu/MWCNT catalyst. The sample was heated at a nominal rate of 2 °C min−1. The high-temperature wide-angle X-ray diffraction data were collected using a PANalytical X'Pert Pro diffractometer equipped with an Anton Paar XRK900 reactor chamber, using every 50 °C interval starting from 50 °C and ending at 800 °C. A PANalytical X'Celerator detector based on Real Time Multiple Strip technology capable of simultaneously measuring the intensities in the 2θ range of 10–90° was used.2.3 Catalytic activity tests
The oxy-steam reforming of methanol (OSRM) was performed using a flow quartz reactor under atmospheric pressure. The reaction was carried out at two temperatures, 200 and 300 °C, respectively. HPLC grade methanol (Aldrich, water ∼0.03 wt%) was used. The catalyst loading was 0.1 g and the stream composition was: H2O/CH3OH/O2 = 1/1/0.4 (molar ratio) and the GHSV was 26 700 h−1 (calculated at ambient temperature and under atmospheric pressure). The total flowrate was kept at 31.5 ml min−1 and the Ar was used as the balance gas (the methanol content in the reaction mixture was 6%). All the catalysts before the activity test were reduced “in situ” at 300 °C in a mixture of 5% H2–95% Ar for 1 h. The steady-state activity measurements at each temperature were taken after at least 2 h in the stream. The analysis of the reaction organic products (methanol, methane, methyl formate, dimethyl ether (DME), and formaldehyde) was carried out by using an on-line gas chromatograph equipped with an FID and a 10% Carbowax 1500 on a Graphpac column. The CO, CH4 and CO2 concentrations were monitored by a GC chromatograph equipped with a TCD (150 °C, 60 mA) and a Carbosphere 60/80 (50 °C) column. The hydrogen concentration was measured by a GC chromatograph equipped with a TCD (120 °C, 60 mA) and a Molecular Sieve 5a (120 °C) column. The material balances on carbon were calculated to verify the obtained results. The selectivity towards the formation of hydrogen, carbon monoxide or carbon dioxide in the OSRM was calculated using eqn (1),22(2), and (3) and the conversion of methanol using eqn (4):22 | (1) |
 | (2) |
 | (3) |
where, nCH3OH and nH2 are the molar flow rates of CH3OH and H2, respectively.
 | (4) |
where:
| nH2−out − the molar flow rate of the H2 feed out, |
| nCO2−out − the molar flow rate of the CO2 feed out, |
| nCOout − the molar flow rate of the CO feed out, |
| nDMEout − the molar flow rate of the DME feed out, |
| n1inCH3OH, n2outCH3OH − the molar flow rates of the CH3OH feed in and feed out, respectively. |
3. Results and discussion
3.1 Thermo-gravimetric TG analysis
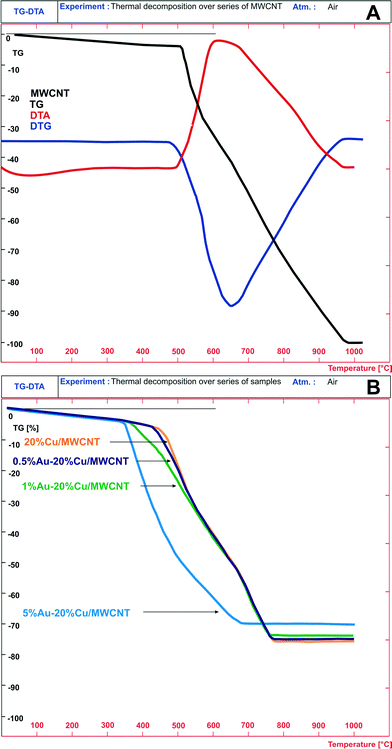
The influence of copper and/or gold on the thermal decomposition of the MWCNTs was investigated by the thermal decomposition studies. The results from the TG analysis carried out in the temperature range of 25–1000 °C for the multi-walled carbon nanotubes, mono and bimetallic supported catalysts are given in Fig. 1. The thermal decomposition process of the MWCNTs starts at 520 °C and ends at 980 °C. The decomposition process proceeds in two steps: the first step is associated with water and impurity removal and takes place in the temperature range of 30–200 °C. This is evident in the changes in the TG and DTG curves associated with the endothermic DTA peak situated in the temperature range of 30–200 °C. The second step is related to the oxidation of the multi-walled carbon nanotubes directly to carbon dioxide as evident in the DTA curve in the temperature range of 520–980 °C. Mosquera et al.55 studied the CNT purity based on thermo-gravimetric analysis (TGA) of an ‘as grown’ sample from room temperature to 800 °C at 10 °C min−1. The TG results showed that an initial weight loss of around 0.20–0.25% in the temperature range of 60–100 °C was due to the removal of the volatile organic impurities while the thermal degradation of the CNTs began in the temperature range of 567–689 °C (depending on the synthesis conditions) and was completed around 800 °C. The TGA weight loss confirmed the 96% purity of the investigated nanomaterial. Mosquera et al.55 have also found that the presence of impurities, e.g. metal, has a significant influence on the thermal stability. A high temperature oxidation of CNTs indicates a low degree of graphitisation, and the presence of many defects and disorder.The thermal analysis of the copper catalysts also showed the decomposition of the Cu/MWCNT to be a two-stage process. The differences in the thermal decomposition studies between the multi-walled carbon nanotubes and the monometallic copper catalysts were the starting and ending decomposition temperatures observed for these two samples. The oxidation of the multi-walled carbon nanotubes in the case of the 20% Cu/MWCNT supported catalyst took place in the temperature range of 470–760 °C, whereas for the bare MWCNTs this process is in the 520–980 °C temperature range. The promotion of the monometallic copper supported catalysts by gold resulted in a further decrease of the initial oxidation temperature of the nanomaterial. The higher the gold loading level was, the lower was the decomposition temperature of the oxidation process of the carbon nanotubes. For the catalyst containing 0.5% wt gold, the initial oxidation temperature was 420 °C, whereas for the catalysts with a higher gold content of 1 and 5% wt, the temperature increased to 370 and 350 °C, respectively. No significant promotion effect of gold addition on the monometallic copper supported catalysts on the final decomposition temperature was observed, for which the final temperature of decomposition was 760 °C. The only exception was the final decomposition temperature recorded for the catalyst with the highest gold content (5% wt Au), which reached 690 °C. The TG, DTG and DTA data for all the investigated catalytic systems confirmed the obtained results.
3.2. The effect of gold on the reduction behavior of the Cu/MWCNT catalysts
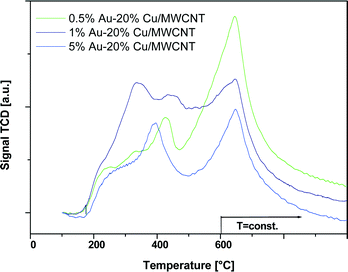
The H2-TPR technique was used to illustrate the reducible properties of the mono- and bimetallic catalysts supported on the multi-walled carbon nanotubes and the results are given in Fig. 2.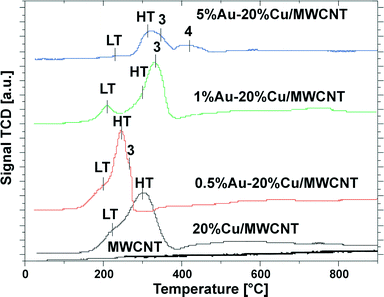 | ||
| Fig. 2 TPR profile of the pristine MWCNTs, the monometallic copper catalyst after calcination in air for 4 h at 350 °C and the bimetallic Au–Cu catalysts after calcination in air for 4 h at 180 °C. | ||
While the reduction of the carbon nanotubes showed that the nanomaterial itself is irreducible in the investigated temperature range, the TPR profile of the Cu/αAl2O3 system (prepared by an impregnation method and calcined at 400 °C) demonstrated that the incorporated copper oxide is reduced in a single reduction stage situated at 250–350 °C.
In the next stage of the reduction studies, we carried out the reduction of the 20% Cu catalysts supported on MWCNTs. The results showed two unresolved reduction profiles visible in the temperature range of 150–380 °C attributed to the two-step reduction of the copper(II) oxide via the intermediate Cu2O (named the LT-peak (220 °C) and the HT-peak (300 °C), accordingly). Additionally, the third wide high temperature desorption stage, seen in the TPR profile in the temperature range of 390–800 °C, is assigned to the methanation process of the MWCNTs.56,57
Mahata et al.58 also investigated the reduction behavior of a copper catalyst supported on MWCNTs. The authors observed a single reduction peak in the temperature range of 180–375 °C, with the maximum of the hydrogen consumption peak situated at 250 °C.
The reduction of the CuO/CNT catalysts was studied by Song et al.59 using the H2-TPR technique. The authors observed only one reduction stage coming from the reduction of the CuO species in the range of 100–300 °C and did not observe any peak corresponding to the reduction of pristine CNTs. Furthermore, their results suggested that the reduction temperature of the CuO nanoparticles has a strong dependence on the defect density of the CNT material. They claimed also that the defects might promote electron transfer during the reduction process which destabilizes the bonds between copper and oxygen and thereby facilitates the reduction of CuO to metallic Cu.
The reduction behavior of copper catalysts supported on CNT was also investigated by Groβmann et al.60 The authors observed one reduction effect on the TPR profile, which is connected with the reduction of CuO to metallic copper with the maximum of the hydrogen consumption peak situated at 176 °C. The shape of the TPR profile with a small shoulder at low temperatures pointed out the presence of two copper oxide particle sizes on the catalyst surface.
Introduction of 0.5% wt gold into the monometallic copper supported catalyst caused a shift of the reduction effect to the lower temperature region, which confirms that the addition of gold facilitates the reduction of the copper oxide species.61 The TPR-H2 profile recorded for 0.5% Au–20% Cu/MWCNT showed four partially resolved reduction peaks associated with the reduction of the catalytic material and the methanation process of the carbon nanotubes. The first peak (LT-peak) with the maximum of the hydrogen consumption peak at 205 °C is assigned to the CuO to Cu2O reduction. The second visible peak with the maximum of the hydrogen consumption situated at 245 °C (HT-peak) is associated with the reduction of Cu2O to metallic copper. The third faintly resolved reduction peak with the maximum of the hydrogen consumption at 265 °C is attributed to the reduction of the copper oxychloride species (Cu2(OH)3Cl). The last wide peak located in the high temperature range of 360–800 °C is assigned to the methanation process of the MWCNTs.
Copper(II) oxide reduction as a result of gold promotion is explained in published reports by the spillover phenomenon between copper oxide and metallic gold.61–64 The shifts of the low temperature reduction stage towards lower temperatures in the TPR-H2 profile of the AuCu/TiO2 catalyst were also observed by Chimentão et al.65 This was explained by the electronic interaction between the Au and Cu atoms. An electron transfer from copper to metallic gold results in a lower reduction temperature of the observed TPR-H2 peak. In resonance with our studies, an alloy formation was confirmed using the XRD, XPS and transmission microscopy techniques. They have found that the alloy particle size decreases with an increase in the copper content in the catalyst system.
The confirmation of the alloying process which takes place between gold and copper is the shift of the observed effects associated with the copper oxide species reduction in the case of the bimetallic catalyst towards the lower temperature range in comparison to the effects observed for the monometallic copper catalyst. The same behavior was observed in the case of the 0.5% Au–20% Cu/MWCNT catalysts. In addition, in the case of the 0.5% Au–20% Cu/MWCNT catalyst the high temperature effect located in temperature range of 390–800 °C was visible in the TPR-H2 profile. The effect is also attributed to the same effect observed for the monometallic copper catalyst56 and it can be also associated with the desorption of the hydrogen chloride from the carbon material.57
The same spillover effect was postulated for the bimetallic Cu–Ni/ZrO2 catalyst64 based on the shift of the observed low temperature reduction peak towards lower temperatures. In addition, this shift has suggested the reduction of the adjacent Cu and Ni atoms, which leads to the bimetallic phase. The formation of the bimetallic CuNi particles was detected by the HREM-TEM-EDX technique.
Pongstabodee et al.66 studied the reduction properties of the monometallic Au and Cu and bimetallic Au–Cu catalysts supported on CeO2. The authors have found that Au facilitated copper oxide reduction and caused a shift of the reduction peaks to a lower temperature range. They also claimed that the Au/CuO–CeO2 catalysts are reduced in two steps. CuO is firstly reduced to Cu+ at low temperature and then Cu+ is reduced to metallic copper.
Similar findings were postulated by Yang et al.67 who also studied the reduction behavior of copper, gold and gold–copper catalysts supported on zinc oxide. The results showed that the TPR-H2 profile recorded for the gold supported catalyst did not show any reduction stage. This indicated that gold was present only in a metallic state after calcination at 573 K or the gold oxide crystallite size was too small to be detected by XRD. The reduction pattern of the copper catalyst supported on ZnO showed three reduction stages: a major peak situated at about 500 K and two smaller shoulders located at 460 and 525 K, respectively. The major peak was assigned to the reduction of CuO to metallic copper, while the shoulder at 460 K was attributed to the CuO to Cu+ reduction stage and the high temperature shoulder was assigned to the reduction of the Cu+ species to Cu0.68,69 On the other hand, the TPR-H2 profile of the Au/CuO/ZnO sample showed two unresolved reduction peaks at 486 and 500 K which were assigned to the two step reduction (Cu(II)→Cu(I)→Cu(0)). It is worth to note that the reduction stage of CuO in the Au/CuO/ZnO catalyst was shifted to a lower temperature compared with the CuO/ZnO catalyst. This result confirmed that Au promotes CuO reduction. The enhanced reducibility of CuO in the case of the catalyst promoted by Au is explained by the weak Cu–O bond due to the metallic gold. The authors suggested that there is some sort of interaction between metallic gold and copper(II) oxide in the case of the Au/CuO/ZnO system.
The reduction profile of the 1% Au–20% Cu/MWCNT catalyst shows four effects. The first three of these are associated with the reduction of the copper containing species. The first reduction stage with the maximum of the hydrogen consumption peak located at about 210 °C is assigned to the reduction of CuO to Cu2O. The second profile situated at 300 °C is attributed to the Cu2O species reduction, while the third reduction peak with the maximum of the hydrogen consumption located at 330 °C is assigned to the copper oxychloride species (Cu2(OH)3Cl) reduction. The precise description of the third step of the reduction was given in our previous work.57 The last wide peak visible on the TPR curve located in the temperature range of 390–800 °C is assigned to the carbon nanotube methanation process56 and it can be also associated with the desorption of the hydrogen chloride from the carbon material.57
Increasing the gold content to 5% wt has caused changes in the reduction behavior of the bimetallic Au–Cu catalyst. The formation of the four reduction stages in the TPR profile of this catalyst was observed. The first wide reduction stage visible in the temperature range of 180–280 °C is assigned to the CuO reduction. The second reduction peak with the maximum of the hydrogen consumption peak located at 325 °C is attributed to the Cu2O species reduction. The third reduction effect with the maximum of the hydrogen consumption peak located at about 350 °C is assigned to the copper(II) oxychloride species reduction.57 Lastly, the fourth reduction stage is attributed to the copper(II) chloride reduction. Also, in the case of the 5% Au–20% Cu/MWCNT system the fifth effect was visible in the TPR-H2 profile. This effect was associated with both the methanation process of the MWCNTs and the desorption of hydrogen chloride from the carbon material.57
The temperature-programmed reduction (H2-TPR) data for both the monometallic copper and bimetallic Au–Cu/MWCNT supported catalysts are given in Table 1. The temperature maxima and the contribution of each peak to the overall TPR peak area are also presented in this table. From the data presented in the table, it is easy to observe that the copper catalyst promoted by the lowest gold content is reduced at the lowest temperature range compared to the other systems. The low temperature reduction peaks gave evidence that from these copper oxide species: 1. metallic copper crystallites on the support surface during the activation process and 2. an alloy phase are created. This reduction behavior has a strong influence on the methanol conversion and selectivity results in the oxy-steam reforming of methanol reaction. It is well-known that copper catalysts with high Cu dispersion exhibit high activity in the reforming of methanol reaction.4 It is also worth mentioning that an increase of the gold content in the copper supported catalyst caused the shift of the observed reduction effects to the higher temperature range. Additionally, in the case of the catalyst with the highest gold content, the occurrence of additional reduction stages connected with copper(II) oxychlorides and copper(II) chloride was observed at high temperature. It should be also emphasized that for all the studied catalyst systems the high temperature effect connected with the methanation process of the multi-walled carbon nanotubes was observed. Furthermore, in the case of the bimetallic Au–Cu supported catalysts, the observed high temperature effect can be also associated with the desorption of hydrogen chloride from the carbon material.
| Catalysts | Peak contribution to the overall TPR peak area (%) | |||
|---|---|---|---|---|
| LT-peak (Tmax1 = [°C]) | HT-peak (Tmax2 = [°C]) | Peak 3 (Tmax3 = [°C]) | Peak 4 (Tmax4 = [°C]) | |
| 20% Cu/MWCNT | 32.5 (220) | 67.5 (300) | — | — |
| 0.5% Au–20% Cu/MWCNT | 19.9 (205) | 47.8 (245) | 32.3 (265) | — |
| 1% Au–20% Cu/MWCNT | 17.1 (210) | 31.7 (300) | 51.2 (330) | — |
| 5% Au–20% Cu/MWCNT | 0.6 (230) | 44.7 (325) | 16.3 (350) | 38.4 (430) |
The reduction of bimetallic 3 wt% Au–Cu/CeO2–ZrO2 catalysts with various Au/Cu atomic ratios was studied by Pojanavaraphan et al.32 who also observed the alloying process.
3.3. Phase composition studies of the bimetallic catalysts
To study the interactions between the active phase components and the support, the phase composition of the 5% Au–20% Cu/MWCNT (calcined, after reduction in a mixture of 5% H2–95% Ar at 300 °C and the reaction) catalyst was investigated by the XRD technique. The results are given in Fig. 3. On the XRD diffractogram recorded for the bimetallic Au–Cu catalyst calcined at 180 °C, only a graphite-like phase corresponding to the MWCNTs, metallic gold and copper oxide phases was detected.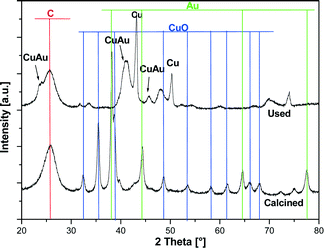 | ||
| Fig. 3 XRD patterns of the calcined and used (after reduction at 300 °C in a mixture of 5% H2–95% Ar and the reaction) bimetallic 5% Au–20% Cu/MWCNT catalysts. | ||
Yang et al.36 studied the phase composition of reduced Cu/ZnO–CNT catalysts. Their XRD analysis showed diffraction peaks associated with CNT, Cu, CuO and ZnO in the XRD pattern. The CuO phase was visible in the diffraction curve because a portion of the metallic copper had been oxidized by oxygen in the air. Groβmann et al.60 studied the phase composition of Cu/CNT catalysts and observed reflections coming from the monoclinic copper(II) oxide and a graphite-like phase, which is in agreement with our findings.
The phase composition results of the 5% Au–20% Cu/MWCNT catalyst after reduction at 300 °C in a reducing mixture of 5% H2–95% Ar and the reaction are given also in Fig. 3. We observed that during the reduction process, an alloying process occurs. A confirmation of an alloying process between Au and Cu is the lack of diffraction peaks originating from the metallic gold phase in the case of catalysts containing 5 wt% gold. This finding was confirmed by the “in situ” XRD, TOF-SIMS and SEM-EDS results (see the next paragraphs).
To confirm the formation of an alloy between gold and copper, “in situ” XRD measurements were carried out. The temperature-programmed “in situ” XRD reduction measurements for the bimetallic 5% Au–20% Cu/MWCNT catalyst were carried out in a gas mixture of 5% H2–95% Ar and the results are given in Fig. 4. The diffraction curves were collected in the temperature range from 50 to 800 °C. The phase composition analysis of the catalyst reduced at 50 °C confirmed the presence of the following crystallographic phases: Au, CuO and graphite-like phases. The XRD curve of the 5% Au–20% Cu/MWCNT system recorded at 200 °C showed in addition to the observed CuO, the diffraction peaks of the metallic gold and graphite-like phases positioned at 2theta = 36.42 and 42.30° assigned to the Cu2O phase. The occurrence of these peaks confirmed the reduction mechanism of the CuO (CuO → Cu2O → Cu) species through the intermediate Cu2O. In order to better visualize the changes in the phase composition during the reduction of the 5% Au–20% Cu/MWCNT system, a fragment of the diffraction data collected in the 2theta angle = 35–45° in the temperature range of 50–600 C is shown in Fig. 4B. The diffraction curve recorded for the studied system showed clearly at 200 °C (see Fig. 4B) the appearance of the diffraction peaks of the Cu2O phase. Increasing the reduction temperature up to 250 °C resulted in the appearance of the metallic phases of copper and gold in addition to the graphite-like structure. Further raising the temperature of the reduction up to 300 °C and higher causes an alloy Au–Cu formation.65,70 Additionally, an increase of the reduction temperature above 250 °C causes an increase in the intensity of the diffraction peaks assigned to the metallic gold and metallic copper phases. The evidence of the solid solution formation is the shift of the main diffraction peak of Cu (111) (2theta = 43.30°) with an increase of the reduction temperature from 250 to 800 °C towards the lower values of the 2theta angle, which means that the unit cell increases as a result of the Au–Cu alloy formation. This is due to the fact that gold has a larger atomic radius than copper.24 Additionally, the shift of the Au peak (111) (2theta = 38.34°) was also observed towards the lower values of the 2theta angle. Similar results of the phase composition studies of bimetallic Au–Cu catalysts supported on a CeO2–ZrO2 mixed oxide prepared by the deposition–precipitation method were obtained by using XRD methods by Pojanavaraphan et al.32
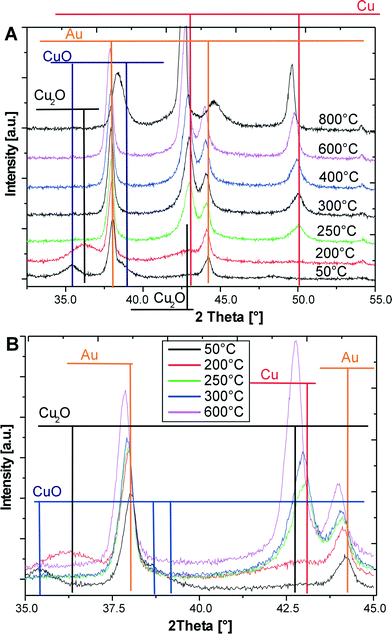 | ||
| Fig. 4 XRD patterns collected for the bimetallic 5% Au–20% Cu/MWCNT catalyst during reduction in the temperature range of 50–800 °C in a mixture of 5% H2–95% Ar. | ||
The authors reported that the Au (111) diffraction peak observed on the diffraction pattern recorded for the Au/CeO2–ZrO2 catalysts was shifted towards the lower values of the 2theta angle from 38.34° to 38.17° in the presence of Cu loading. Additionally, this diffraction peak becomes broader in the case of the catalyst with a high copper loading. The authors associated the shift of the diffraction peak of the metallic copper phase with the formation of the Au–Cu alloy particles.
The application of copper–gold nanoparticles as a catalytic material was reported in ref. 71. The structure and behavior of the AuCu catalyst depend strongly on the preparation method. In the case of the catalyst prepared by a co-impregnation method reduced for 2 h in flowing hydrogen at 315 °C, electron X-ray absorption fine structure spectroscopy (EXAFS) detected a degree of mixing between copper and gold. In contrast, the XRD results confirmed the migration of gold towards the core. Such core–shell structures were found in the case of the bimetallic alloy. The authors also reported that the copper–gold catalysts were more selective in acrolein synthesis from propene.
AuCu/TiO2 alloy catalysts prepared by co-impregnation in the gas-phase epoxidation of propene by N2O were also studied.65 In these catalytic systems precise investigations performed by using XRD, XPS and transmission electron microscopy confirmed an AuCu alloy formation and a lattice parameter changing linearly with the CuAu ratio. They have found that the size of the alloy particle decreases together with the increase of the copper content in the investigated system.
Belin et al.72 also studied the phase composition of CuAu/SiO2 catalysts reduced in an H2 atmosphere at 315 °C for 2 h prepared by an impregnation method for the selective oxidation of propene to acrolein. The authors reported that the reduction process causes the strong interaction between Cu and Au. The XRD analysis of the bimetallic Au–Cu catalysts confirmed AuCu species formation. The EXAFS results indicated copper–copper, copper–oxygen, copper–gold and gold–gold interactions. In addition, TEM measurements confirmed the inhomogeneous state of the catalyst surface. The catalytic activity of this system in the selective oxidation of propene to acrolein demonstrated a poor catalytic activity confirmed by a mixture of products obtained during the reaction. This mixture of products confirmed various active sites, which are present on the catalyst surface.
In our previous work,24 we have done measurements for the Au–Cu reference material, similar to the supported Au–Cu/MWCNT catalyst weight ratio Au/Cu = 1![[thin space (1/6-em)]](https://www.rsc.org/images/entities/char_2009.gif) :
:![[thin space (1/6-em)]](https://www.rsc.org/images/entities/char_2009.gif) 4 wt%. During the reduction process carried out for this reference material, we also observed the alloy formation, which takes place from 300 °C, which further confirms our results.
4 wt%. During the reduction process carried out for this reference material, we also observed the alloy formation, which takes place from 300 °C, which further confirms our results.
In the next step of the XRD studies, the composition of the AuCu alloy was calculated according to Vegard's law.73,74 The resulting Au–Cu alloy is a solid solution with a cubic structure and therefore a linear combination of lattice spacing of the individual metal components and their mole fraction is given by the equation:
| aCuAu = XAuaAu + (1 − XAu)aCu |
![[3 with combining macron]](https://www.rsc.org/images/entities/char_0033_0304.gif) m.
m.
| T [°C] | a CuAu [Å] | x Au [%] |
|---|---|---|
| a Cu = 36 150 [Å] PDF 004–0836, aAu = 40 786 [Å] PDF 004–0784. | ||
| 250 | 3 615 | 0 |
| 800 | 3 652 | 7.98% |
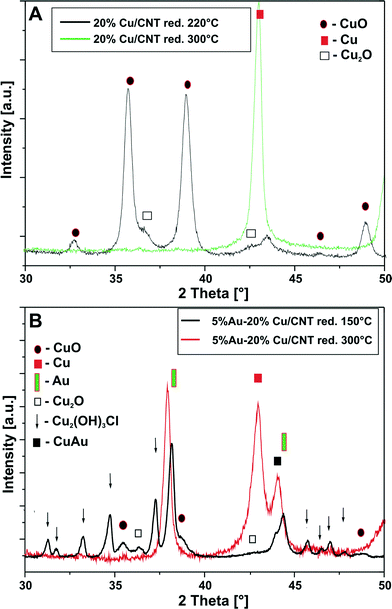
To confirm the reduction mechanism of the Cu and Au–Cu catalysts, additional XRD measurements for the reduced catalysts were carried out and the results are shown in Fig. 5. A fragment of the diffraction data collected in the 2theta angle = 30–50° at a temperature of 220 and 300 °C for the monometallic copper catalyst is shown in Fig. 5A. The diffraction curve of the Cu/MWCNT system reduced at 220 °C showed only CuO and Cu2O diffraction peaks, while the XRD diffraction curve of the monometallic copper catalyst reduced at 300 °C shows a diffraction peak that stem from the metallic copper phase. These results support the two-step reduction mechanism of CuO to metallic copper through a Cu2O intermediate.
The phase composition results for the bimetallic 5% Au–20% Cu/MWCNT supported catalyst after reduction are given in Fig. 5B. The analysis of the diffraction curve obtained for the system reduced at 150 °C confirmed the occurrence of CuO, Cu2O, Cu2(OH)3Cl and metallic gold on a fragment of the diffraction curve recorded in Fig. 5B, while in the case of the bimetallic catalyst reduced at 300 °C, the XRD diffraction curve shows diffraction peaks that stem from the metallic copper, metallic gold and AuCu alloy phases. Additionally, it should be pointed out that the Au (111) diffraction peak which was observed on the diffraction pattern recorded for the Au–Cu/MWCNT catalyst reduced at 150 °C was shifted towards the lower values of 2theta in the case of the same catalyst reduced at 300 °C. This shift can be also explained in reference to the Au–Cu alloy formation.
Bracey et al.75 also studied the phase composition of the bimetallic AuCu/SiO2 catalysts after different thermal treatments.
An Au–Cu alloy formation in the case of the reduced bimetallic catalysts in a H2–N2 mixture at 315 °C was confirmed by XRD. The system obtained after reduction is very different and contains in its composition a copper–gold alloy. The XRD diffraction curve also shows the presence of some unalloyed gold, further confirmed by TEM-EDX. The alloy composition and structure depend strongly on the Cu and Au ratio in the catalytic material. The authors also reported that the copper–gold phase is very stable up to 675 °C and requires a high temperature to decompose to the copper oxide and metallic gold phases. It was found that the AuCu alloy requires a temperature between 650 and 800 °C in order to decompose to CuO and metallic Au. The formation of an alloy phase was confirmed also by visible spectroscopy, as the position of the plasmon peak shifts away from the position for gold with the changes in the copper–gold ratio.
3.4 SEM-EDS measurements
The 5% Au–20% Cu/MWCNT bimetallic catalyst was analyzed by scanning electron microscopy with X-ray microanalysis. SEM-EDS was used to study the morphology and determine the surface composition of the MWCNT containing systems. Fig. 6 shows the SEM image obtained for the bimetallic 5% Au–20% Cu/MWCNT catalyst after being subjected to reduction and the reaction. Additionally, the studied catalyst was analyzed by EDS microanalysis. The numbers from 1 to 4 indicated the spots at which the EDS spectra were collected. The EDS results clearly showed that the catalyst's surface is not homogeneous as evidenced by the EDS spectra collected from the catalyst surface, which varied in elemental composition (see Fig. 6).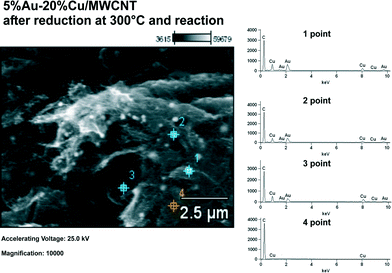 | ||
| Fig. 6 EDS spectra and SEM image for the 5% Au–20% Cu/MWCNT catalyst after being reduced in a mixture of 5% H2–95% Ar at 300 °C and the reaction. | ||
3.5 TOF-SIMS analysis
Secondary ion mass spectrometry was used to analyse the chemical status of the Au–Cu surface of the reference material, which contains the metals in an Au to Cu weight ratio = 1![[thin space (1/6-em)]](https://www.rsc.org/images/entities/char_2009.gif) :
:![[thin space (1/6-em)]](https://www.rsc.org/images/entities/char_2009.gif) 4. Before the TOF-SIMS analysis, the reference sample was reduced in an atmosphere of 5% H2–95% Ar at 300 °C. Fig. 7A and B present fragments of the negative ion spectra. The analysis confirmed the presence of the secondary isotope copper–gold ions: [63CuAu]− and [65CuAu]− and the copper–gold–chlorine ions: [63CuAu35Cl]−, [65CuAu35Cl]− or [63CuAu37Cl]− and [65CuAu37Cl]− on the surface. The presence of the [63CuAu]− and [65CuAu]− ions indicates the presence of the Au–Cu alloy on the catalyst surface, while the presence of the copper–gold–chlorine ([63CuAu35Cl]−, [65CuAu35Cl]− or [63CuAu37Cl]− and [65CuAu37Cl]−) ions on the negative ion spectrum confirmed the formation of the oxychlorides of copper(II) during the preparation process. The presence of these ions explains the shifts of the TPR profiles of the gold–copper catalyst towards the higher temperature range in comparison to the monometallic copper catalyst system.
4. Before the TOF-SIMS analysis, the reference sample was reduced in an atmosphere of 5% H2–95% Ar at 300 °C. Fig. 7A and B present fragments of the negative ion spectra. The analysis confirmed the presence of the secondary isotope copper–gold ions: [63CuAu]− and [65CuAu]− and the copper–gold–chlorine ions: [63CuAu35Cl]−, [65CuAu35Cl]− or [63CuAu37Cl]− and [65CuAu37Cl]− on the surface. The presence of the [63CuAu]− and [65CuAu]− ions indicates the presence of the Au–Cu alloy on the catalyst surface, while the presence of the copper–gold–chlorine ([63CuAu35Cl]−, [65CuAu35Cl]− or [63CuAu37Cl]− and [65CuAu37Cl]−) ions on the negative ion spectrum confirmed the formation of the oxychlorides of copper(II) during the preparation process. The presence of these ions explains the shifts of the TPR profiles of the gold–copper catalyst towards the higher temperature range in comparison to the monometallic copper catalyst system.
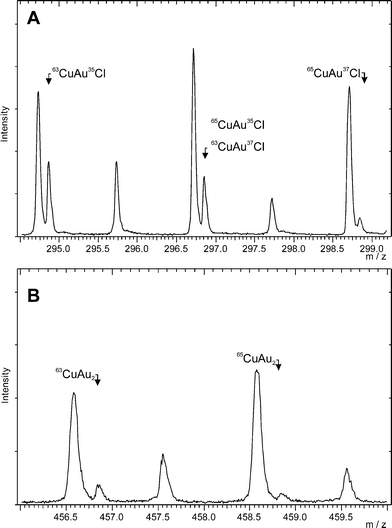 | ||
Fig. 7 TOF-SIMS spectra of the reference Au–Cu material containing the metals in an Au to Cu weight ratio of = 1![[thin space (1/6-em)]](https://www.rsc.org/images/entities/char_2009.gif) : :![[thin space (1/6-em)]](https://www.rsc.org/images/entities/char_2009.gif) 4 reduced in an atmosphere of 5% H2–95% Ar at 300 °C. 4 reduced in an atmosphere of 5% H2–95% Ar at 300 °C. | ||
3.6 Temperature-programmed desorption of ammonia.
The acidity of the prepared catalysts was studied using temperature-programmed desorption of ammonia.76 TPD-NH3 measurements were carried out to elucidate the effect of Au on the total acidity and define the role of the surface acidity on the catalytic reactivity in the oxy-steam reforming of methanol reaction.The ammonia which is used as a probe molecule to study the properties of the acidic catalytic systems can interact with the surface of the studied material by physisorption or chemisorption processes through the lone pair of electron on its nitrogen atom.77 The strength of the interaction which takes place between NH3 and the investigated material depends on the electron accepting properties (i.e., Lewis acidity).
The TPD-NH3 profiles of the MWCNTs and the bimetallic supported catalysts calcined in an air atmosphere at 180 °C are shown in Fig. 8. The distribution of acid centers was also calculated based on the area under the peak situated at an appropriate desorption temperature and the results are given in Table 3. The temperature-programmed desorption profiles recorded for all the systems showed that all samples exhibited three kinds of acid centers i.e. weak, medium and strong centers. The highest total acidity was shown by the multi-walled carbon nanotubes. The introduction of copper and gold into the MWCNTs caused a decrease in the total acidity. The highest acidity of all the catalyst systems calcined in air was shown by the catalyst containing the highest gold content.
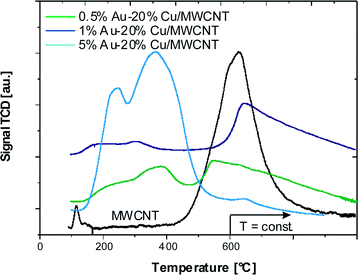 | ||
| Fig. 8 TPD-NH3 profile of the MWCNTs and bimetallic catalysts 1) 0.5% Au–20% Cu/MWCNT, 2) 1% Au–20% Cu/MWCNT, and 3) 5% Au–20% Cu/MWCNT after calcination in air for 4 h at 180 °C. | ||
| Catalysts | Weak centers [μmol g−1] 100–300 °C | Medium centers [μmol g−1] 300–450 °C | Strong centers [μmol g−1] 450–600 °C | Total acidity [μmol g−1] 100–600 °C |
|---|---|---|---|---|
| MWCNT | 143.7 | 42 | 652 | 837.7 |
| 0.5% Au–20% Cu/MWCNT | 32.4 | 70.8 | 690.6 | 793.8 |
| 1% Au–20% Cu/MWCNT | 35 | 21 | 676.4 | 732.4 |
| 5% Au–20% Cu/MWCNT | 256.4 | 426 | 138.3 | 820.7 |
Overall, the total acidity increased with an increase in the gold content. It is worth to note that in the case of the 5% Au–20% Cu/MWCNT catalyst, the participation of the weak and medium centers significantly increased the total acidity in comparison to the other bimetallic supported catalysts.
In the next step of our TPD-NH3 investigation we studied the acidic properties of the catalytic systems after reduction in a mixture of 5% H2–95% Ar at 300 °C in order to determine the influence of the acidic properties on the catalytic reactivity in the oxy-steam reforming of methanol. That is why we carried out the analogous TPD-NH3 measurements for all the systems reduced “in situ” in a mixture of 5% H2–95% Ar at 300 °C and the thermodesorption profiles are shown in Fig. 9. The distribution of the acid centres was also calculated for the reduced bimetallic catalysts and the results are given in Table 4. Also in the case of the reduced catalysts, three kinds of acidic centers were detected for all the systems, namely, weak acid, medium–strong and strong acid sites, which are present on the surface of each catalytic material.
| Catalysts | Weak centers [μmol g−1] 100–300 °C | Medium centers [μmol g−1] 300–450 °C | Strong centers [μmol g−1] 450–600 °C | Total acidity [μmol g−1] 100–600 °C |
|---|---|---|---|---|
| 0.5% Au–20% Cu/MWCNT | 68.1 | 153.2 | 706.4 | 927.8 |
| 1% Au–20% Cu/MWCNT | 97.8 | 247.3 | 519.3 | 864.4 |
| 5% Au—20% Cu/MWCNT | 61.7 | 153.4 | 344.8 | 559.9 |
The results obtained for our systems clearly showed that all the catalysts exhibited weak to strong electron accepting (Lewis acidic) properties. It is also worth to note that the 0.5% Au–20% Cu/MWCNT catalysts exhibited the highest acidity, which is also associated with the highest electron accepting properties. In addition, the 0.5% Au–20% Cu/MWCNT reduced catalytic system was characterized by the lowest concentration of the weak acid sites and exhibited the highest activity in the oxy-steam reforming of methanol. The TPD-NH3 results of the reduced bimetallic catalysts indicate that an increase in the gold content in the investigated systems results in a decrease in the total acidity.
The intrinsic characteristics of the studied bimetallic Au–Cu catalysts such as the acid–base properties and density of the acid surface sites have a great influence on the catalytic performance of the catalyst in the oxy-steam reforming of methanol. It is well-known that the presence of the acid sites on the catalyst surface is fundamental for stabilizing intermediate species such as methoxy and formate.78 These acidic properties may explain the differences in activity observed for all the studied catalysts in the oxy-steam reforming of methanol.
Pre-reduced Pd/CNT-promoted Cu–ZrO2/HZSM-5 hybrid catalysts were prepared and their acidity was studied using the NH3-TPD technique by Zhang et al.79 The results from the TPD-NH3 measurements carried out for CZ PdCNT/HZ, CZ CNT/HZ, CZ/HZ and HZSM-5 zeolites showed also three kinds of acid sites, which may be ascribed to the desorption of three kinds of NH3-species adsorbed on the weak (mostly L-acid), medium–strong and strong acid (mostly B-acid) sites, respectively.
3.7 The influence of gold addition on the reactivity of the copper catalysts in the oxy-steam reforming of methanol reaction.
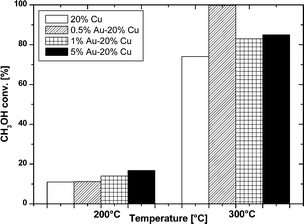
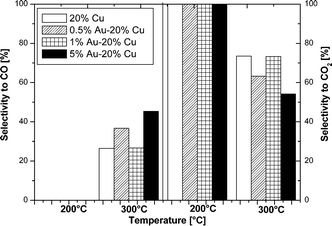
The oxy-steam reforming of methanol was also studied in this work. The results of the activity tests of the monometallic copper and bimetallic gold–copper supported catalysts in the OSRM reaction carried out at 200 °C and 300 °C expressed in methanol conversion and selectivity to hydrogen and the formation of carbon monoxide and carbon dioxide for all the studied catalytic systems are given in Fig. 10–12, respectively.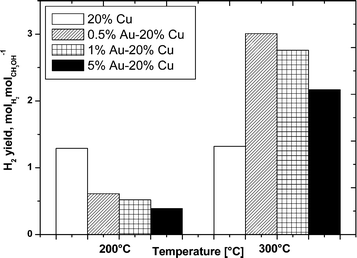 | ||
| Fig. 11 H2 yield as a function of temperature in the oxy-steam reforming of methanol. Reaction conditions: H2O/CH3OH/O2 = 1/1/0.4, GHSV = 2.67 × 10⁴ h−1. | ||
Fig. 10 shows the methanol conversion values for the mono- and bimetallic copper catalysts during the OSRM reaction at 200 and 300 °C. In the case of the 20% Cu/MWCNT catalyst, the conversion of methanol was 11% at 200 °C and increased as the temperature was raised. At 300 °C the consumption of methanol was 75%. Generally, the methanol conversion values for the mono- and bimetallic supported catalysts increased with temperature. By comparing the results of methanol conversion for the copper supported catalyst and the Au–Cu bimetallic catalysts it can be clearly seen that the promotion of the copper catalyst by gold slightly increases the methanol conversion at 200 °C, and far more distinctly at a temperature of 300 °C. It is worth noting that the highest increase in methanol conversion of 99.8% was achieved at 300 °C and was observed for the 0.5% Au–20% Cu/MWCNT catalyst.80 The catalysts with a higher content of gold such as 1% Au–20% Cu/MWCNT and 5%–20% Cu/MWCNT showed methanol conversion at 300 °C at levels of 83 and 85%, respectively. It is worth to note that the methanol conversion increases together with the rise of the gold content in the catalytic systems at 200 °C. This means that the alloy phase formed during the activation process plays a crucial role during the oxy-steam reforming of methanol. The increase in activity can be explained by the creation of new centers of adsorption in the course of the reaction.
Similar findings were reported by López et al.64 They studied bimetallic CuNi/ZrO2 catalysts in the OSRM and they have found that the high stability of the bimetallic catalysts is associated with the presence of the bimetallic Cu–Ni and core–shell Ni/Cu nanoparticles which are present on the support surface. They also claimed that the oxy-stem reforming of methanol may be a structure-sensitive reaction.
Bracey et al. also reported that an Au–Cu alloy created during the reduction process carried out at 315 °C was responsible for the activity improvement of the bimetallic Au–Cu/SiO2 catalysts in propane oxidation.
At 300 °C the highest methanol conversion was shown by the 0.5% Au–20% Cu/MWCNT system and a further increase in the gold content in the catalytic material to 1% wt results in a decrease of the methanol conversion. However, a further increase in the gold content in the investigated system up to 5% wt of Au caused a slight increase of the methanol conversion. The activity results obtained in the oxy-steam reforming of methanol reaction demonstrate that the activity of the studied catalysts is not only connected with the gold content but also with the amount of the alloy phase in the investigated system. The catalytic tests confirmed that apart from the catalyst composition, other properties of the catalyst such as reducibility and acidity have a great influence on the catalytic activity of the investigated systems.
The highest activity (almost 100%) in the oxy-steam reforming of methanol in terms of methanol conversion was shown by the bimetallic catalysts containing the lowest content of gold. The observed reactivity results can be explained by the reductive properties and the acidic properties of the investigated system (electron accepting properties), and also by the presence of an alloy phase. The most active catalyst was the system reduced at the lowest temperature range (see Fig. 2 and Table 1). These results confirmed that in the case of this system we could expect the highest dispersion of metallic copper after the activation process is carried out at a temperature of 300 °C in a mixture of 5% H2–95% Ar. The highest metallic copper dispersion could be explained by metal particles stemming from the copper oxide species, previously reduced at a low temperature range. On the other hand, the highest acidity indicates that the highest amount of the acid sites stabilizes the highest quantity of intermediates during the reaction, which are further dehydrated and dehydrogenated into the main products (CO2 and H2). This can also explain the highest activity of this catalyst.
In summary, the methanol conversion results indicate that the value of methanol conversion depends strongly on the quantity of the alloy phase, which is also an active center during the reaction. In addition, the present results indicate that the reducibility of each system and the acidic properties are also important factors influencing the catalyst reactivity.
The H2 yield is shown in Fig. 11 for all the catalysts at 200 and 300 °C. The results of the hydrogen yield obtained at 200 °C showed an opposite trend in comparison to the methanol conversion for all the catalysts. The H2 yield decreases together with the increase in the gold content in the bimetallic system. While at 300 °C, the H2 yield generally parallels the methanol conversion.
The higher yield of hydrogen was shown by the 0.5% Au–20% Cu/MWCNT bimetallic catalyst, which also was the most active system at 300 °C. The increase of the gold content in the bimetallic catalyst results in a decrease in the H2 yield during the reaction which is in good agreement with the acidity results showing a decrease in the total acidity with an increase in the gold content.
Fig. 12 shows the selectivity results towards carbon monoxide and carbon dioxide formations obtained in the tested reaction. The selectivity results obtained at 200 °C showed no carbon monoxide formation. No CO formation was observed during the reaction carried out at 200 °C. This result can be easily explained because CO is a by-product of the methanol decomposition and reverse water-gas shift endothermic reactions. Increasing the reaction temperature to 300 °C led to the appearance of carbon monoxide in the reaction products. The lowest quantity of carbon monoxide in the reaction products was obtained at 300 °C, which was exhibited by the copper catalyst and the 1% Au–20% Cu/MWCNT system. The promotion of the copper catalyst by gold leads to a decrease in selectivity towards carbon dioxide and an increase in selectivity towards CO. These results can be explained by the fact that at a higher reaction temperature (300 °C) both the methanol oxy-steam reforming and reverse water gas shift reactions (RWGS) run at the same time. This is evidenced by the formation of carbon monoxide and the decrease in selectivity towards CO2. In contrast, when the OSRM is performed at a low temperature (200 °C), increasing the metal content in the catalytic material caused the increase in methanol conversion and the reaction of the oxy-stem reforming of methanol to proceed more easily.56
The catalytic activity measurements carried out for all the catalysts showed that gold played a positive role on the activity of the studied catalysts. This is evidenced by the methanol conversion values of the bimetallic supported catalysts which were all higher compared to the monometallic copper catalysts. The promotion effect on the H2 yield was also proven in the case of the bimetallic catalysts. It is also worth to note that the highest activity and yield of H2 formation was exhibited by the catalyst with the highest electron accepting properties which was the easiest reducible system compared to the other investigated systems.
Cu/ZnO and Cu/ZnO/Al2O3 catalysts22 were studied in the oxy-steam reforming of methanol. The reactivity results showed that methanol conversion increases with the reaction temperature according to typical S shaped curves. At 200 °C the methanol conversion reached the maximum value of about 18% for the Cu/ZnO/Al2O3 catalyst (metal composition (at%) Cu = 18, Zn = 33, Al = 49). In contrast, for the rest of the catalysts the reaction does not proceed at 200 °C, while at the reaction temperature of 300 °C, the methanol conversion for the same catalyst was about 82%. This value was lower for the other systems with higher and lower copper contents. For all the catalysts, the methanol conversion reached 100% at a temperature of 350–400 °C. These results gave evidence that there is no simple correlation between the activity and the copper content or copper area in the catalyst system. This means that the activity of the copper catalysts depends on the other properties of the investigated system. The yield of hydrogen for all the catalysts parallels the methanol conversion at a given temperature. The highest H2 yield was obtained for the catalyst which showed the highest methanol conversion. However, the hydrogen yield decreases at high temperature. At high reaction temperatures (350–400 °C), the highest H2 yield was exhibited by the Cu/ZnO/Al2O3 catalysts containing the lowest concentration of copper (metal composition (at%) Cu = 5, Zn = 50, Al = 45). In this work, we also found similar findings for the activity results obtained for the conventional Cu/ZnO or Cu/ZnO/Al2O3 catalysts obtained in ref. 22.
We also confirmed that the bimetallic Au–Cu/MWCNT catalytic systems showed the same or even higher methanol conversion at 300 °C compared to the conventional catalysts studied by Turco et al.22 In addition, the H2 yield obtained for the 0.5% Au–20% Cu/MWCNT catalyst was higher than in the case of the conventional Cu/ZnO/Al2O3 catalyst but exhibited lower selectivity to CO formation.
Hereijgers et al.78 investigated a series of basic metal oxide-promoted gold catalysts (Au/Al2O3, Au/La2O3, AuMOx/Al2O3, where M = Mg, Ca, Sr, Ba, La) in the partial oxidation of methanol reaction in order to produce CO-free hydrogen. The activity tests performed for the promoted catalysts showed that the selectivity towards the formation of hydrogen increases with increasing basicity of the alkaline earth metal oxide which was added to the catalytic system. The selectivity to hydrogen production increases in the following order: unpromoted catalyst < MgO < CaO < SrO < BaO. However, the selectivity results towards CO and CH4 formations showed an opposite trend.
It has been reported that Au nanoparticles on a La2O3 support exhibited superior catalytic performance in terms of H2 production and suppressing CO formation. These results were explained by the promoting effect of the acid/base properties of the support which reduce the occurrence of undesired reactions, e.g., methanation and the formation of carbon monoxide.78
In the same work,78 the authors compared their catalytic systems with commercial catalysts like the Cu/ZnO system in the partial oxidation of methanol reaction carried out at 300 °C. Their catalytic system showed an even higher methanol conversion of above 85% for the AuLa2O3/Al2O3 system in comparison to the commercial catalysts which exhibited a methanol conversion of about 82%. On the other hand, the commercial catalyst showed the highest hydrogen selectivity of 98% but the selectivity towards CO was only 12%. It is worth to note that the gold catalyst supported on La2O3 showed a lower methanol conversion (54%) in the studied reaction and also the lowest selectivity towards the formation of carbon monoxide (2.1%). At the same time, no methane formation was observed on this catalyst.
Monometallic copper Cu/ZrO2, nickel Ni/ZrO2 and bimetallic Cu/Ni/ZrO2 catalysts prepared by a deposition–precipitation method were also studied in the oxy-steam reforming of methanol in the temperature range of 250–360 °C by Pérez-Hernández et al.81 The reactivity results in the oxy-steam reforming of methanol showed that the main products of the reaction performed using the bimetallic catalysts were H2, CO, CO2 and H2O. A trace of methyl formate and methane in the product mixture of the reaction was observed. The bimetallic catalysts showed the best catalytic performance in the OSRM at a low temperature range. On the other hand, the Ni supported catalyst was more effective compared to the Cu catalyst at high temperature. All the tested catalysts exhibited the same selectivity towards H2 at 360 °C, which was about 60%. The high selectivity towards CO is explained by the presence of Ni-rich bimetallic nanoparticles, the existence of which was confirmed by TEM and EDX analyses.
Conclusions
This work provides evidence that gold promotion of copper catalysts has a significant impact on the activity and selectivity of the copper catalysts in the oxy-steam reforming of methanol. It was found that the Au–Cu alloy is formed during the reduction process carried out at 300 °C. The occurrence of this alloy was confirmed by the “in situ” XRD measurements, TOF-SIMS and SEM-EDS techniques. It was also found that the Au–Cu alloy formed during the activation process was the active phase in the oxy-steam reforming of methanol. It was also demonstrated that the acidity (electron accepting properties) and reducibility of the investigated systems have an influence on the activity of the tested catalysts in the studied reaction. The highest activity and H2 yield were shown by the 0.5% Au–20% Cu/MWCNT bimetallic catalyst which had the highest total acidity and was the easiest reducible system compared to the other investigated systems. It was also found that an increase in the total acidity increased the methanol conversion value and H2 yield for the investigated bimetallic catalysts. This tendency can be explained by fact that the acidic sites stabilize the intermediate formed during the reaction. The facilitated reduction and thermal decomposition of the copper catalysts supported on the multi-walled carbon nanotubes after gold promotion were proven by the TG and TPR-H2 techniques. The activity results confirm the possibility of the use of the investigated materials for H2 generation by the oxy-steam reforming of methanol.Acknowledgements
The project was funded by the National Science Centre (Grant no. DEC 2012/05/D/ST8/02856).Notes and references
- S.-C. Yang, W.-N. Su, S. D. Lin, J. Rick and B.-J. Hwang, Catal. Sci. Technol., 2012, 2, 807–812 CAS.
- J.-P. Shen and C. Song, Catal. Today, 2002, 77, 89–98 CrossRef CAS.
- J. Kuc, M. Neumann, M. Armbruster, S. Yoon, Y. Zhang, R. Erni, A. Weidenkaff and S. K. Matam, Catal. Sci. Technol., 2016 10.1039/c5cy01410g.
- C. Mateos-Pedrero, H. Silva, D. A. Pacheco Tanaka, S. Liguori, A. Iulianelli, A. Basile and A. Mendes, Appl. Catal., B, 2015, 174–175, 67–76 CrossRef CAS.
- J. Wang, C.-H. Li and T.-J. Huang, Catal. Lett., 2005, 103, 239–247 CrossRef CAS.
- W. Shan, Z. Feng, Z. Li, J. Zhang, W. Shen and C. Li, J. Catal., 2004, 228, 206–217 CrossRef CAS.
- S. Patel and K. K. Pant, Fuel Process. Technol., 2007, 88, 825–832 CrossRef CAS.
- J. Papavasiliou, G. Avgouropoulos and T. Ioannides, Catal. Commun., 2004, 5, 231–235 CrossRef CAS.
- T. Shishido, Y. Yamamoto, H. Morioka and K. Takehira, J. Mol. Catal. A: Chem., 2007, 268, 185–194 CrossRef CAS.
- L. Yong-Feng, D. Xin-Fa and L. Wei-Ming, Int. J. Hydrogen Energy, 2004, 29, 1617–1621 CrossRef.
- I. Ritzkopf, S. Vukojević, C. Weidenthaler, J.-D. Grunwaldt and F. Schüth, Appl. Catal., A, 2006, 302, 215–223 CrossRef CAS.
- C.-T. Wang and R. J. Willey, Catal. Today, 1999, 52, 83–89 CrossRef CAS.
- T. Shishido, Y. Yamamoto, H. Morioka, K. Takaki and K. Takehira, Appl. Catal., A, 2004, 263, 249–253 CrossRef CAS.
- Y. Matsumura, K. Tanaka, N. Tode, T. Yazawa and M. Haruta, J. Mol. Catal. A: Chem., 2000, 152, 157–165 CrossRef CAS.
- S. Liu, K. Takahashi, K. Uematsu and M. Ayabe, Appl. Catal., A, 2005, 283, 125–135 CrossRef CAS.
- H. Jeong, K. I. Kim, T. H. Kim, C. H. Ko, H. C. Park and I. K. Song, J. Power Sources, 2006, 159, 1296–1299 CrossRef CAS.
- J. Papavasiliou, G. Avgouropoulos and T. Ioannides, J. Catal., 2007, 251, 7–20 CrossRef CAS.
- L. Ma, B. Gong, T. Tran and M. S. Wainwright, Catal. Today, 2000, 63, 499–505 CrossRef CAS.
- P. Clancy, J. P. Breen and J. R. H. Ross, Catal. Today, 2007, 127, 291–294 CrossRef CAS.
- C.-Z. Yao, L.-C. Wang, Y.-M. Liu, G.-S. Wu, Y. Cao, W.-L. Dai, H.-Y. He and K.-N. Fan, Appl. Catal., A, 2006, 297, 151–158 CrossRef CAS.
- O. Jakdetchai, N. Takayama and T. Nakajima, Kinet. Catal., 2005, 46, 56–64 CAS.
- M. Turco, G. Bagnasco, C. Cammarano, P. Senese, U. Costantino and M. Sisani, Appl. Catal., B, 2007, 77, 46–57 CrossRef CAS.
- M. Haruta, N. Yamada, T. Kobayashi and S. Iijima, J. Catal., 1989, 115, 301–309 CrossRef CAS.
- P. Mierczynski, T. Maniecki, W. Maniukiewicz and W. Jozwiak, React. Kinet., Mech. Catal., 2011, 104, 139–148 CrossRef CAS.
- T. Maniecki, P. Mierczynski, W. Maniukiewicz, K. Bawolak, D. Gebauer and W. Jozwiak, Pol. J. Chem., 2008, 82, 2379–2388 CAS.
- T. Maniecki, P. Mierczynski, K. Bawolak, D. Gebauer, W. Maniukiewicz and W. Jozwiak, Pol. J. Chem., 2008, 82, 2367–2378 CAS.
- T. Maniecki, P. Mierczynski, W. Maniukiewicz, K. Bawolak, D. Gebauer and W. Jozwiak, Catal. Lett., 2009, 130, 481–488 CrossRef CAS.
- C. W. Corti, R. J. Holliday and D. T. Thompson, Appl. Catal., A, 2005, 291, 253–261 CrossRef CAS.
- T. Maniecki, K. Bawolak, P. Mierczynski and W. Jozwiak, Catal. Lett., 2009, 128, 401–404 CrossRef CAS.
- T. Maniecki, K. Bawolak-Olczak, P. Mierczynski, W. Maniukiewicz and W. Jozwiak, Chem. Eng. J., 2009, 154, 142–148 CrossRef CAS.
- T. Tabakova, G. Avgouropoulos, J. Papavasiliou, M. Manzoli, F. Boccuzzi, K. Tenchev, F. Vindigni and T. Ioannides, Appl. Catal., B, 2011, 101, 256–265 CrossRef CAS.
- C. Pojanavaraphan, A. Luengnaruemitchai and E. Gulari, Appl. Catal., A, 2013, 456, 135–143 CrossRef CAS.
- C. Pojanavaraphan, A. Luengnaruemitchai and E. Gulari, Int. J. Hydrogen Energy, 2012, 37, 14072–14084 CrossRef CAS.
- C. Pojanavaraphan, A. Luengnaruemitchai and E. Gulari, Chem. Eng. J., 2012, 192, 105–113 CrossRef CAS.
- C. Pojanavaraphan, U. Satitthai, A. Luengnaruemitchai and E. Gulari, J. Ind. Eng. Chem., 2015, 22, 41–52 CrossRef CAS.
- H.-M. Yang and P.-H. Liao, Appl. Catal., A, 2007, 317, 226–233 CrossRef CAS.
- P.-H. Liao and H.-M. Yang, Catal. Lett., 2008, 121, 274–282 CrossRef CAS.
- M. Turco, G. Bagnasco, U. Costantino, F. Marmottini, T. Montanari, G. Ramis and G. Busca, J. Catal., 2004, 228, 43–55 CAS.
- T. Maniecki, A. Stadnichenko, W. Maniukiewicz, K. Bawolak, P. Mierczynski, A. Boronin and W. Jozwiak, Kinet. Catal., 2010, 51, 573–578 CrossRef CAS.
- T. Maniecki, K. Bawolak, D. Gebauer, P. Mierczynski and W. Jozwiak, Kinet. Catal., 2009, 50, 138–144 CrossRef CAS.
- J. Zhao, J. Xu, J. Xu, T. Zhang, X. Di, J. Ni and X. Li, Chem. Eng. J., 2015, 262, 1152–1160 CrossRef CAS.
- T.-C. Ou, F.-W. Chang and L. S. Roselin, J. Mol. Catal. A: Chem., 2008, 293, 8–16 CrossRef CAS.
- A. Sandoval, C. Louis and R. Zanella, Appl. Catal., B, 2013, 140–141, 363–377 CrossRef CAS.
- N. K. Gamboa-Rosales, J. L. Ayastuy, M. P. González-Marcos and M. A. Gutiérrez-Ortiz, Int. J. Hydrogen Energy, 2012, 37, 7005–7016 CrossRef CAS.
- X. Liao, W. Chu, X. Dai and V. Pitchon, Appl. Catal., B, 2013, 142–143, 25–37 CrossRef CAS.
- X. Liu, A. Wang, L. Li, T. Zhang, C.-Y. Mou and J.-F. Lee, J. Catal., 2011, 278, 288–296 CrossRef CAS.
- P. K. Seelam, M. Huuhtanen, A. Sápi, M. Szabó, K. Kordás, E. Turpeinen, G. Tóth and R. L. Keiski, Int. J. Hydrogen Energy, 2010, 35, 12588–12595 CrossRef CAS.
- C. Pham-Huu, N. Keller, G. Ehret, L. C. J. Charbonniere, R. Ziessel and M. J. Ledoux, J. Mol. Catal. A: Chem., 2001, 170, 155–163 CrossRef CAS.
- T. Hou, L. Yuan, T. Ye, L. Gong, J. Tu, M. Yamamoto, Y. Torimoto and Q. Li, Int. J. Hydrogen Energy, 2009, 34, 9095–9107 CrossRef CAS.
- A. Solhy, B. F. Machado, J. Beausoleil, Y. Kihn, F. Gonçalves, M. F. R. Pereira, J. J. M. Órfão, J. L. Figueiredo, J. L. Faria and P. Serp, Carbon, 2008, 46, 1194–1207 CrossRef CAS.
- J.-P. Tessonnier, L. Pesant, G. Ehret, M. J. Ledoux and C. Pham-Huu, Appl. Catal., A, 2005, 288, 203–210 CrossRef CAS.
- V. M. Shinde, E. Skupien and M. Makkee, Catal. Sci. Technol., 2015, 5, 4144–4153 CAS.
- C. Zhou, Y. Chen, Z. Guo, X. Wang and Y. Yang, Chem. Commun., 2011, 47, 7473–7475 RSC.
- P. Sangeetha, L.-H. Chang and Y.-W. Chen, Mater. Chem. Phys., 2009, 118, 181–186 CrossRef CAS.
- E. Mosquera, D. E. Diaz-Droguett, N. Carvajal, M. Roble, M. Morel and R. Espinoza, Diamond Relat. Mater., 2014, 43, 66–71 CrossRef CAS.
- P. Mierczynski, R. Ciesielski, A. Kedziora, M. Nowosielska, J. Kubicki, W. Maniukiewicz, A. Czylkowska and T. Maniecki, React. Kinet., Mech. Catal., 2015, 1–17 Search PubMed.
- P. Mierczynski, K. Vasilev, A. Mierczynska, W. Maniukiewicz, M. I. Szynkowska and T. P. Maniecki, Appl. Catal., B, 2016, 185, 281–294 CrossRef CAS.
- N. Mahata, O. S. G. P. Soares, I. Rodríguez-Ramos, M. F. R. Pereira, J. J. M. Órfão and J. L. Figueiredo, Appl. Catal., A, 2013, 464–465, 28–34 CrossRef CAS.
- S. Song and S. Jiang, Appl. Catal., B, 2012, 117–118, 346–350 CrossRef CAS.
- D. Großmann, A. Dreier, C. W. Lehmann and W. Grünert, Microporous Mesoporous Mater., 2015, 202, 189–197 CrossRef.
- N. Pasupulety, H. Driss, Y. A. Alhamed, A. A. Alzahrani, M. A. Daous and L. Petrov, Appl. Catal., A, 2015, 504, 308–318 CrossRef CAS.
- C.-X. Sun, Y. Wang, A.-P. Jia, S.-X. Chen, M.-F. Luo and J.-Q. Lu, J. Catal., 2014, 312, 139–151 CrossRef CAS.
- C. Kartusch and J. van Bokhoven, Gold Bull., 2009, 42, 343–348 CrossRef CAS.
- P. López, G. Mondragón-Galicia, M. E. Espinosa-Pesqueira, D. Mendoza-Anaya, M. E. Fernández, A. Gómez-Cortés, J. Bonifacio, G. Martínez-Barrera and R. Pérez-Hernández, Int. J. Hydrogen Energy, 2012, 37, 9018–9027 CrossRef.
- R. J. Chimentão, F. Medina, J. L. G. Fierro, J. Llorca, J. E. Sueiras, Y. Cesteros and P. Salagre, J. Mol. Catal. A: Chem., 2007, 274, 159–168 CrossRef.
- S. Pongstabodee, S. Monyanon and A. Luengnaruemitchai, J. Ind. Eng. Chem., 2012, 18, 1272–1279 CrossRef CAS.
- H.-C. Yang, F.-W. Chang and L. S. Roselin, J. Mol. Catal. A: Chem., 2007, 276, 184–190 CrossRef CAS.
- E. D. Guerreiro, O. F. Gorriz, J. B. Rivarola and L. A. Arrúa, Appl. Catal., A, 1997, 165, 259–271 CrossRef CAS.
- B. Lindström, L. J. Pettersson and P. Govind Menon, Appl. Catal., A, 2002, 234, 111–125 CrossRef.
- W. Li, A. Wang, X. Liu and T. Zhang, Appl. Catal., A, 2012, 433–434, 146–151 CrossRef CAS.
- C. L. Bracey, P. R. Ellis and G. J. Hutchings, Chem. Soc. Rev., 2009, 38, 2231–2243 RSC.
- S. Belin, C. L. Bracey, V. Briois, P. R. Ellis, G. J. Hutchings, T. I. Hyde and G. Sankar, Catal. Sci. Technol., 2013, 3, 2944–2957 CAS.
- C. G. Sonwane, J. Wilcox and Y. H. Ma, J. Phys. Chem. B, 2006, 110, 24549–24558 CrossRef CAS PubMed.
- P. Mierczynski, K. Vasilev, A. Mierczynska, W. Maniukiewicz and T. P. Maniecki, Appl. Catal., A, 2014, 479, 26–34 CrossRef CAS.
- C. L. Bracey, A. F. Carley, J. K. Edwards, P. R. Ellis and G. J. Hutchings, Catal. Sci. Technol., 2011, 1, 76–85 CAS.
- P. Mierczynski, K. A. Chalupka, W. Maniukiewicz, J. Kubicki, M. I. Szynkowska and T. P. Maniecki, Appl. Catal., B, 2015, 164, 176–183 CrossRef CAS.
- H. N. Hareesh, K. U. Minchitha, N. Nagaraju and N. Kathyayini, Chin. J. Catal., 2015, 36, 1825–1836 CrossRef CAS.
- B. P. C. Hereijgers and B. M. Weckhuysen, ChemSusChem, 2009, 2, 743–748 CrossRef CAS PubMed.
- M.-H. Zhang, Z.-M. Liu, G.-D. Lin and H.-B. Zhang, Appl. Catal., A, 2013, 451, 28–35 CrossRef CAS.
- A. Gazsi, I. Ugrai and F. Solymosi, Appl. Catal., A, 2011, 391, 360–366 CrossRef CAS.
- R. Pérez-Hernández, G. Mondragón Galicia, D. Mendoza Anaya, J. Palacios, C. Angeles-Chavez and J. Arenas-Alatorre, Int. J. Hydrogen Energy, 2008, 33, 4569–4576 CrossRef.
| This journal is © The Royal Society of Chemistry 2016 |


