 Open Access Article
Creative Commons Attribution 3.0 Unported Licence
Visualisation of single atom dynamics in water gas shift reaction for hydrogen generation†
Pratibha L.
Gai
*abc,
Kenta
Yoshida
ad,
Michael R.
Ward
ac,
Michael
Walsh
ac,
Richard T.
Baker
e,
Leon
van de Water
f,
Mike J.
Watson
f and
Edward D.
Boyes
acg
aThe York Nanocentre, University of York, YO10 5BR, UK. E-mail: pratibha.gai@york.ac.uk; ed.boyes@york.ac.uk
bDepartment of Chemistry, University of York, YO10 5DD, UK
cDepartment of Physics, University of York, YO10 5DD, UK
dInstitute for Advanced Research, Nagoya University, Nagoya 464-8603, Japan
eSchool of Chemistry, University of St. Andrews, St. Andrews, KY16 9ST, Scotland, UK
fJohnson Matthey Technology Centre, Billingham, TS23 1LB, UK
gDepartment of Electronics, University of York, YO10 5DD, UK
First published on 13th November 2015
Abstract
The water gas shift (WGS) reaction, CO + H2O → CO2 + H2, is the basis of heterogeneous catalysis important in the generation of clean hydrogen energy for fuel cells, transportation fuels and in ammonia manufacture. Ceria supported gold and related nanoparticles are potentially viable catalysts for the low temperature WGS reaction. The WGS catalytic reaction is a dynamic process and takes place on the solid catalyst surface at the atomic level. The current understanding of the reaction is inferred from studies of static catalysts and from indirect chemical studies without single atom sensitivity. Therefore the nature of dynamic atomic processes in the WGS reaction has remained inaccessible. Since the catalyst reaction site and atomic processes by which it activates and deactivates, change both in magnitude and mechanism with the reaction environment it is of fundamental importance to visualise the dynamic catalyst at the atomic level in WGS (CO + water mixture) environments, in real time. Novel environmental (scanning) transmission electron microscope with singe atom resolution is used herein to directly visualise and characterise, in real time, evolving atomic structures and processes in practical gold/ceria catalysts in controlled WGS environments. The in situ observations in WGS have revealed the formation of clusters of only a few gold atoms resulting from single atom dynamics and the catalytic effect of low coordination surface sites. The new insights have important implications for applications of nanoparticles in chemical process technologies including for transportation fuels and emission control.
Introduction
The recent development of low temperature fuel cell technology has led to considerable research in fuel processing for clean hydrogen generation and for hydrogen purification from syn-gas feeds using heterogeneously catalysed water gas shift (WGS) reaction.1–11 Noble metal nanoparticles or transition metal nanoparticles (NPs) on ceramic supports are of interest for low temperature WGS (or LTS) heterogeneous catalysis involving the oxidation of CO by water.1–12 Gas-catalyst reactions at reaction temperatures take place at the atomic level and the catalyst function is critically dependent on the reaction environment. Therefore in situ visualisation and analysis of the nanostructural evolution at the atomic level and atomic processes in reaction environments in real time are essential to understand the dynamic catalyst behaviour and atomic scale reaction mechanisms. They are important to understanding the activation and deactivation of the catalyst and in the development of improved catalysts and processes.Previous studies of WGS have involved indirect chemical methods,3,6,7,13 and ex situ conventional electron microscopy (EM) studies involving post-mortem studies of static catalyst samples (where the catalyst is taken out of the reaction environment and cooled to room temperature (RT) and characterised in vacuum).8,16 However the dynamic nature of the catalyst function under reaction environments of gas, water and elevated temperatures cannot be truly inferred from ex situ EM studies of static catalysts. There may also be atmospheric exposure and contamination of samples in ex situ studies which can cause serious errors in interpretation. Furthermore studies carried out without the water environment are not applicable to the WGS reaction.
Recently the WGS reaction using ceria supported noble metal such as gold, platinum and transition metals has attracted considerable attention.2–10,13–17 Chemical studies, including in situ X-ray photoelectron spectroscopy (XPS), EXAFS and XANES of gold/ceria catalysts2,3 have suggested that the structure of gold catalysts could comprise of gold nanoparticles consisting of dozens of atoms (about 50 atoms or more) in the metallic state in close contact with the support, and that the method of preparing the catalyst is important for performance.2,4,13,15 Further, based on theoretical calculations without experimental evidence to support the calculations, and chemical studies, there are varying postulations regarding the location of gold. These include, nonmetallic gold species in Ce vacancy sites in Au on La-doped ceria,5 or Au atoms in oxygen vacancy sites;17 that gold is either in the ionic state14 or in the metallic state2,3,6 and that ceria undergoes sintering in WGS environments.14 However despite many investigations the direct visualisation and analysis of the dynamic catalyst in WGS environments at the single atom level have not previously been reported, leading to uncertainties about atomic processes in the reaction and the location of Au. It is shown that direct in situ visualisation studies at the atomic level are of fundamental importance in understanding the dynamic behaviour of the catalyst under reaction environments, and activation and deactivation mechanisms vital to the catalyst performance and lifetime.18,19
In this work our aim is to elucidate the evolution of atomic structures during the course of the reaction in WGS environments and their role in the reaction pathway. We present the direct visualisation of the atomic structural evolution and analyses of dynamic atomic processes at the WGS-nanocatalyst interface in real time, under controlled flowing CO and water (WGS) mixture at reaction temperatures, and in related environments, using a novel environmental (scanning) transmission electron microscope (E(S)TEM) with single atom resolution.20–23 Calibration procedures to remove any deleterious effects of the electron beam on the sample were employed18–24 which are described in the following experimental section on in situ E(S)TEM. The E(S)TEM data have been supported with quantitative image simulations. Experiments were also carried out in technological WGS (TWGS) mixtures containing reactants and products (i.e. with water (steam) and gas mixture of 2% CO/2% CO2/45% H2/33% H2O/18% N2) for correlation. E(S)TEM at the single atom level is particularly powerful for obtaining atomic level insights into the catalyst behaviour in WGS environments at reaction temperatures, in real time. Lower gas pressures may however be necessary to improve the image resolution.18,19,24
Experimental
Synthesis of samples
Practical catalysts of noble metals on ceria substrates were synthesised by a variation of deposition/precipitation method.2,4,15 The deposition/precipitation method was superior to the incipient wetness method and showed essentially an atomic dispersion of the metal. In this WGS study practical gold nanocatalysts on ceria support with varying amount of gold from 2 wt% (low loading) up to 15 wt% (high loading) were prepared as follows.Nanocrystalline ceria was prepared using a citrate complexation method described previously.25 Cerium nitrate hexahydrate (99.99%, Aldrich) and anhydrous citric acid (99.5%, Alfa Aesar) were made up into 0.1 and 0.2 M solutions, respectively, in deionised (di) water, stirred and combined to give a molar ratio of Ce to citric acid of 1![[thin space (1/6-em)]](https://www.rsc.org/images/entities/char_2009.gif) :
:![[thin space (1/6-em)]](https://www.rsc.org/images/entities/char_2009.gif) 2. After homogenization of this solution, it was heated at 80 °C on a hotplate under stirring for 12 h to remove excess water and to convert the solution to a transparent gel. The thermal decomposition of the gel was carried out in a muffle furnace at 250 °C for 2 h and the resulting, ash-like material was calcined in static air in a tube furnace at 500 °C for 2 h. In both steps, heating and cooling rates were 2.5 °C min−1 and 5 °C min−1, respectively. The resulting powder was placed in a 50 cm3 Nylon jar and dry ground for 1 h using a planetary ball mill (Fritsch Pulverisette 7) operated at 400 rpm. Zirconia balls of 10 mm diameter in a ball to powder mass ratio of 10
2. After homogenization of this solution, it was heated at 80 °C on a hotplate under stirring for 12 h to remove excess water and to convert the solution to a transparent gel. The thermal decomposition of the gel was carried out in a muffle furnace at 250 °C for 2 h and the resulting, ash-like material was calcined in static air in a tube furnace at 500 °C for 2 h. In both steps, heating and cooling rates were 2.5 °C min−1 and 5 °C min−1, respectively. The resulting powder was placed in a 50 cm3 Nylon jar and dry ground for 1 h using a planetary ball mill (Fritsch Pulverisette 7) operated at 400 rpm. Zirconia balls of 10 mm diameter in a ball to powder mass ratio of 10![[thin space (1/6-em)]](https://www.rsc.org/images/entities/char_2009.gif) :
:![[thin space (1/6-em)]](https://www.rsc.org/images/entities/char_2009.gif) 1 were used as the grinding medium. Milling was interrupted every 15 min to dislodge powder from the walls of the container.
1 were used as the grinding medium. Milling was interrupted every 15 min to dislodge powder from the walls of the container.
Gold particles were deposited on the resulting ceria support material to prepare the Au/CeO2 catalyst samples for this study. A procedure using urea as a precipitation agent developed by Smolentseva et al.26 to prepare Au/ceria was also adopted: 2 g of ceria was added to 100 ml of an aqueous solution of urea (0.42 M) and HAuCl4 (99.9%, Aldrich; 1.6 × 10⁻³ M) at 45 °C with stirring. The temperature was increased to 80 °C and held for 4 h under vigorous stirring. The mixture was filtered under vacuum and the solid washed by stirring with 100 ml 18M NH4OH(aq) and filtering again. The recovered solid was washed by stirring with 100 ml di water, filtering and washing with a further 100 ml di water. The product was placed in a tube furnace in a flow of dry, synthetic air and dried overnight at 110 °C for 10 h and then calcined at 300 °C for 4 h. Heating and cooling rates were 3 °C min−1 and 5 °C min−1, respectively. Similar procedures were used for other Au loadings. X-ray diffraction and X-ray photoelectron spectroscopy (XPS) were performed on the samples and the data were consistent with the literature reports.5,14
Low loaded samples were prepared to detect single atoms and atomic clusters of a few atoms with clarity (i.e. without interference from many nanoparticles (NPs)) and with surface areas of ~100 m2 g−1. In highly loaded gold samples an increasing proportion of gold NPs was present and the formation of larger Au nanoparticles of a few nm in size was observed in the WGS reaction at 350 °C. CO conversion rate (WGS activity) did not show any significant increase in the activity at higher Au loadings. This is discussed in the following sections. The gases used in the present experiments were spectrographically pure. Systematic dynamic E(S)TEM experiments on all the catalysts in controlled continuously flowing environments of pure CO, CO + nitrogen, hydrogen, CO + H2O (WGS) mixture and water alone were carried out at reaction temperatures as described in the following sections.
In situ environmental (S)TEM and wet-ETEM at the single atom level
For the visualisation of single atom dynamics we used our in-house development of the first double aberration corrected (double AC) E(S)TEM20–22 with single atom resolution (<100 picometres) under controlled reaction environments, and a wet-ETEM. The double AC-E(S)TEM was developed in the Nanocentre at the University of York by modifying a double AC JEOL 2200FS (S)TEM with a field emission gun (FEG), utilising a large gap objective lens pole piece and pumping systems.20–22 Aberration correction27 and methods to identify single atoms28 are reported in the literature. With the new ESTEM capability it is now possible to analyse real space STEM Z (atomic number) contrast images under reaction conditions with full analytical functionalities (including chemical composition, diffraction and spectroscopy).21,22Prior to the above development we19 reported the development of the first atomic resolution environmental transmission electron microscope (and subsequently termed it as atomic resolution-ETEM) which has enabled real time atomic resolution studies of gas–solid reactions under controlled conditions of a flowing gas environment around the sample with pressures up to 1000 s of Pa (several mbar) at reaction temperatures and for in situ nanosynthesis.18,19 The atomic resolution-ETEM development is exploited for commercial production and is used globally.24 The highlights of the atomic resolution-ETEM include the EM sample chamber as the environmental (gas reaction) cell and radial holes through the objective lens pole-pieces to introduce gas inside the EM column for differential pumping (Fig. 1a). For studies with reactants containing water, referred to as wet-ETEM23 (Fig. 1b) an AC high resolution electron microscope (AC Titan ETEM at the Japan Fine Ceramic Center) was used which is based on the atomic resolution ETEM.19 The wet-ETEM enables direct observations of the dynamic evolution of the catalyst nanostructure in water containing reaction environments at the atomic scale. The wet-ETEM system was equipped with a humidifier to insert water in the ETEM, a mass spectrometer (MS), thermostatic chamber (TC) and a two pressure gauge (PG) system (Fig. 1b). The humidifier system with a MS, TC and PG can be used on any environmental electron microscope (EM) instrument. Both the double AC E(S)TEM providing the ESTEM capability and the AC-wet-ETEM (AC-Titan23) in water containing environments were used in the dynamic nanostructural evaluation and the data were correlated.
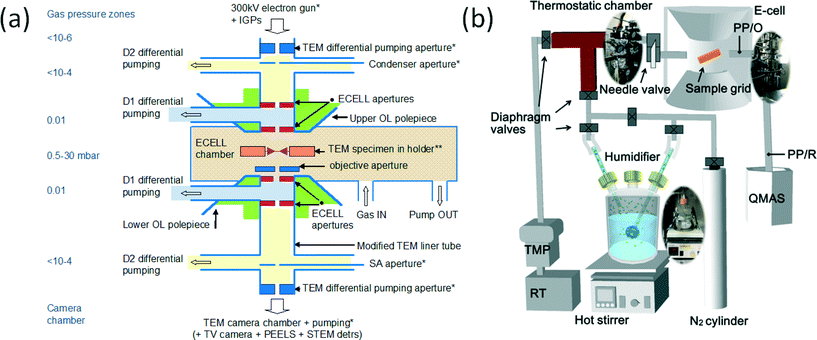 | ||
| Fig. 1 (a) Schematic (not to scale) of key elements of the development of the atomic resolution ETEM,19 with differential pumping. The basic geometry of the aperture system in the development consists of radial holes through objective pole pieces (OL) for gas lines at D. The OL pole pieces are above and below the specimen holder and the lower OL pole piece is indicated. Gas inlet, the first stage of differential pumping lines (D1) between the environmental cell (ECELL) apertures, condenser aperture, a second stage of pumping (D2) at the condenser lens, selected area (SA) diffraction aperture, parallel electron energy loss spectroscopy (PEELS) and TEM camera vacuum are indicated. The electron microscope sample chamber is the gas reaction cell or environmental cell (ECELL). (b) Wet-ETEM system23 to introduce water atmosphere for the differential pumping environmental (gas reaction)-cell (based on the atomic resolution ETEM (a)19), with a quadrupole mass spectrometer). | ||
For EM experiments, powder sample were gently crushed between glass slides and deposited on 3 mm holey carbon supported copper (or Ti ) TEM grids for general examination. For high temperature studies a Gatan 618 holder21 and a Protochips MEMS heating holder23 were used.
Dynamic imaging in the ETEM was used in combination with ESTEM-HAADF20–22 with EDX and electron energy loss spectroscopy (EELS) in the same instrument for chemical analysis to provide insights into atomic structural variations, and sintering behavior under reaction conditions. Dynamic (E(S)TEM20–23 experiments from RT to about 350 °C in WGS, in component gases of CO, CO/N2, hydrogen and in water alone were carried out. The reactions were directly observed with the same sample tilting conditions under dynamic conditions. Experiments were also carried out in TWGS mixtures for comparison.
Environmental STEM in high angle annular dark-field mode (ESTEM-HAADF) with image magnifications up to 12 Million× and in the ETEM mode were used for imaging dynamic reactions. In HAADF-STEM, electrons that undergo Rutherford scattering in electron beam-sample interactions are collected and the image intensity is approximately proportional to Z2 where Z is the atomic number.29,30 This makes it ideal for studies of heterogeneous materials with components of different atomic numbers. Calibration procedures to remove any deleterious effects of the electron beam on the sample were employed.20–24 Dynamic in situ experiments were performed first under low dose imaging conditions (a few e− Å−2) including video recording of dynamic events. The data were correlated with in situ experiments without the electron beam (i.e. ‘blank’ experiments) with samples under the same reaction conditions and the beam switched on briefly just to record the final reaction endpoint, to remove any deleterious effects of the beam on the sample and to confirm the in situ studies under low dose conditions. In the present work examples from the latter (without the beam) are presented with reactions carried out for longer periods and data from low loaded samples are presented. Different areas of the sample were examined in in situ studies to confirm the same reaction.
Imaging in gases and CO gas + water (WGS) environments at the single atom level
Systematic dynamic Imaging of the catalysts was carried out in situ in environments of CO, CO + nitrogen, water, and in CO + water mixture, from RT up to 350 °C. As the product contains hydrogen, the catalyst in hydrogen was also tested from RT up to 400 °C to explore the effect of the gas on the nanostructure, with gas pressures of about 300 Pa (about 3 mbar).Pressures in water + CO (WGS) mixtures in the AC-ETEM and sample environments
For water insertion, we are guided by surface science literature and practices where 0.1 Pa is considered ‘high pressure’.31 As introducing water inside the ETEM is especially harmful to the EM pumping system, and therefore, to the operation of the EM instrument, the effect of various low partial pressures of flowing water + CO mixture (WGS environment) from 0.1 Pa, 1 Pa and up to a few hundred Pa at the catalyst sample on the catalyst nanostructure were carefully tested. The experiments carried out at high pressures down to a few Pa and 0.1 Pa in WGS (water and CO mixture) showed the same nanostructural evolution. These observations are consistent with earlier ETEM reports where the same catalyst nanostructural evolution was observed at different partial pressures of reacting gases in some heterogeneous catalytic reactions.32 Since water is harmful to the pumping system of the EM and since the same nanostructural evolution was observed at different WGS partial pressures, for longer reaction periods used in Fig. 7 and 8 (for periods of >1 hour) the pressure of 0.1 Pa of CO + water mixture at the sample was used. Dynamic experiments at different partial pressures of the flowing reactants showed that CO + water reactant partial pressure of 0.1 Pa at the sample, (which corresponds to a supply rate of about of 1000 monolayers (ML) s−1 of the reactant at the sample in the Langmuir unit21,33) was sufficient to cover the 3 mm EM sample surface, minimise any damage to the pumping system, and to observe surface atomic processes. For the WGS experiments described in the manuscript this pressure was used and the images were recorded at ~220 °C (unless stated otherwise). The stability of ceria grains in WGS mixture was also checked up to 350 °C. As shown in a previous study,32 in several heterogeneous catalytic reactions the nanostructural evolution in the surface reaction is dependent on the immediate interface between the reactant and the solid catalyst and does not depend on the amount of pressure elsewhere in the reactor. In technological reactors large amounts (tons) of catalysts are used at high pressures and these conditions are not feasible in in situ XRD studies, in situ chemical studies (XPS, FTIR etc.) and in in situ EM experiments, in which small amounts of samples are used. The aim in the present in situ EM studies is to understand the atomic structural evolution in reaction environments. Under careful experimental conditions (described in the preceding sections), nanostructures under reaction conditions in the ETEM can be directly correlated to those in technological reactors.32Imaging reacting practical catalysts containing nano-grains and agglomerates at the single atom level under extreme reaction conditions of water and CO mixture and temperature is challenging and each in situ experiment was therefore repeated several times to ensure reproducibility. A small negative defocus (underfocus) was employed to reveal small 0.3 nm clusters of gold (which are at the surface in the sample) in dynamic WGS reactions. It is reported that 1 nm gold nanoparticle (cuboctahedron) contains about 54 atoms and an Au cluster of about 0.3 nm contains 3 to 4 atoms.34
Dynamic atomic structural correlation with reaction rates
Because of the small amounts of the solid catalyst sample (3 mm sample grid) in the electron microscope, measurements of reaction products in WGS and TWGS were performed on larger samples. The samples at low pressures were tested in a silica microreactor with quartz wool at each end and a thermocouple was placed in the catalyst bed. Procedures for tests were similar to those reported previously.35,36 Pressures of a few millibars (mbar), and up to 25b (described below) were used for the correlation between the dynamic catalyst atomic structure and reaction rates (measure of performance). The correlation with dynamic atomic structure with the conversion rate at the low pressure is important for a better understanding and optimisation of the reaction. In these preliminary evaluations the dynamic atomic structural data were correlated with microreactor experiments on larger amounts of sample in WGS and technological WGS (TWGS) mixtures with products. For TWGS at high pressures (25b) a stainless steel microreactor coated with silica and the following experimental conditions were used: 50 mg sample (300–500 micron range), diluted with 500 mg SiC (300–500 micron range) was used. Reduction was carried out in 2% H2/N2, heating to operating temperature of 225 °C, 6.5 L h−1, with 1 h hold. Then the following low temperature shift (LTS) conditions were used:Dry gas: 3% CO/3% CO2/67% H2/27% N2, steam: dry gas ratio = 0.5 → 2% CO/2% CO2/45% H2/33% H2O/18% N2 . Dry gas flow rate: 6.5 L h−1, with similar pressures as above; temperature: 225 °C (up to 24 h), 300 °C (up to 24 h), 225 °C (24 h). The water that was added throughout the test was condensed and collected during the reaction. The amounts of water collected were within 3% of what could be expected based on the water addition rate and water consumption (in case of catalysts with high activity), therefore we have confidence that the test results are reliable.
Theoretical simulations
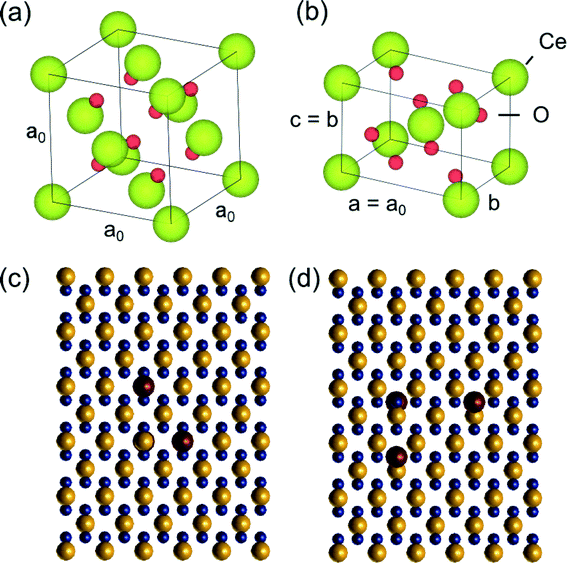
Preliminary quantitative-STEM (QSTEM)37 image simulations were performed to provide insights into the detection of gold metal catalyst atoms located at Ce vacancies (and at oxygen vacancies) on the CeO2 support. According to the literature, the most energetically favourable location for e.g. Au to be is in Ce vacancy site.5 For our simulations a tetragonal supercell was created for different thicknesses of CeO2 (between 0.38–3.8 nm corresponding to 1–10 tetragonal unit cells thick) to represent CeO2 in the [110] zone axis, which is commonly observed. The simulations do not take into account the actual shape of the CeO2 nanoparticles. The original CeO2 unit cell (with lattice parameter a = 0.541 nm), the [110] tetragonal unit cell and a top view of the [110] supercell with different possible Au surface locations are shown in Fig. 2. The models were generated using VESTA.38In QSTEM,37 electron microscope aberration coefficients and operating parameters such as spherical aberration coefficient (Cs), chromatic aberration coefficient (Cc) and energy spread dE are specified for the simulation. Higher order aberrations were not given a specified value. The astigmatism parameter A1 was chosen to be 0 because a good aberration correction can result in an A1 value of less than 100 pm. Table 1 specifies the aberration coefficients and other operating parameters used in the simulations. QSTEM simulation parameters such as probe array (potential sampling) dimensions and resolution are also provided in the Table. TDS refers to thermal diffuse scattering which is taken into account by QSTEM by taking an average of several individual simulation iterations each with random atomic displacements. The slices were defined such that there was 1 atom layer per slice. Outputted images were oversampled 10 times (using a 1 Å source size) prior to acquiring line profiles from which to obtain the intensity differences between Au substituted Ce vacancies and the normal CeO2 [110] surface.
| Parameter | Value |
|---|---|
| Electron microscope parameters: A1 = astigmatism; Cs and Cc are spherical and chromatic aberration coefficients, respectively. dE is the electron energy spread. | |
| A 1 | 0 nm |
| C s | 0.001 mm |
| C c | 1.6 mm |
| dE | 0.8 eV |
| Pixel array | 100 × 100 pixels |
| Probe array | 200 × 200 pixels |
| Probe array resolution | 0.04 × 0.04 Å |
| TDS runs | 30 |
| Inner detector angle | 110 mrad |
| Outer detector angle | 170 mrad |
A program called Greenshot was used to take a screenshot of the same region of the screen whilst on the QSTEM ShowImage program window. This allowed for convenient capture of the QSTEM image (in .img format) into .tiff format. This method eradicates the absolute intensity of the simulation output so an image cannot be quantitatively compared to another. However, the results presented here are based on relative intensity differences within each image. The same supercell (Fig. 2) was used to test intensity variations produced by Au atoms located at oxygen vacancies on the ceria [110] surface. As in Ce vacancy simulations, Au located at the top, bottom and both vacancy sites were simulated in the same model.
In studies of static catalysts carried out in high vacuum of an EM and at RT, which are not representative of the dynamic state of the catalyst, e.g. Au on titania support39 and Pt/ FeOx (ref. 40) the difference in atomic number between the metal and the support is more substantial compared to Au/CeO2. In the direct visualisation of dynamic experiments of WGS catalysis presented here in the following section, images have shown abnormally bright atomic columns of Au/ceria. To the best of our knowledge, such intensity differences have not been quantified before for any of the supported metal systems.
Results
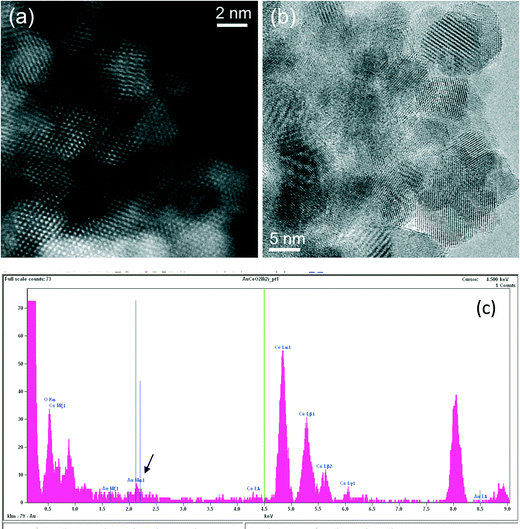
Ceria grains in the practical catalysts were found to be on average a few nanometers (nm) in size, imaged using high angle annular dark field (HAADF) shown in Fig. 3a in ESTEM and in Fig. 3b in ETEM. Although there are some indications of Au atoms/clusters in Fig. 3(b) with dark contrast, they are difficult to discern clearly in the ETEM. Identification of individual Au atoms on the crystalline ceria support is also highly challenging in the (E)STEM and contrast indicative of individual atoms was not discernible. However, a close inspection revealed that the grains with generally uniform thickness showed intensity variations in atomic columns in the experimental images in ESTEM (Fig. 3a). This phenomenon of intensity variations is also observed in practical catalysts of other noble metals and transition metals on ceria. Although such areas (in Fig. 3a and b) did not show the metal nanoparticles, chemical analyses by high precision energy dispersive X-ray spectroscopy (EDX) (shown in Fig. 3c) in the E(S)TEM showed the presence of the metal suggesting that Au was atomically dispersed. A few metal NPs were observed in areas away from these regions. The ceria grain thickness was monitored by electron energy loss spectroscopy.41 Ceria grains were primarily in [110] orientations but a few [001] and [112] grains were also observed.Examples of QSTEM 3D models showing the top view of the Au atoms locations in Ce vacancies are depicted in Fig. 4 with bright Au atomic columns. The super cell size was kept small to reduce computational time; approximately 1 day for the thickest crystal. Several crystal thicknesses were used in the simulations. Replicating a field of view similar to the electron microscopy images would require much larger model requiring excessive computational time. Fig. 4 shows a montage of a few examples of output images at different thicknesses and defocus (Δf) values. The Au capped columns were easy to see in the thin crystals but difficult to identify in the thicker crystal. The appearance of the crystal, regardless of defocus generally resembled clearly defined atomic columns. Simulations for each super cell thickness were carried out at defocus values between ± 10 in 1 nm steps. Results of Au on Ce vacancy sites (Fig. 4) suggest that identifying a single Au atom located on-top of one ceria atom column may be difficult for crystals thicker than 1.92 nm (6 tetragonal unit cells thick) in practice because of weak contrast, but possible to identify at multiple Au atoms in Ce columns as observed in the experiments described in the following sections. Au atoms in Ce sites in several atom columns showed enhanced intensities consistent with our experimental observations (illustrated in Fig. 6 below).
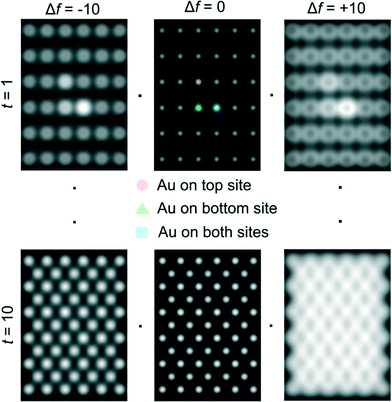 | ||
| Fig. 4 Examples of QSTEM simulated images at different defoci and sample thickness. Line scans across the two central atomic column rows were used to sample the intensity of Ce columns and Au capped columns which are identified in the centre-top image. Simulations contain all three types of Au sites in Ce vacancy sites (shown in Fig. 2) in a single model to illustrate the intensity differences. t = 1 = 0.38 nm thick, t = 10 = 3.80 nm thick. | ||
Another result obtained from these simulations is that the Au atom located at the bottom of the crystal appears brighter than the Au atom located at the top of the crystal. This may be due to channelling effects being more pertinent for the heaviest atom located at the bottom. At the top, electrons may be lost to TDS in the rest of the crystal by the time the electrons exit the crystal. Au atoms in anion vacancy sites did not show discernible enhanced intensities in atom columns. Some examples of simulated images for Au atom located in oxygen vacancy site are illustrated in Fig. 5.
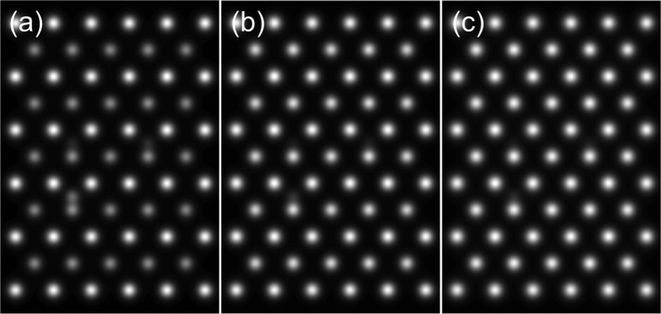 | ||
| Fig. 5 Examples of simulated output images from simulations with Au located at different oxygen vacancy sites with the model thickness being (a) 1.14 nm (b) 2.28 nm and (c) 3.42 nm. | ||
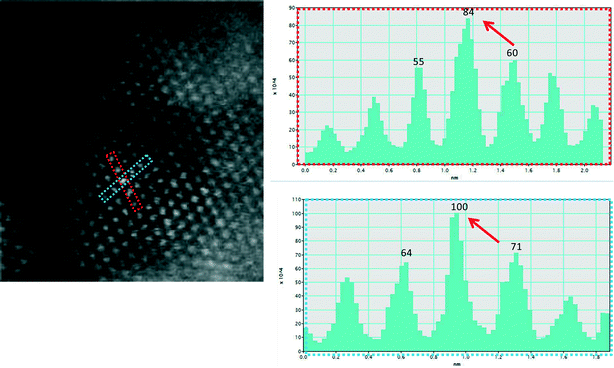
Fig. 6a shows an experimental image of a low loaded Au/ceria in ESTEM-HAADF21,22 at RT, from a general area of the sample. Careful inspection of [110] zone axis oriented individual ceria grains with an essentially uniform thickness revealed intensity variations in atomic column intensities in (111) planes, with some atomic columns brighter than others as indicated in the rectangle in Fig. 6a and confirmed by image simulations shown in Fig. 6b (arrowed). The line intensity profiles in Fig. 6c show peaks of generally uniform intensity on either side of the brighter peak indicating little thickness variations. The intensity data in Fig. 6c were quantified with proof-of-principle simulations (to minimise computational time) using quantitative-STEM (QSTEM)37 suite of image simulations with an Au atom in cerium vacancy site and an Au atom in oxygen vacancy site using the electron microscope operating parameters described in the preceding sections. The simulations with Au atoms in cerium vacancy sites for a thin crystal (Fig. 6b with intensity profiles in Fig. 6d) indicated brighter atomic columns similar to those observed in the experimental image (Fig. 6a and c). Fig. 6e shows simulations for different number of gold atoms in Ce sites in atom columns with better contrast indicating multiple Au atoms participate. This is consistent with the dynamic experiments described in the following sections in Fig. 8 and 9.
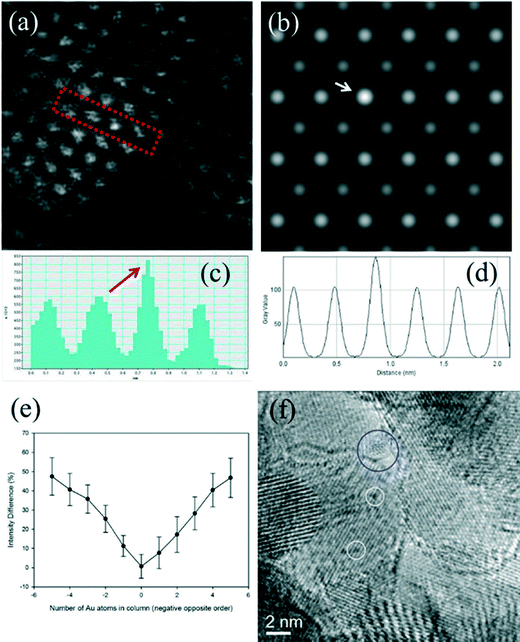 | ||
| Fig. 6 (a) ESTEM showing bright atom column contrast (indicated in box) in [110] ceria; (c) example of line intensity profile from the rectangular box in (a) showing 40% increase in the bright atom column. Intensity variation in grains of generally uniform thickness was observed throughout the sample in ESTEM-HAADF with EDX confirming Au in the areas. Image simulations: in (b) showing bright contrast (arrowed) with four Au atoms in Ce vacancy sites in Ce atom columns for a thin crystal (1.5 nm), consistent with (a); (d), line intensity profiles from (b); (e) simulations with different Au atoms in Ce vacancy sites in atom columns. Although HAADF intensity is proportional to thickness variations (and oxygen atoms may complicate the quantification), we believe that the large intensity increase in Fig. 6c is greater than that can be attributed to thickness variations. (f): dynamic in situ real time observations of [110] Au/ceria in CO + H2O (WGS) environment in wet-ETEM revealing the evolution of ~0.3nm Au clusters of a few atoms in (111) ceria (e.g. white circles). EDX confirmed Au in the clusters. A few single gold nanocrystallites were also observed in [110] (e.g. blue circle). A continuous flow of CO + water (WGS) mixture with a pressure of 0.1 Pa at the catalyst sample was used to minimise any damage to the EM pumping system. Higher pressures showed similar nanostructural evolution. Further details are in the text. | ||
In CO + H2O (WGS) environment as soon as the reactant mixture was introduced, the observations using a small negative defocus provided the direct evidence for the formation of ultra small atomic clusters of Au of about 0.3 nm in size containing only a few atoms (2 < n < 6; consisting of about 3 to 4), from RT onwards to 350 °C. The dynamic in situ observations of [110] Au/ceria in CO + H2O environment at ~220 °C are presented in Fig. 6f.
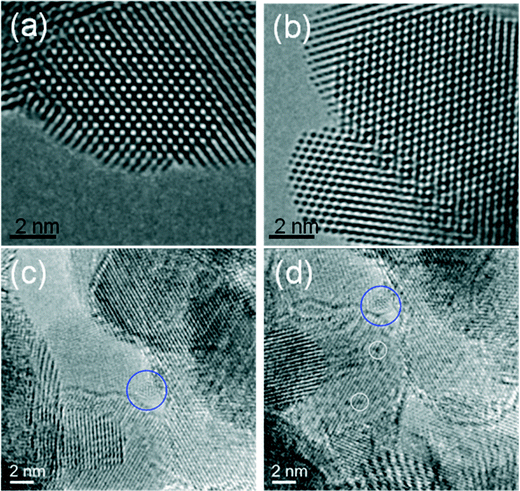
In situ experiments performed in real time in CO and CO/N2 alone (without water) did not show any discernible changes in the nanostructure of Au/ceria under similar periods used for the WGS reaction. (Fig. 7a and b). This suggests that individual Au atoms are still anchored in the vicinity of the Ce vacancy site and may play a key role in the CO oxidation to CO2. This further indicates that the observed Au atom clusters in the WGS environment presented in Fig. 7c and d are due to the reaction in water. The effect of negative defocus in CO + H2O (WGS) to reveal the clusters is illustrated in Fig. 7c and d. The presence of the Au atomic clusters was confirmed by in situ experiments in water alone. (There are reports of CO oxidation only (but not in WGS environment) over larger Au NPs;42 and on the reduction of CuO/ceria in hydrogen and its re-oxidation in oxygen43 – however not in WGS environment).
The Au clusters of a few atoms (atomic clusters) were observed in (111) ceria and were mobile on the support during the course of the WGS reaction. Although the cluster formation in WGS was rapid, the mechanism of their formation can be inferred from the direct observations. The evolution of gold clusters in (111) ceria in Fig. 6e confirms the observation of enhanced atomic column intensities in (111) ceria illustrated in Fig. 6a. This indicates that cationic Au atoms in Ce vacancies act as nucleation points for the small clusters.
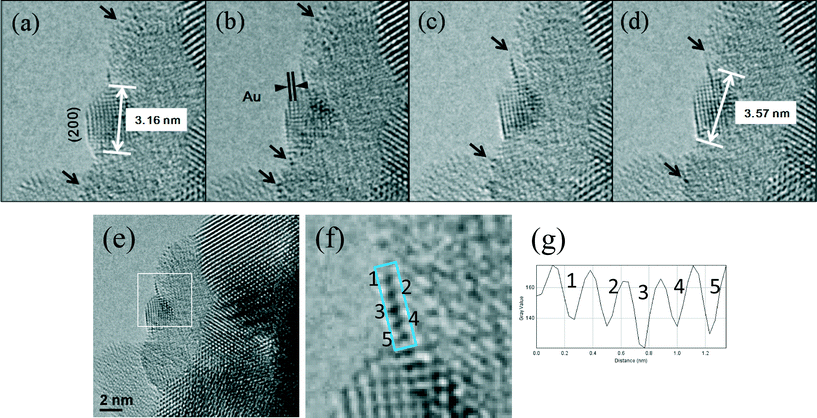
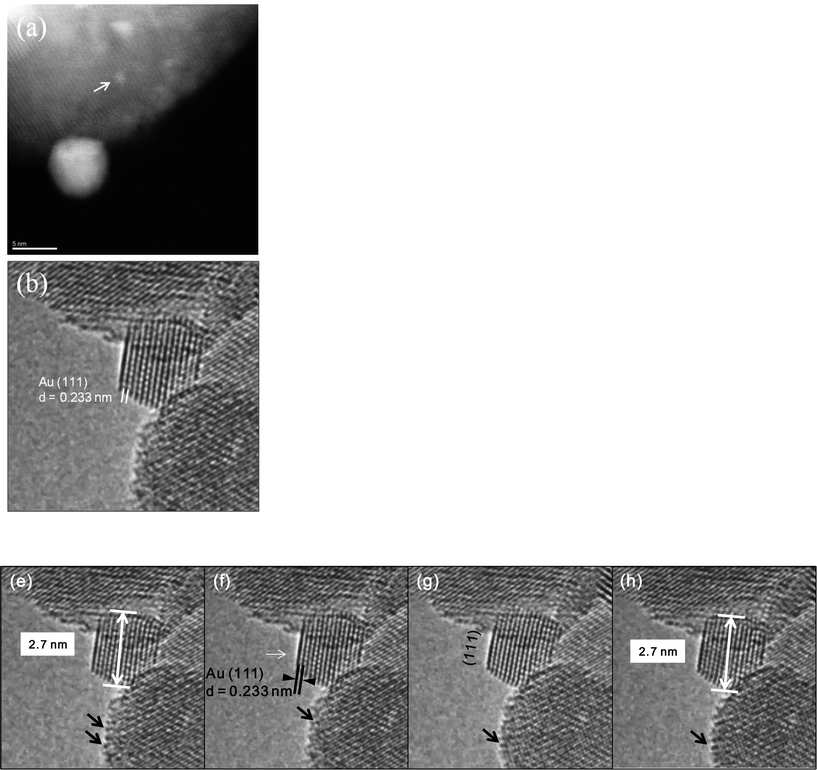
In the WGS reaction Au atoms and clusters of a few Au atoms were observed to migrate and coalesce with Au nanoparticles (NP) during the heat treatment from RT to 350 °C. Atomic scale sintering of a small irregularly shaped (unfaceted) gold nanoparticle in CO + water as a function of time is shown in Fig. 8a–c, at ~220 °C. This is further confirmed by the migration of Au single atoms and clusters to the surface of an unfaceted (irregular) Au NP and its growth as shown in Fig. 9(a–g). The image in (e) (shown in the square) and magnified in (f) showing the Au single atoms and clusters and the corresponding line intensity profiles in (g) reveal that multiple Au atoms participate in the process, consistent with the data in Fig. 6. In the experiments the migration of Au atomic species was observed to increase as a function of temperature.
 | ||
| Fig. 8 Dynamic atomic scale sintering of a small gold nanoparticle (NP) in CO + water (WGS) environment in real time. The presence of Au NP was confirmed by EDX. The gold NP is observed to be in an epitaxial relationship with (111) ceria confirming the formation of Au clusters in the plane (consistent with the observations shown in Fig. 6(f). (a, initial; b, reacted for 1.5 hours; c, for 3 h). For these long reaction periods a continuous flow of CO + water (WGS) mixture with a pressure of 0.1 Pa at the catalyst sample was used to minimise any damage to the EM pumping system. (Higher pressures at shorter periods showed similar nanostructural evolution). For these long reaction periods the electron beam was turned off during the heating and switched on just to record the reaction end-point. The experimental details are given in the text. | ||
In the dynamic atomic resolution experiments in CO, CO/N2 and CO + H2O (WGS), changes in average bulk ceria sizes were not discernible from RT to 350 °C, suggesting that ceria was stable. An example of ceria grains in the WGS environment is illustrated in Fig. 10. It is believed that water fills anion vacancy sites in ceria preventing the bulk grain growth and sintering by grain boundary migration via the vacancy mechanism. As H2 is present in the reactant and product mix, in situ E(S)TEM experiments of the catalyst were performed in hydrogen gas. The catalyst did not show any changes from RT even up to 400 °C in hydrogen (Fig. 11). These results show that neither H2 nor CO (nor CO/N2) alone effects the changes that were observed in the presence of water.
In the WGS reaction, gold nanoparticles start to facet after a few hours (Fig. 12a), and sinter to about 5 nm, or more after 24 h, with a majority NPs faceted. Initial reaction rate measurements (which are a measure of performance) on larger amounts of the catalyst samples in an ex situ microreactor showed that the catalytic activity declined in the presence of faceted particles. Initially the rate of CO conversion in WGS was found to be high but the rate started to decrease with time in the preliminary evaluations. The measurements of CO conversion rates for a fresh catalyst after reacting for short periods (about ~1/2 hour) showed higher rates of on average ~1.4 × 10⁻¹ micro mole per m2 per s (consistent with those reported in the literature for similar periods), but the rates declined with time to about 2 orders of magnitude less to about 4.8 × 10⁻³ micro mole per m2 per s after 24 h, and with only a small effect of Au loading on the activity. These data suggest that clusters of a few Au atoms are primarily responsible for the improved performance. They further indicate that at low Au loading, a majority of the active Au sites (atomic clusters and atoms) exist (as observed in Fig. 6). At higher Au loading a majority of Au NPs are present which are less active in WGS reaction. This is discussed in the following sections. Samples reacted in TWGS for 24 h corresponding to a decrease in the reaction rate showed larger faceted Au NPs (up to several nms), consistent with the in situ observations. The CuZn reference catalyst data were found to be in good agreement with previous activity data of this catalyst (with CO conversion rate of ~3.8 × 10⁻¹ micro mole per m2 per s).
Once Au NPs facet to [110] single crystals with atomically clean (111) surfaces in CO + H2O, their growth appears to cease (Fig. 12). These observations indicate that a lower surface energy configuration is achieved for the NP in the WGS environment, with faceted particles corresponding to a decline in the activity. This is discussed in the following paragraphs.
The direct observations in WGS have shown that Au clusters nucleate from gold single atoms in (111) ceria planes (Fig. 6). In the presence of water there is a large driving force for the reduction and migration of gold species. The observation of Au atomic clusters suggest that cationic gold is reduced in water which promotes the formation of clusters consisting of only a few Au atoms and their sintering. During the course of the WGS reaction different gold species, clusters, atoms and NPs are observed. The observations correlated with reaction rate data indicate higher WGS reaction rate in the initial stages when predominantly Au atomic clusters are present, and the rate declines as they sinter, indicating that primarily atomic clusters of only a few gold atoms and residual gold atoms that may still be anchored on the support, are strongly involved in the efficient WGS reaction. Over time Au atoms and Au atom clusters can migrate across the support until joining an unfaceted particle in sometimes competitive atomic processes as observed in Fig. 8 and 9.
Low coordination surface sites such as single atoms and clusters of a few atoms result in higher surface energies and are believed to enhance catalytic activity.21,22,44–46 The observations of atomic migration in Fig. 8 and 9 illustrate unfaceted NPs acting as recipients and reservoirs of surface adatoms and clusters, and the bulk of NPs remaining redundant in the reaction. Under prolonged WGS reaction however low coordination surface atoms on the surface of unfaceted NPs are removed to minimise the nanoparticle surface energy and the NPs facet to configurations of lower surface energy (Fig. 12) consistent with the observations in supported Pt catalysts.21,22 The minimisation of the particle surface energy is the driving force for the removal of surface adatoms and atom clusters leading to stable faceted nanoparticles. This decrease in low coordination atoms leading to stable low energy faceted NPs is expected to result in the catalyst deactivation as observed in the present study. Fig. 12 shows increased crystallographic faceting of Au NPs after a few hours in the WGS environment. The observations reveal that faceting of gold NPs in [110] with (111) surfaces is due to surface energy effects. In this system, nanoparticle-support interactions and the presence of additional surface groups can complicate the overall particle energetics.47 However assuming clusters and atoms have detached from the support, particle surface energy σ (generally expressed as a function of surface plane48) can be rearranged as a function of the co-ordination number of each surface atom i. Summing over the surface of the particle gives:
Conclusions
The dynamic environmental (scanning) transmission electron microscope investigation in the WGS environment has been demonstrated at the single atom level to reveal atomic processes at the WGS-catalyst interface. The direct observations show the evolution of clusters of only a few gold atoms resulting from single atoms dynamics and their key role in the reaction. The stability of these low coordinated sites as a function of the WGS environment and temperature is therefore important for the efficient chemical reaction. The atomic level insights presented here indicate that to stabilise migratory catalyst atomic species consisting of atoms and clusters a nanoscale support with an abundance of anchoring sites such as grain boundaries on which the atomic species remain anchored during the course of the reaction may be required, as illustrated in promoted zirconia systems.49 This will assist in providing stable active sites for the WGS reaction. As water is a dominant component in many heterogeneous catalytic processes the direct atomic scale findings presented here will enable a detailed understanding of the dynamic behaviour, activity, deactivation and the renewal of other ceramic supported metal NP catalysts, including for transportation fuel applications and emission control, which involve similar combinations of materials.Acknowledgements
This work is supported through the EPSRC (UK) critical mass research grant EP/J0118O58/1 awarded to PLG and EDB. PLG and EDB thank the EPSRC and Johnson Matthey Plc for the award of studentships to MRW and MW. KY thanks the Japan Society for the Promotion of Science (JSPS) for a visiting Fellowship at the Nanocentre of University of York during the early part of the work and the Japan Fine Ceramic Center for the AC-Titan facility. Ian Wright is thanked for technical assistance.References
- C. Ratnasamy and J. Wagner, Catal. Rev.: Sci. Eng., 2009, 51, 325 CAS , (and references therein).
- R. Burch, Phys. Chem. Chem. Phys., 2006, 8, 5483 RSC , (and references therein).
- D. Tibiletti, et al. , J. Phys. Chem. B, 2005, 109, 22553 CrossRef CAS PubMed.
- M. Haruta, Catal. Today, 1997, 29, 153 CrossRef.
- Q. Fu, et al. , Science, 2003, 310, 935 CrossRef PubMed.
- C. H. Kim and L. T. Thompson, J. Catal., 2005, 230, 66 CrossRef CAS.
- G. Jacobs, et al. , Appl. Catal., A, 2004, 262, 177 CrossRef CAS.
- Q. Fu, et al. , Catal. Lett., 2001, 77, 87 CrossRef CAS.
- J. Lin, et al. , J. Am. Chem. Soc., 2013, 135, 15314 CrossRef CAS PubMed.
- A. Amieiro Fonseca, et al. , Top. Catal., 2007, 44, 223 CrossRef.
- J. M. Thomas, Z. Saghi and P. L. Gai, Top. Catal., 2011, 54, 588 CrossRef CAS.
- J. A. Rodriguez, et al. , Phys. Chem. Chem. Phys., 2013, 15, 12004 RSC , (and references therein).
- (a) T. Tabakova, et al. , Appl. Catal., B, 2004, 49, 74 CrossRef; (b) X. Wang, et al. , J. Phys. Chem., 2005, 123, 221101 CrossRef CAS PubMed.
- Q. Fu, et al. , Appl. Catal., B, 2005, 56, 57 CrossRef CAS.
- M. Haruta and M. Date, Appl. Catal., A, 2002, 222, 427 CrossRef.
- H. Sakurai, et al. , Appl. Catal., A, 2005, 291, 179 CrossRef CAS.
- J. A. Rodriguez, et al. , J. Chem. Phys., 2005, 122, 241101 CrossRef CAS PubMed.
- P. L. Gai, et al. , Science, 1995, 267, 661 CrossRef CAS PubMed.
- E. D. Boyes and P. L. Gai, Ultramicroscopy, 1997, 67, 219 CrossRef CAS.
- P. L. Gai and E. D. Boyes, Microsc. Res. Tech., 2009, 72, 153 CrossRef CAS PubMed.
- E. D. Boyes, M. R. Ward, L. Lari and P. L. Gai, Ann. Phys. (Berlin), 2013, 525, 423 CrossRef CAS.
- P. L. Gai, L. Lari, M. R. Ward and E. D. Boyes, Chem. Phys. Lett., 2014, 592, 355 CrossRef CAS.
- K. Yoshida, E. D. Boyes and P. L. Gai, et al. , Nanotechnology, 2014, 25, 425702 CrossRef PubMed.
- P. L. Gai, E. D. Boyes, P. L. Hansen, S. Helveg, S. Giorgio and C. Henry, MRS Bull., 2007, 32(12), 1044 CrossRef CAS.
- M. R. Kosinski and R. T. Baker, J. Power Sources, 2011, 196, 2498 CrossRef CAS.
- E. Smolentseva, et al. , Appl. Catal., A, 2011, 392, 69 CrossRef CAS.
- M. Haider, et al. , Nature, 1998, 392, 768 CrossRef CAS.
- P. Batson, N. Delby and O. Krivanek, Nature, 2002, 418, 617 CrossRef CAS PubMed.
- A. H. Crewe, et al. , Science, 1970, 168, 1338 CAS.
- A. Howie, J. Microsc., 1979, 117, 11 CrossRef.
- G. Somorjai, et al. , Phys. Chem. Chem. Phys., 2007, 9, 3501 RSC.
- P. L. Gai and E. D. Boyes, Handbook on Nanoscopy, ed. G. van Tendeloo, D. van Dyke and S. Pennycook, John Wiley & Sons, Inc., 2012 Search PubMed.
- Surface Analysis Methods in Mater. Science, ed. J. O'Connor, Springer, 2013 Search PubMed.
- A. Herzig, et al. , Science, 2008, 321, 1331 CrossRef PubMed.
- (a) P. L. Gai and E. D. Boyes, Electron Microscopy in Heterogeneous Catalysis, (Instituteof Physics (IOP)) Publ. UK, USA, 2003 CrossRef; (b) P. L. Gai, et al. , Catal. Lett., 2009, 132, 182 CrossRef CAS.
- R. Luque, J. Clark, K. Yoshida and P. L. Gai, Chem. Commun., 2009, 5305 RSC.
- C. T. Koch, PhD Thesis, Arizona State University, USA, 2002 Search PubMed.
- K. Momma and F. Izumi, J. Appl. Crystallogr., 2011, 44, 1272 CrossRef CAS.
- L. M. Molina, M. D. Rasmussen and B. Hammer, J. Chem. Phys., 2004, 120, 7673 CrossRef CAS PubMed.
- B. Qiao, et al. , Nat. Chem., 2011, 3, 634 CrossRef CAS PubMed.
- R. Egerton, Electron Energy Loss Spectroscopy, Plenum Press, 2012 Search PubMed.
- (a) H. Yoshida, et al. , Science, 2012, 335, 317 CrossRef CAS PubMed; (b) Y. Kuwauchi and H. Yoshida, et al. , Nano Lett., 2013, 13, 3073 CrossRef CAS PubMed.
- J. Ciston, et al. , J. Phys. Chem. C, 2011, 115, 13851 CAS.
- B. Hvolbaek, et al. , Nano Today, 2007, 2, 14 CrossRef.
- M. Walsh, K. Yoshida, M. Pay, A. Kuwabara, P. L. Gai and E. D. Boyes, Nano Lett., 2012, 12, 2027 CrossRef CAS PubMed.
- E. D. Boyes and P. L. Gai, MRS Bull., 2015, 40, 600 CrossRef CAS.
- B. Zhang, et al. , Chem. – Eur. J., 2011, 17, 12877 CrossRef CAS PubMed.
- I. Galanakis, N. Papanikolaou and P. H. Dederichs, Surf. Sci., 2002, 511, 1 CrossRef CAS.
- N. Sihju, K. Yoshida, E. D. Boyes, D. R. Brown and P. L. Gai, Catal.: Sci. Technol., 2011, 1, 413 Search PubMed.
Footnote |
| † PLG initiated and led the project. EDB and PLG designed and developed the atomic resolution-ETEM and the double-aberration corrected E(S)TEM with single atom resolution. KY, PLG and EDB developed atomic resolution wet-ETEM. RB, PLG, LvW and MJW carried out sample synthesis and reactivity measurements. PLG, KY, EDB, MRW and MW carried out E(S)TEM and wet-ETEM experiments. MRW carried out QSTEM calculations. |
| This journal is © The Royal Society of Chemistry 2016 |

