 Open Access Article
Creative Commons Attribution 3.0 Unported Licence
Ru/TiO2-catalysed hydrogenation of xylose: the role of the crystal structure of the support†
Carlos
Hernandez-Mejia
a,
Edwin S.
Gnanakumar
a,
Alma
Olivos-Suarez
b,
Jorge
Gascon
b,
Heather F.
Greer
c,
Wuzong
Zhou
c,
Gadi
Rothenberg
a and
N.
Raveendran Shiju
*a
aVan't Hoff Institute for Molecular Sciences, University of Amsterdam, P.O. Box 94157, 1090GD Amsterdam, The Netherlands. E-mail: n.r.shiju@uva.nl; Web: http://hims.uva.nl/hcsc
bDelft University of Technology, Catalysis Engineering Section, Julianalaan 136, 2628 BL Delft, The Netherlands
cSchool of Chemistry, University of St Andrews, St Andrews KY16 9ST, UK
First published on 24th August 2015
Abstract
Effective dispersion of the active species over the support almost always guarantees high catalytic efficiency. To achieve this high dispersion, a favourable interaction of the active species with the support is crucial. We show here that the crystal structure of the titania support determines the interaction and consequently the nature of ruthenium particles deposited on the support. Similar crystal structures of RuO2 and rutile titania result in a good lattice matching and ensure a better interaction during the heating steps of catalyst synthesis. This helps maintain the initial good dispersion of the active species on the support also in the subsequent reduction step, leading to better activity and selectivity. This highlights the importance of understanding the physico-chemical processes during various catalyst preparation steps, because the final catalyst performance often depends on the type of intermediate structures formed during the preparation.
1. Introduction
Lignocellulosic biomass is an excellent feedstock for chemical synthesis. It is renewable, abundantly available and does not compete with food. Consequently, several groups are focused on converting cellulose and hemicellulose into various industrially important chemicals.1–12 Among these chemicals, sugar alcohols attract particular interest, because of the strong market demand from the food and nutraceuticals sectors. Cellulose and hemicellulose can be hydrolysed using acid catalysis into monomeric sugars, that are then hydrogenated to sugar alcohols.13–15 Converting cellulose into C6 sugar alcohols such as sorbitol and mannitol over supported metal catalysts is well studied.16–21 Conversely, there are few reports on converting hemicellulose into the corresponding C5 sugar alcohols using solid catalysts.14,22,23 In this work, we focused on the hydrogenation step from xylose (a hydrolysis product of beechwood hemicellulose) to xylitol, an extensively used compound in the food, cosmetics, and pharmaceutical sectors.24–26 With an estimated market of $340m, xylitol is one of the most popular sweeteners.27 Moreover, its relative inertness gives it a long shelf life, an important feature for pharmaceutical preparations.28,29 Currently, xylitol is made via catalytic hydrogenation over RANEY® nickel.30 Although this catalyst is cheap, it deactivates quickly due to leaching and/or poisoning.31,32 Any leached Ni must be removed, leading to additional costs.27 Alternatively, one can use noble metals such as Ru, Rh and Pd.33–37 Ru is the most effective, but it is much more expensive than Ni, thus its efficiency and long-term stability must be high to be a viable alternative.For heterogeneous catalysts, the active species such as the metal is often supported on a high surface area metal oxide. The interaction between metals and oxide supports, so-called metal-support interactions, then becomes important.38 Tauster et al. proposed the concept of strong metal-support interaction (SMSI) in 1978 to describe the drastic changes in the chemisorption properties of Group 8–10 noble metals supported on TiO2.39 Later, SMSI was widely observed in many metal/oxide catalytic systems. Electronic or geometric factors may be responsible for SMSI. The Electronic factors involve charge transfer between the metal and the oxide. As a result, the electronic structure of the metal will be perturbed.
Here we report the catalytic hydrogenation of xylose to xylitol (eqn (1)) using Ru supported on TiO2. We show that the deposition of Ru on TiO2 gives highly efficient catalyst. However, we also show that the efficiency depends significantly on the crystal structure of the support. The key lies in the catalyst preparation steps, wherein the crystal structures of the support and RuO2 determine the mutual interaction and consequently the Ru particle size.
 | (1) |
2. Experimental section
2.1. Materials and instrumentation
Powder X-ray diffractograms were recorded at ambient temperature using a Rigaku Mini Flex II diffractometer with Ni-filtered CuKα radiation (λ = 1.5406 Å) at operating parameters of 15 mA and 30 kV with step size 0.05° and speed of 5° min−1. Temperature programmed reduction (TPR) studies were done using a 1100 Series Thermo Electron Corporation TPDRO machine. A heating rate of 5 °C min−1 was used with a 40 cm3 min−1 flow of 5% H2/N2. The specific surface areas of samples were measured using the BET (Thermo Scientific Surfer) method under N2 adsorptive gas with multipoint modes at −196 °C. Scanning electron microscopy (SEM) images were recorded without sputtering using a JEOL JSM-6010LA with an accelerating voltage of 10 kV and a Everhart–Thornley detector. SEM coupled with an energy dispersive X-ray analysis (EDX) and equipped with a Silicon-drift detector confirmed the elemental composition. Mapping analysis and element detection where analysed with KLM markers of the characteristic X-ray peak and a beam potential of 20 kV. A Backscattered-electron detector (semiconductor detector) was used to detect Ru particles at a beam potential of 20 kV. Transmission electron microscopic (TEM) images were attained using a JEOL JEM-2011 electron microscope operating at an accelerating voltage of 200 kV, recorded using a Gatan 794 CCD camera. This electron microscope is also equipped with an Oxford Link ISIS SemiSTEM EDX system. HPLC analyses were performed on an Agilent 1100 series instrument, equipped with a Rezex column (RPM-Monosaccharide Pb+2) and a refractive index detector. Ultrapure water (type 1) was used as the mobile phase at a flow rate of 0.6 mL min−1 at 60 °C. Ruthenium chloride anhydrous (RuCl3) was purchased from Fluka. Titanium dioxide (TiO2) from Hombikat (M311) was used as the support. D-(+)-xylose (≥99%), xylitol (≥99%), adonitol, and arabitol were purchased from Sigma-Aldrich. All the chemicals were used as received.2.2. Catalyst preparation
The Ru/TiO2 catalysts were prepared by wet-impregnation of four different titania supports (Table 1). The commercial Hombikat M311 titanium oxide is predominantly anatase (A). A second anatase titania (B) support was prepared from the Hombikat M311 titanium oxide by calcination at 450 °C for 2 h. The third support was rutile titania, obtained by calcining Hombikat M311 at 900 °C for 24 hours (C). A support with both anatase and rutile phases was also prepared from Hombikat M311 titanium oxide by calcination at 800 °C for 2 hours (D). Phase composition of each support was determined by XRD (see ESI†).| Sample | Crystal structure | Preparation | SSAa of calcined catalysts | SSA of reduced catalysts |
|---|---|---|---|---|
| a SSA: Specific Surface Area (m2 g−1). | ||||
| A | Anatase | Hombikat M311 (commercial support) | 86 | 7 |
| B | Anatase | Hombikat M311 calcined at 450 °C, 2 h | 47 | 47 |
| C | Rutile | Hombikat M311 calcined at 900 °C, 24 h | 2 | 4 |
| D | Anatase and rutile | Hombikat M311 calcined at 800 °C, 2 h | 14 | 12 |
For each catalyst, RuCl3 (0.396 mmol) , corresponding to 1 wt% Ru loading, was dissolved in deionized water (50 ml) in a round-bottom flask and heated up to 75 °C using an oil bath. Then titania (4 g) was added into the RuCl3 solution under stirring and left at 75 °C until the water was completely evaporated. The samples were dried at 120 °C for 12 h and were calcined at 400 °C for 3 h. The samples were then reduced at 350 °C for 2 h under H2 atmosphere. The samples were analysed by powder X-ray diffraction (see ESI†).
2.3. Procedure for catalytic experiments
The catalytic tests were carried out in 35 ml cylindrical stainless steel autoclaves. In a typical catalytic test, 10 ml of xylose aqueous solution (conc. ~10 g L−1), 0.10 g of catalyst and stirring bar were placed in the autoclave. Then the autoclave was sealed, purged three times with argon at room temperature and pressurized with H2 (20 bar). The autoclave was put in the heating block under magnetic stirring and temperature was raised at a rate of 8 °C min−1 until reaching the desired temperature. After the reaction time, the autoclave was rapidly cooled down by using an ice bath. Finally, the reaction mixture was filtered and analysed by HPLC. The reaction was carried out at three temperatures initially, 120, 140 and 160 °C. From this, 120 °C was chosen as the optimal temperature and the reaction was studied at different times: 15, 45, 120, 180 and 360 min.3. Results and discussion
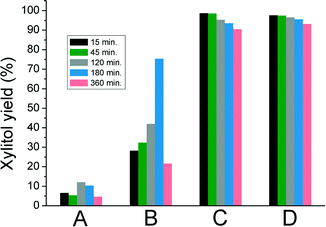
In a typical reaction (eqn (1)), an aqueous solution of xylose was mixed with one of the Ru/TiO2 catalysts A–D (see Table 1) in a stainless steel autoclave at 120–160 °C under 20 bar hydrogen. After the desired reaction time, the autoclave was quenched in an ice bath and the products were analysed using HPLC.Examining the substrate conversion and product yield at 120 °C, one sees immediately a striking performance difference between the anatase and rutile supports (Fig. 1). Anatase supported Ru (A) gave a mixture of products, with low xylitol selectivity. Interestingly, Ru supported on rutile titania (catalyst C) gave 100% xylose conversion and up to 98% yield for xylitol in 15 min. Catalyst D showed similar behaviour to C, indicating that the Ru properties are influenced by the rutile part of the support. B was more active and selective than A, though still worse than rutile supported Ru. Note that B is still predominantly anatase, but has a lower surface area compared to A. Thus, the surface area seems not to be critical here. The same trends in performance were observed at 140 °C and 160 °C, albeit that increasing temperature decreased the xylitol yield (see Fig. 1), giving instead more of the diastereomers arabitol and adonitol (Fig. 2).
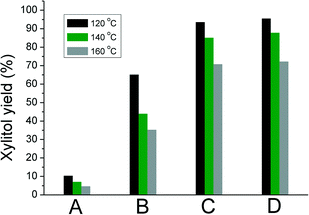 | ||
Fig. 1 Xylitol yield at different temperatures after 3 h reaction. Reaction conditions: 20 bar H2, xylose![[thin space (1/6-em)]](https://www.rsc.org/images/entities/char_2009.gif) : :![[thin space (1/6-em)]](https://www.rsc.org/images/entities/char_2009.gif) Ru ratio 100 Ru ratio 100![[thin space (1/6-em)]](https://www.rsc.org/images/entities/char_2009.gif) : :![[thin space (1/6-em)]](https://www.rsc.org/images/entities/char_2009.gif) 1 (w/w), solvent water. 1 (w/w), solvent water. | ||
The kinetic studies at 120 °C (Fig. 3) confirm that C and D are more active and selective than the anatase based catalysts A and B. Xylitol was selectively formed (98%) within 15 minutes over C and D. The selectivity decreased marginally with increasing the reaction time. A does not show a major xylitol yield at any given time. For B, a maximum xylitol yield is observed at 180 min. Full conversion was not achieved with both A and B under these conditions.
A recycling test for C and D was carried out at 120 °C. The reaction mixture after each time was centrifuged and the liquid phase was separated from the catalyst. This liquid phase was analysed and the catalyst was washed with distilled water. Conversions and xylitol yields were constant even after the fourth recycling test, showing the stability of these two catalysts.
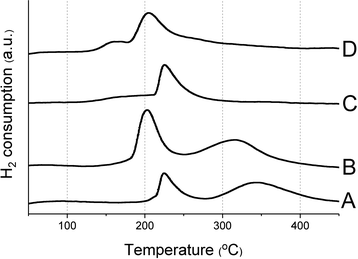
In order to explain the activity trends, we characterized the catalysts by several techniques. The XRD patterns (see ESI†) confirmed that A and C are predominantly anatase and rutile respectively. We also calculated the percentage of rutile phase in each catalyst (B, C and D have 1.1%, 99.5% and 34.5% rutile phase, respectively). Note that the most predominant crystallographic plane for anatase is (101) and for rutile is (110).40 These planes were used for calculating the ratio of the phases and for the images shown in Fig. 6. Diffraction peaks corresponding to ruthenium species could not be observed, indicating high dispersion of supported ruthenium. H2 TPR profiles of the calcined catalysts (Fig. 4) show a sharp peak between 180 and 230 °C, which can be assigned to the reduction of RuO2.36,41,42 Hydrogen intake from the catalysts A, B, C and D are 1254, 1438, 739 and 507 μg mol−1 respectively. Anatase-based catalysts have a higher hydrogen consumption compared to rutile catalysts. The second peak on the TPR profile (between 270 and 450 °C) may be ascribed to a partial reduction of the support, inducing the formation of oxygen vacancies or Ti3+ species.43
SEM analysis (ESI†) revealed a uniform dispersion of ruthenium over C after calcination as well as after reduction. In contrast, EDX detected visible metallic agglomerations on the surface of A and B, before and after reduction. We further studied the catalysts by TEM, which provided important information (Fig. 5). The rutile TiO2 particles (Fig. 5b) were of several hundred nanometers in diameter. In contrast, the anatase TiO2 particles (Fig. 5a) were smaller in size. Since the rutile form was obtained by high temperature calcination, formation of the larger titania particles is expected. Importantly, a homogeneous surface covering of Ru particles was observed on rutile surface (C). The typical Ru particle size is between 5–7 nm (see also ESI†). On the contrary, Ru particles were very localised on the anatase surface. These are much bigger (see the dark particle in Fig. 5a) and could easily be detected by EDX (SEM images in ESI†).
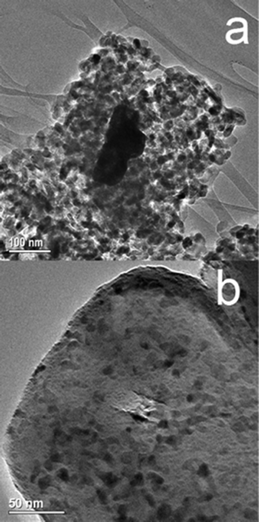 | ||
| Fig. 5 The TEM images of catalysts A (a) and C (b) show the agglomeration of the Ru on the anatase support and the fine dispersion on the rutile support. | ||
The uniform distribution of Ru nanoparticles with a narrow size distribution over rutile titania (catalysts C and D) suggests a lattice anchoring interaction between Ru and the support. Since RuO2 also has a rutile-type structure, we expect a high degree of lattice matching between RuO2 and the rutile titania support, preventing the agglomeration of Ru particles during the calcination step (Fig. 6, left).44–46 Since there is no such matching with the anatase support, the RuO2 particles are less stable (Fig. 6, right). Thus, the agglomeration of Ru on anatase, as shown by TEM, can explain the lower catalytic performance compared with rutile catalysts. RuO2 nanoparticles are reported to be easily aggregated in oxidative atmosphere due to the volatility of oxidized ruthenium.47 This is the case observed in the RuO2/anatase-TiO2. However, the intimate interaction between RuO2 and rutile-TiO2, as a result of their high degree of lattice matching stabilizes the RuO2 and maintains its high dispersion during calcination and further reduction. The binding nature of RuO2 nanoclusters on rutile TiO2 (110) and anatase TiO2 (101) surfaces was studied by first-principle calculations previously.48 These studies showed that the adsorption energy of RuO2 cluster on rutile is larger than that on anatase due to more interfacial bonds formed between cluster and surface. This further confirms our experimental observations that the rutile support provides highly dispersed Ru with uniform nanosize, leading to high activity and stability in xylose hydrogenation to xylitol. When the support contains both rutile and anatase (D), the Ru is predominantly present on the rutile. We observed such behaviour previously for vanadia supported on Al2O3–MgO. Vanadium species was preferentially attached to Al2O3 at low loadings and to MgO at high loading.49
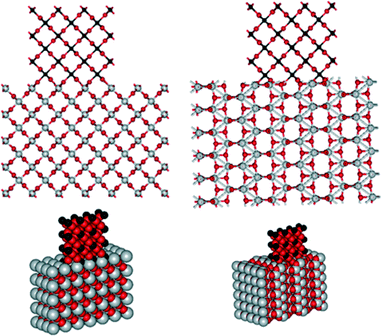 | ||
| Fig. 6 Atomic structures of RuO2 on rutile (left) and anatase (right) TiO2 showing the high degree of lattice matching of RuO2 on rutile TiO2 (created by viewerlite software).50 | ||
We also analysed the catalysts after the reaction by XRD and TEM. The peak at 2θ = 25° was slightly broader for the spent A catalyst. There was no other major change in the XRD patterns before and after the reaction for any of the catalysts (Fig. S2†). TEM images did not show any obvious changes for the spent catalysts (see ESI†). The Ru particles are small and highly dispersed for the spent catalyst C as in the fresh catalysts. This indicates that the structure remains unchanged during the reaction. Indeed, this catalyst retained the same level of activity after multiple recycling tests.
Based on the information from electron microscopy and TPR, we can also infer that large Ru species on anatase TiO2 leads to a higher reducibility of the support. As mentioned before, the peak between 270 and 450 °C in the TPR of anatase-based catalysts may be ascribed to a partial reduction of the support, inducing the formation of oxygen vacancies and Ti3+ species.43 This could happen most likely at the interface between the Ru species and TiO2 support. These species have two main effects. First they alter the charge transfer between the metal and its support leading to changes on the catalyst's performance.51,52 Second, the presence of Ti3+ species interacting with the C–O bond has been related in previous studies34,53 with either a hydrogenolysis pathway where this C–O bond is cleaved or as a Lewis base leading to a retro–aldol reaction (Fig. 7). Thus, the production of glycols by anatase based catalysts can be explained. Moreover, the surface is deficient in oxygen, leading to aldehyde decomposition in favour of oxygen restoration at the lattice, forming different by-products.54,55 All these effects collectively lead to a lower selectivity for the anatase-supported Ru catalysts.
Conclusions
Ru/TiO2 is an effective catalyst for xylose hydrogenation to xylitol. However, care should be taken in preparing the catalyst, as the crystal structure of TiO2 support has a strong influence on the efficiency of the final catalyst. Thus, ruthenium supported on rutile titania gives high conversion as well as high selectivity to xylitol, in spite of a low surface area, while Ru on anatase is less active and non-selective. TEM analysis revealed well dispersed Ru particles, 5–7 nm size over the rutile-titania whereas bigger Ru agglomerations were found on anatase TiO2. This can be explained by a high degree of lattice matching for rutile since RuO2 also has a rutile-type structure, preventing mobility of Ru particles during heating treatments. Small dispersed Ru particles mean more active centres for hydrogenation, improved charge transfer with the support and easier reduction of any superficially oxidised ruthenium. Additionally, possible formation of Ti3+ species over anatase based catalysts may serve as Lewis base sites modifying the reaction pathway thus lowering the selectivity further. This work shows the importance of understanding the intermediate steps in the catalyst synthesis process.Acknowledgements
CHM thanks the National Council of Science and Technology, Mexico (Consejo Nacional de Ciencia y Tecnología CONACyT) for financial support (Scholarship 216968). WZ and HFG thank the EPSRC for a Platform grant (EP/K015540/1). This work is part of the Research Priority Area Sustainable Chemistry of the UvA, http://suschem.uva.nl.Notes and references
- W. Keim, Pet. Chem., 2010, 50, 298–304 CrossRef.
- T. Werpy and G. Petersen, Top value added chemicals from biomass, volume I: results of screening for potential candidates from sugars and synthesis gas, Pacific Northwest National Laboratory, 2004 Search PubMed.
- B. Kamm, P. R. Gruber and M. Kamm, Biorefineries – Industrial Processes and Products, Wiley-VCH, Weinheim, 2006 Search PubMed.
- R. Beerthuis, M. Granollers, D. R. Brown, H. J. Salavagione, G. Rothenberg and N. R. Shiju, RSC Adv., 2015, 5, 4103–4108 RSC.
- Z. Strassberger, F. van der Klis, D. S. van Es, S. Tanase, P. Prinsen and G. Rothenberg, Green Chem., 2015, 17, 325–334 RSC.
- E. V. Ramos-Fernandez, N. J. Geels, N. R. Shiju and G. Rothenberg, Green Chem., 2014, 16, 3358–3363 RSC.
- P. Demma Carà, R. Ciriminna, N. R. Shiju, G. Rothenberg and M. Pagliaro, ChemSusChem, 2014, 7, 835–840 CrossRef PubMed.
- V. Subbiah, P. van Zwol, A. C. Dimian, V. Gitis and G. Rothenberg, Top. Catal., 2014, 57, 1545–1549 CrossRef CAS.
- A. Corma and P. Serna, Science, 2006, 332, 313 Search PubMed.
- M. Dusselier, M. Mascal and B. F. Sels, Top. Curr. Chem., 2014, 353, 1–40 CrossRef PubMed.
- I. Delidovich, K. Leonhard and R. Palkovits, Energy Environ. Sci., 2014, 7, 2803–2830 CAS.
- C. Caro, K. Thirunavukkarasu, M. Anilkumar, N. R. Shiju and G. Rothenberg, Adv. Synth. Catal., 2012, 354, 1327–1336 CrossRef CAS PubMed.
- P. Maki-Arvela, T. Salmi, B. Holmbom, S. Willfor and D. Y. Murzin, Chem. Rev., 2011, 111, 5638–5666 CrossRef CAS PubMed.
- P. Demma Carà, M. Pagliaro, A. Elmekawy, D. R. Brown, P. Verschuren, N. R. Shiju and G. Rothenberg, Catal. Sci. Technol., 2013, 3, 2057–2061 Search PubMed.
- W. Y. Lim and J. Dumesic, Angew. Chem., Int. Ed., 2013, 52, 1270–1274 CrossRef PubMed.
- P. L. Dhepe and A. Fukuoka, Catal. Surv. Asia, 2007, 11, 186 CrossRef CAS.
- M. Yabushita, H. Kobayashi and A. Fukuoka, Appl. Catal., B, 2014, 145, 1–9 CrossRef CAS.
- Y.-B. Huang and Y. Fu, Green Chem., 2013, 15, 1095–1111 RSC.
- A. M. Ruppert, K. Weinberg and R. Palkovits, Angew. Chem., Int. Ed., 2012, 51, 2564–2601 CrossRef CAS PubMed.
- R. Palkovits, K. Tajvidi, J. Procelewska, R. Rinaldi and A. Ruppert, Green Chem., 2010, 12, 972–978 RSC.
- A. Fukuoka and P. L. Dhepe, Angew. Chem., Int. Ed., 2006, 45, 5161–5163 CrossRef CAS PubMed.
- F. Cherubini and A. H. Strømman, Biofuels, Bioprod. Biorefin., 2011, 5, 548–561 CrossRef CAS.
- S. Dutta, RSC Adv., 2012, 2, 12575–12593 RSC.
- C. Hayes, J. Dent. Educ., 2001, 65, 1106–1109 CAS.
- K. Mäkinen, J. Appl. Nutr., 1992, 44, 16–28 Search PubMed.
- M. Uhari, T. Kontiokari, M. Koskela and M. Niemelä, Br. Med. J., 1996, 313, 1180–1184 CrossRef CAS PubMed.
- M. Yadav, D. K. Mishra and J. S. Hwang, Appl. Catal., A, 2012, 425– 426, 110–116 CrossRef.
- S. S. Schiffman and C. A. Gatlin, Neurosci. Biobehav. Rev., 1993, 17, 313–345 CrossRef CAS PubMed.
- H. Förster, H. L. Sipple and K. W. McNutt, Sugars in Nutrition, Academic Press, New York, 1974 Search PubMed.
- A. Melaja, L. Hämäläinen and H. O. Heikkilä, Finland Pat., FI 589388, 1981 Search PubMed.
- J. P. Mikkola and T. Salmi, Chem. Eng. Sci., 1999, 54, 1583–1588 CrossRef CAS.
- J. P. Mikkola and T. Salmi, Catal. Today, 2001, 64, 271–277 CrossRef CAS.
- J. Wisniak, M. Hershkowitz and S. Stein, Ind. Eng. Chem. Prod. Res. Dev., 1974, 13, 232–236 CAS.
- C. Newman, X. Zhou, B. Goundie, I. T. Ghampson, R. A. Pollock, Z. Ross, M. C. Wheeler, R. W. Meulenberg, R. N. Austin and B. G. Frederick, Appl. Catal., A, 2014, 477, 64–74 CrossRef.
- M. Besson, P. Gallezot, A. Pigamo and S. Reifsnyder, Appl. Catal., A, 2003, 250, 117–124 CrossRef CAS.
- J. W. da-Silva and A. J. G. Cobo, Appl. Catal., A, 2003, 252, 9–16 CrossRef CAS.
- S. J. Tauster, S. C. Fung and R. L. Garten, J. Am. Chem. Soc., 1978, 100, 170–175 CrossRef CAS.
- N. R. Shiju, ChemCatChem, 2011, 3, 112–114 CrossRef CAS.
- S. J. Tauster, Acc. Chem. Res., 1987, 20 Search PubMed.
- K. Sivaranjani and C. S. Gopinath, J. Mater. Chem., 2011, 21, 2639–2647 RSC.
- T. Omotoso, S. Boonyasuwat and S. P. Crossley, Green Chem., 2013, 16, 645–652 RSC.
- B. D. McNicol and R. T. Short, J. Electroanal. Chem., 1978, 92, 115–120 CrossRef CAS.
- T. Ekou, L. Ekou, A. Vicente, G. Lafaye, S. Pronier, C. Especel and P. Marecot, J. Mol. Catal. A: Chem., 2011, 337, 82–88 CrossRef CAS.
- J. M. G. Carballo, E. Finocchio, S. Garcia, S. Rojas, M. Ojeda, G. Busca and J. L. G. Fierro, Catal. Sci. Technol., 2011, 1, 1013–1023 Search PubMed.
- J. Li, G. Lu, G. Wu, D. Mao, Y. Guo, Y. Wang and Y. Guo, Catal. Sci. Technol., 2014, 4, 1268–1275 CAS.
- G. A. Rizzi, A. Magrin and G. Granozzi, Phys. Chem. Chem. Phys., 1999, 1, 709–711 RSC.
- Y. Zhang, X. Wang, Y. Zhu and T. Zhang, Appl. Catal., B, 2013, 129, 382–393 CrossRef CAS.
- H. Dong, L. Zhang and X. Zhou, Theor. Chem. Acc., 2014, 133, 1–9 CrossRef CAS.
- Z. Strassberger, E. V. Ramos-Fernandez, A. Boonstra, R. Jorna, S. Tanase and G. Rothenberg, Dalton Trans., 2013, 42, 5546–5553 RSC.
- G. W. Watson, E. T. Kelsey, N. H. de Leeuw, D. J. Harris and S. C. Parker, J. Chem. Soc., Faraday Trans., 1996, 92, 433 RSC.
- Z. Jiang, W. Zhang, L. Jin, X. Yang, F. Xu, J. Zhu and W. Huang, J. Phys. Chem., 2007, 111, 12434–12439 CrossRef CAS PubMed.
- S. Fischer, F. Schneiderb and K.-D. Schierbaum, Vacuum, 1996, 47, 1149–1152 CrossRef CAS.
- K. Kreuzer and R. Kramer, J. Catal., 1997, 167, 391–399 CrossRef CAS.
- H. Idriss, K. S. Kim and M. A. Barteau, Surf. Sci., 1992, 262, 113–127 CrossRef CAS.
- G. Lu, A. Linsebigler and J. T. Yates, J. Phys. Chem., 1995, 99, 7626–7631 CrossRef CAS.
Footnote |
| † Electronic supplementary information (ESI) available: XRD, SEM and EDX analysis, characterization of spent samples, detailed product distribution. See DOI: 10.1039/c5cy01005e |
| This journal is © The Royal Society of Chemistry 2016 |


