
 Open Access Article
 This Open Access Article is licensed under a
 Creative Commons Attribution 3.0 Unported Licence
Predicting the performance of oxidation catalysts using descriptor models
Neetika
Madaan
,
N. Raveendran
Shiju
and
Gadi
Rothenberg
*
Van't Hoff Institute for Molecular Sciences, University of Amsterdam, Science Park 904, 1098XH, Amsterdam, The Netherlands. E-mail: g.rothenberg@uva.nl; Web: http://hims.uva.nl/hcsc
First published on 19th August 2015
Abstract
Practical solutions in catalysis require catalysts that are active and stable. Mixed metal oxides are robust materials, and as such are often used as industrial catalysts. The problem is that predicting their performance a priori is difficult. Following our work on simple descriptors for supported metals based on Slater-type orbitals, we show here that a similar paradigm holds also for metal oxides. Using the oxidative dehydrogenation of butane to 1,3-butadiene as a model reaction, we synthesised and tested 15 bimetallic mixed oxides supported on alumina. We then built a descriptor model for these oxides, and projected the model's results on a set of 1711 mixed oxide catalysts in silico. Based on the model's predictions, six new bimetallic oxides were then synthesised and tested. Experimental validation showed impressive results, with Q2 > 0.9, demonstrating the power of these low-cost predictive models. Importantly, no interaction terms were included in the model, showing that even if we think that bimetallic oxide catalysts are highly complex materials, their performance can be predicted using simplistic models. The implications of these findings to catalyst optimisation practices in academia and industry are discussed.
Introduction
Catalysis is a key enabling technology that affects nearly all aspects of our industrialised society. Catalysts and catalytic processes are essential for the making of fuels and bulk chemicals, fine-chemicals and intermediates, as well as advanced materials, medicines and foodstuffs.1 The applications range far and wide, and so does research into new catalysts. Scientific papers describe amazing and wonderous structures, intricate dendrimers,2 molecular “cages”,3 and hybrid inorganic/organic compounds,4,5 that are limited only by human imagination.However, the bulk of the industrial applications in real life require robust and hardy materials, and the most common are metal oxides.6 These are already “burned” and have a high chemical and mechanical resistance, which is a must for large-scale processing. But appearances can be deceiving: the molecular formula of a mixed oxide may look simple, but the actual structure is highly complex. What's more, unlike the uniformity of homogneous complexes,7,8 the catalytic activity of solids often stems from breaks and kinks on the surface, that in turn depend on minute changes in the synthesis and pre-treatment conditions.9 Predicting the performance of such catalysts successfully is thus a mammoth task.
There are two approaches for making such predictions. The first uses high-power computing and intricate algorithms, that combine quantum and classical mechanics. Great advances were made in this field in the past decade,10 and catalyst performance can actually be predicted, but at a high cost.11,12 The second approach is data-driven, based on modelling catalyst performance using a few simple descriptors. Such models may be less intuitive, but they are highly practical.13–15 Ultimately, both approaches are needed for finding new catalysts and optimising existing ones.
Recently, we demonstrated the feasibility and effectiveness of using simplified radial distribution functions (RDFs) as descriptors for supported metal(0) catalysts.16 These models can predict the performance of heterogeneous catalysts under a reducing environment (e.g. for catalytic hydrogenation). Here, we take these descriptor models an important step further, into the realm of oxidation reactions. The interactions of the active site with the support are different for an oxide and a metal.17,18 Oxides bind differently and react differently, so the catalytic performance of a metallic element is usually very different from that of its oxo or peroxo species. Nevertheless, we show here that by tuning the RDF descriptors to the corresponding metal ions, one can predict well the performance of supported catalysts under oxidative conditions. The theoretical principles are first demonstrated using an experimental set of 15 catalysts in the oxidative dehydrogenation of butane to 1,3-butadiene. Subsequently, we generate a large set of 1711 bimetallic oxides in silico, and use descriptor models to project the experimental results onto this dataset. Six promising catalysts from the virtual set are then synthesised and tested, validating the model and demonstrating the power of data-driven predictive modelling in oxidation catalysis.
Experimental
Materials and instrumentation
Unless stated otherwise, chemicals were purchased from commercial sources (>99% pure) and used as received. γ-alumina (surface area 200 m2 g−1, total pore volume 0.6 cm3 g−1) was provided by LANXESS Deutchland GmbH. Surface area measurements were performed using N2 at 77 K on a Thermo Scientific Surfer instrument and calculated using the BET method. Catalytic oxidative dehydrogenation reactions were tested in a built-for-purpose computer-controlled sixflow reactor setup. This setup enables the testing of six different catalysts simultaneously, using six fixed-bed quartz tube reactors in parallel. The reactors are kept at one temperature but have separately controlled flow rates, allowing for tuning the gas hour space velocity (GHSV). The gas composition is controlled via four mass flow controllers that dose hydrocarbon, oxygen, nitrogen and argon. The temperature is controlled using a carbolite furnace and can be set between 50–1100 °C. Reactor output is analysed on-line by both gas chromatography (Interscience compact-GC) and mass spectrometry (Granville Phillips, Brooks Automation).19,20 Note that while strict calculations should allow for variations in concentration due to the expansion (or compression) of the gas for reactions occurring in gas flow, we assumed for simplicity that the volume remains constant. This enables the use of absolute concentrations and is approximately correct for a flow reaction at low conversions in a reactor with a constant cross-section.Procedure for catalyst synthesis
All catalysts were prepared by wet impregnation of γ-alumina support (M:N/Al2O3; the composition details are given in Table 1). Where possible, we used nitrate precursors, as these are easily removed by calcination. The exceptions were Nb, Mo, W, V and In, where C4H4NNbO9, (NH4)6Mo7O24·4H2O, (NH4)2WO4·H2O, NH4VO3 and H2InN3O10 were used, respectively.| Catalyst | Compositiona |
|---|---|
| a In all cases, the loading of each metal is 1 wt%. | |
| 1 | AgOx:SrOx/Al2O3 |
| 2 | CrOx:ZrOx/Al2O3 |
| 3 | PbOx:InOx/Al2O3 |
| 4 | NbOx:NiOx/Al2O3 |
| 5 | MgOx:CrOx/Al2O3 |
| 6 | GaOx:MoOx/Al2O3 |
| 7 | LaOx:BiOx/Al2O3 |
| 8 | LiOx:WOx/Al2O3 |
| 9 | YOx:KOx/Al2O3 |
| 10 | CuOx:TeOx/Al2O3 |
| 11 | VOx:MgOx/Al2O3 |
| 12 | WOx:MnOx/Al2O3 |
| 13 | CoOx:MnOx/Al2O3 |
| 14 | VOx:MoOx/Al2O3 |
| 15 | PtOx:InOx/Al2O3 |
Procedure for catalyst testing
Each catalyst was tested for 100 mg and 20 mg, catalysts were placed in the reactor tube over a plug of quartz wool, forming a cylindrical catalyst bed roughly 4 cm in height and 4 mm in diameter. In each run using the sixflow reactor, one reactor was kept empty as a blank (this blank was changed between runs to minimise systemic error). The catalysts were activated in situ before reaction in a flow of 45 ml min−1 Ar and 5 ml min−1 O2 at 500 °C. After activation, total reaction feed of 50 ml min−1 was passed in each reactor, with the volumetric ratio ranging O2![[thin space (1/6-em)]](https://www.rsc.org/images/entities/char_2009.gif) :C4H10:Ar = (0.25–1):1:(8.25–8). Reactions were run for 24 h on stream at both 550 °C and 650 °C, giving a total of eight different conditions for each catalysts (reaction conditions A–H, see Table 2). Reactant conversion and product selectivity were monitored on-line using gas chromatography and mass spectrometry. The conversion of butane was calculated as χbutane = (MFin − MFout)/MFin, where MFin and MFout are the molar flows of butane at the reactor inlet and outlet, respectively. Similarly, the selectivity of each product was calculated as Sproduct = MFproduct/(MFin − MFout), where MFproduct is the molar flow of the product at the reactor outlet.
:C4H10:Ar = (0.25–1):1:(8.25–8). Reactions were run for 24 h on stream at both 550 °C and 650 °C, giving a total of eight different conditions for each catalysts (reaction conditions A–H, see Table 2). Reactant conversion and product selectivity were monitored on-line using gas chromatography and mass spectrometry. The conversion of butane was calculated as χbutane = (MFin − MFout)/MFin, where MFin and MFout are the molar flows of butane at the reactor inlet and outlet, respectively. Similarly, the selectivity of each product was calculated as Sproduct = MFproduct/(MFin − MFout), where MFproduct is the molar flow of the product at the reactor outlet.
| Conditions set | Catalyst amount (mg) | O2:nBu ratio |
Reaction T (°C) |
|---|---|---|---|
| A | 100 | 0.25 | 550 |
| B | 100 | 0.25 | 650 |
| C | 100 | 1 | 550 |
| D | 100 | 1 | 650 |
| E | 20 | 0.25 | 550 |
| F | 20 | 0.25 | 650 |
| G | 20 | 1 | 550 |
| H | 20 | 1 | 650 |
Computational methods
Descriptor calculation, analysis and data mining were performed on a Sony Vaio laptop with Intel® Core™ i7-4500U processor. A variable importance (VIP) analysis was done following the method of Hageman et al.21 Principal components analysis (PCA) and partial least squares (PLS) regression models were run using the JMP pro software. The principal components were calculated by using the NIPALS algorithm, which calculates the components in their order of explaining the variance in the data. All models were validated using leave-one-out cross-validation. A discussion on the merits of validation methods is published elsewhere.22Results and discussion
Generating the initial dataset
Aiming at both high conversion of n-butane (herein: χbutane) and a high selectivity to 1,3-butadiene (herein: Sbutadiene) we synthesised and tested a varied set of 15 bimetallic oxide catalysts. We chose Fe, Cu, Ag, Sr, Cr, Zr, Pb, In, Nb, Ni, Mg, Ga, Mo, La, Bi, Li, W, Y, K, V, Te, Co, Mn, Pt, and Zn (see Table 1 above). The rationale for choosing these metals is threefold: first, they are commercially available and most of them are relatively cheap, so they could be also applied in an industrial environment; second, some are known to be good dehydrogenation catalysts while others are known as good catalyst promoters. Finally, we also added some metals at random, reducing the bias in the set (a discussion on selecting metals for oxidation catalysis is published elsewhere23).The bimetallic mixed oxide catalysts 1–15 were prepared using wet impregnation (for details see the Experimental section). X-ray diffraction and BET surface area analysis of several samples (CoOx:MnOx/Al2O3, MgOx:CrOx/Al2O3, LaOx:BiOx/Al2O3, and VOx:MoOx/Al2O3) confirmed that the crystal structure of the alumina remained unchanged. The BET surface area values of these catalysts were all in the range of 200–240 m2 g−1. This is what we would expect considering the low metal loadings and high surface area of alumina support. The 15 bimetallic oxide catalysts were then tested in the oxidative dehydrogenation of n-butane (eqn (1)). This reaction has an interesting history: it was a popular subject of research following WW II, when synthetic rubber was in short supply. The interest subsided in the 1960s, when large-scale cracking of naphtha provided a steady stream of 1,3-butadiene. It then resumed around 2010, with the advent of shale gas and the political unrest in the Persian Gulf. Following our work on ethane24 and propane25 oxidative dehydrogenation, we were approached by Lanxess Deutchland GmbH, one of the main users of 1,3-butadiene, to collaborate on using predictive modelling methods for finding new butane oxidative dehydrogenation catalysts.
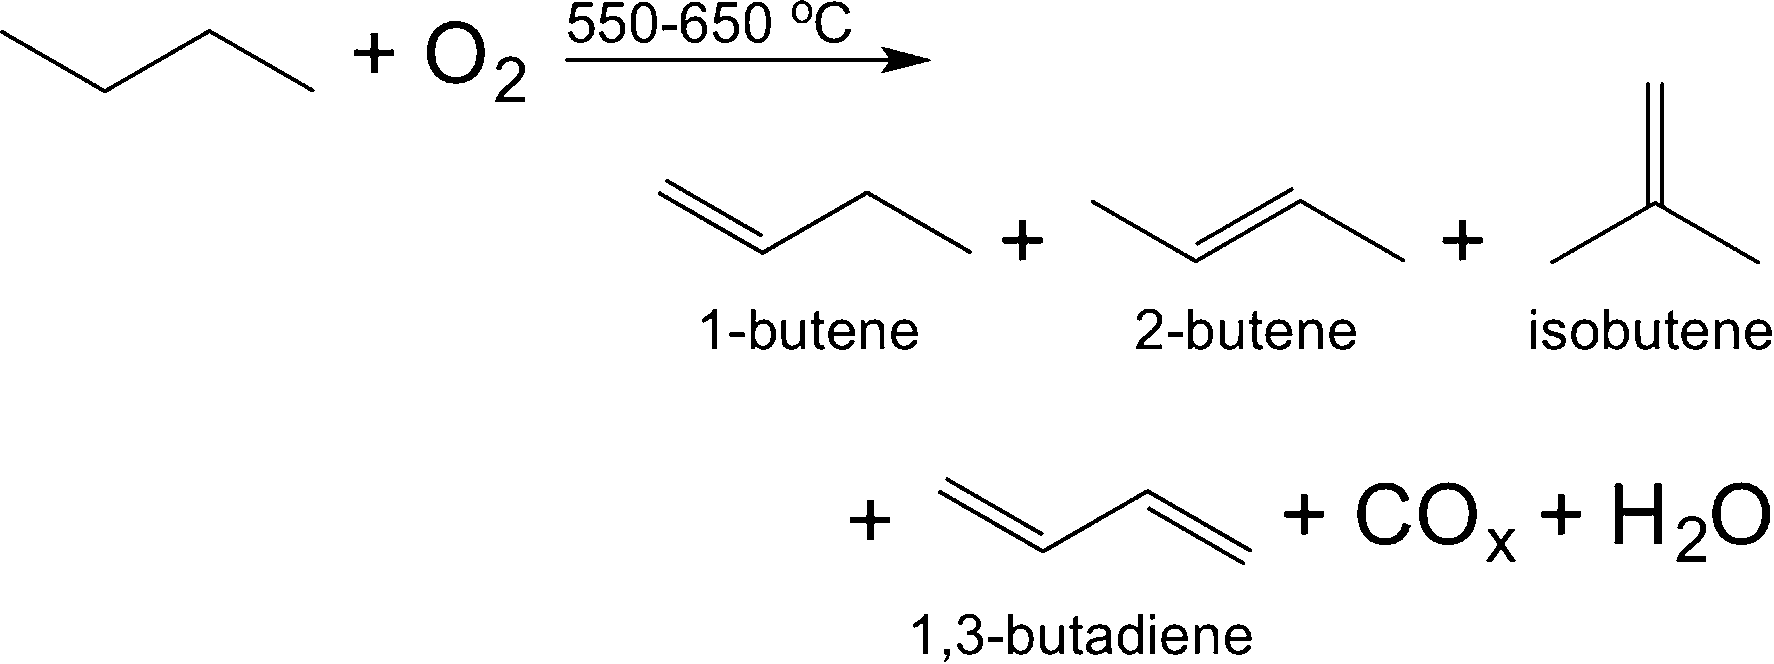 | (1) |
Table 3 shows the conversion and butadiene selectivity results for the four reaction conditions A–D. Running the reactions using lower catalyst loadings (conditions E–H) yielded lower conversions, but very similar selectivity results (results shown in Fig. 1 only). The reactions at lower catalyst loadings were run to confirm that the same mechanism is in effect at both regimes. This was confirmed by the similar product selectivity at lower conversions. Fig. 1 shows the conversion and total butenes selectivity results for all 15 catalysts at all eight condition sets. The remaining difference to 100% is due to oxidation to CO and CO2. No deactivation was observed over 24 h on stream, and control experiments on three different catalysts running for 100 h showed also no deactivation.
| Conditions | 550 °C | 650 °C | ||||||
|---|---|---|---|---|---|---|---|---|
| A | B | C | D | |||||
| 0.25:1:8.75 (nBu:O2:Ar) |
1:1:8 (nBu:O2:Ar) |
0.25:1:8.75 (nBu:O2:Ar) |
1:1:8 (nBu:O2:Ar) |
|||||
| Catalyst | χ butane (%) | S butadiene (%) | χ butane (%) | S butadiene (%) | χ butane (%) | S butadiene (%) | χ butane (%) | S butadiene (%) |
| 1 | 4.7 | 3.8 | 18.5 | 1.2 | 16.5 | 2.2 | 40.0 | 2.0 |
| 2 | 9.0 | 4.0 | 26.5 | 3.3 | 13.7 | 6.0 | 36.2 | 3.7 |
| 3 | 5.3 | 8.5 | 10.0 | 0.3 | 12.5 | 12.8 | 29.5 | 7.5 |
| 4 | 8.5 | 8.0 | 14.4 | 5.2 | 15.5 | 13.7 | 37.0 | 6.0 |
| 5 | 9.0 | 5.3 | 27.0 | 3.2 | 14.2 | 8.2 | 35.5 | 5.5 |
| 6 | 4.5 | 5.0 | 10.0 | 3.5 | 15.0 | 5.0 | 34.8 | 4.0 |
| 7 | 14.0 | 6.0 | 36.0 | 4.0 | 17.5 | 5.0 | 40.0 | 2.2 |
| 8 | 15.2 | 6.0 | 40.0 | 5.0 | 20.6 | 3.5 | 43.5 | 1.6 |
| 9 | 6.0 | 1.6 | 16.0 | 1.1 | 15.0 | 1.9 | 36.5 | 1.7 |
| 10 | 7.8 | 11.2 | 22.3 | 6.5 | 11.7 | 8.2 | 30.5 | 6.2 |
| 11 | 9.5 | 8.0 | 14.5 | 7.0 | 16.5 | 9.3 | 42.0 | 8.3 |
| 12 | 13.0 | 9.0 | 37.0 | 6.0 | 15.5 | 6.0 | 40.0 | 5.0 |
| 13 | 10.3 | 6.3 | 26.5 | 4.5 | 15.0 | 6.0 | 40.0 | 4.5 |
| 14 | 10.5 | 7.0 | 20.0 | 5.4 | 16.5 | 10.2 | 37.4 | 8.0 |
| 15 | 9.0 | 14.0 | 20.0 | 3.0 | 12.0 | 14.0 | 22.0 | 6.0 |
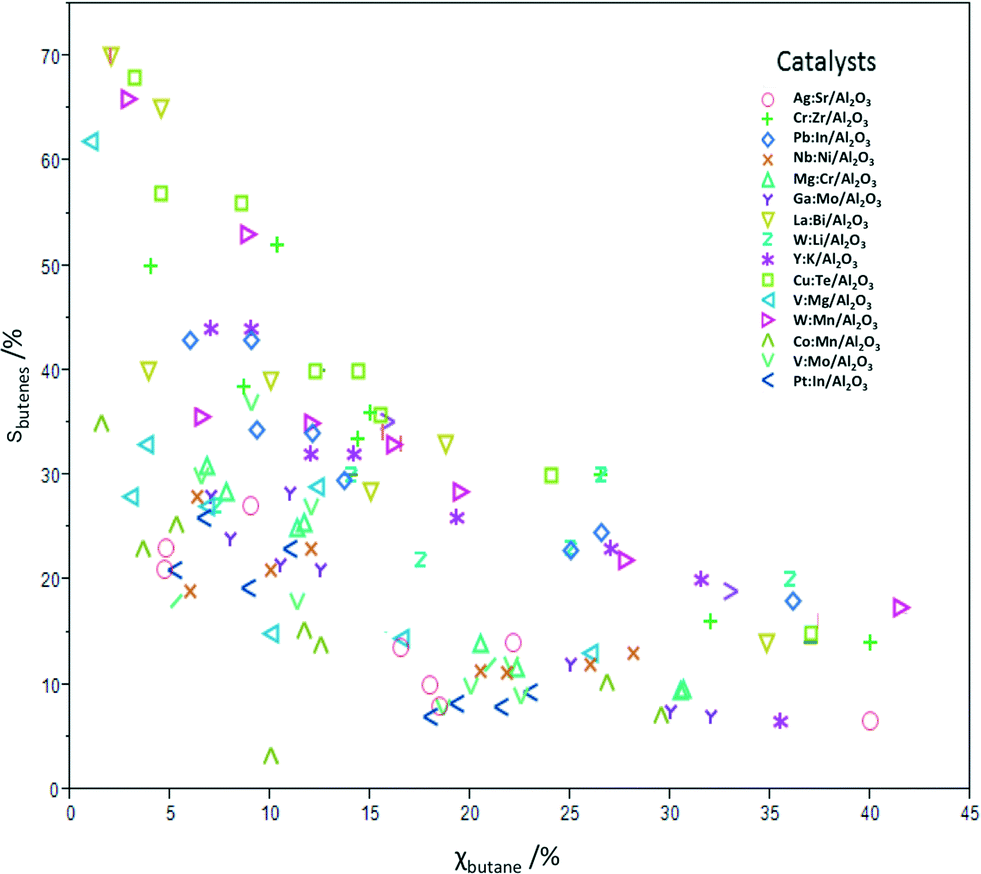 | ||
| Fig. 1 Summary plot showing the percentage total selectivity for butenes vs. the percentage conversion of n-butane for catalysts 1–15 under condition sets A–H. | ||
Choosing relevant catalyst descriptors
In general, there are three approaches for modelling catalyst performance. One option is based on an in-depth analysis of the reaction mechanism, combined with high-level quantum mechanics models. Although these models are computationally very expensive, they often provide accurate data, that can then be used for making good predictions. Examples in heterogeneous catalysis include work from the groups of Nørskov and Bligaard,10 Neurock,26 van Santen27 and Sautet,28 as well as from our group.29 Yet these in-depth models are typically too expensive to be applied to large data sets.The second approach is using purely data-driven models. These “black-box” models are based on statistical analysis, often combined with stochastic optimization methods, such as neural networks or genetic algorithms.23,30 Such models are fast, but connecting their results to ‘chemical intuition’ is difficult, and they cannot adapt well to new factors. Here, we opted for a third approach, using so-called ‘grey models’, that combine simple descriptors based on chemical principles with statistical modelling. As we will show, such models are effective in predicting catalyst performance, giving a good cost-to-benefit ratio.
Previously, we showed that descriptors based on radial distribution functions (RDFs) derived from Slater-type orbitals (STOs) are effective for modelling and predicting the performance of hydrogenation catalysts.31,32 These RDF descriptors are robust. Their calculation is straightforward, and their implementation is easy. Here, we will show that the same approach works also in an oxidative environment, but instead of using the parameters for metals, we now apply the analogous parameters for their oxide salts. This is an important generalizing step – the same paradigm that works well for monometallic and bimetallic catalysts applies also to monometallic oxides and mixed metal oxides.
Basically, we reduce the combined STOs of the frontier orbitals of each metal to four parameters: the distance from the nucleus where the probability of finding the electrons is highest, rapex, the value of the RDF at this distance, Rapex, the peak width at half height, FWHH, and the skewness of the peak, Skew (the latter is calculated as the area on one side of the peak divided by the area on the other side, see Fig. 2). However, considering that the (mixed) oxide system is more complex than the pure metallic one, we introduced three additional parameters as descriptors: electronegativity,33 atomic radius34,35 and ionization potential.36
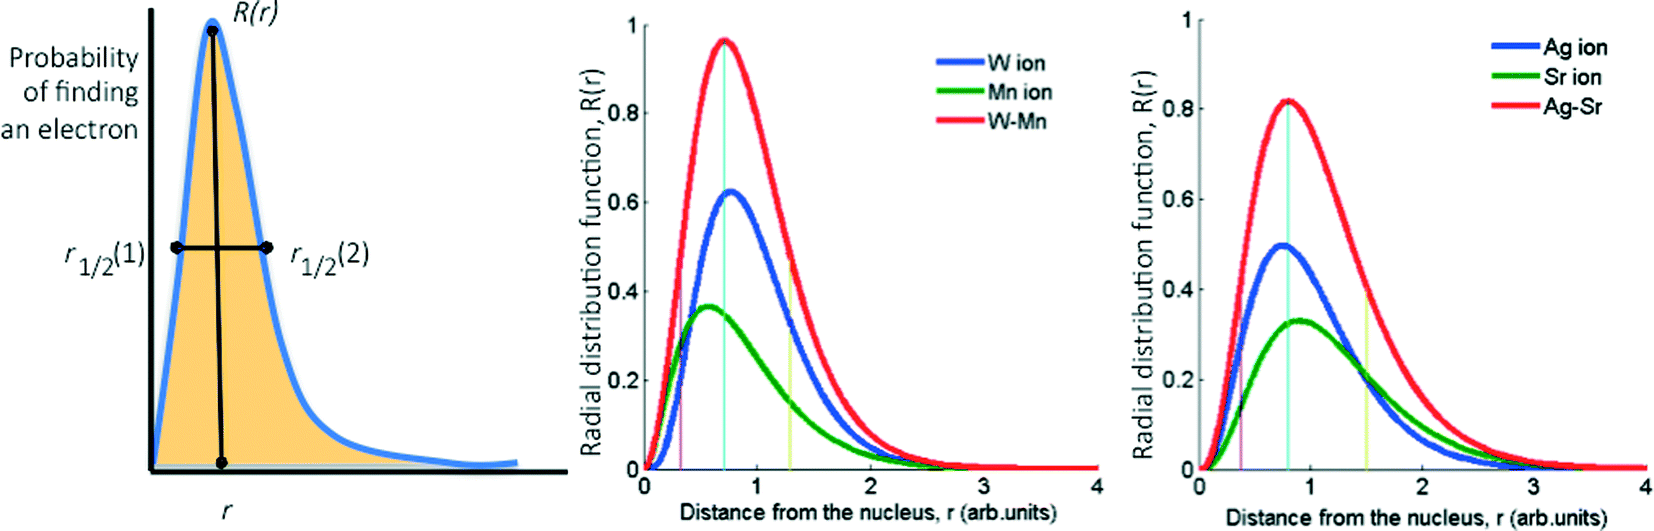 | ||
| Fig. 2 Graphs showing a typical radial distribution function (RDF) based on the Slater-type orbitals used for deriving the four descriptors for (mixed) oxides (left), and examples of these orbitals for AgOx:SrOx/Al2O3 (catalyst 1) and WOx:MnOx/Al2O3 (catalyst 12). | ||
To construct a statistical model that can predict the performance of these mixed oxide catalysts, we first used principal component analysis (PCA) and partial least squares (PLS) regression for distinguishing important parameters from marginal ones. This must be done to avoid over-fitting and ensure that the model will be based on the simplest and most robust parameters (a tutorial on using PCA and PLS in catalysis research is published elsewhere37). Fig. 3 shows a biplot representation based on the PCA analysis. The symbols on the graph show the distribution of the conversion and selectivity for catalysts 1–15 running under reaction conditions A–H. In this graph, the axes are the two first principal components (PCs, also called ‘latent variables’). These two PCs explain 53% of the variance in the data. The arrows indicate the direction and magnitude of the descriptors, the reaction conditions, and the figures of merit. The direction of the arrows gives the relation between the parameters: if two arrows are close together, it means that the two parameters are highly correlated. Similarly, if two arrows are close together yet pointing at opposite directions, it means that the two parameters are inversely correlated. Finally, if two arrows are orthogonal to each other, it means that the two parameters are uncorrelated.
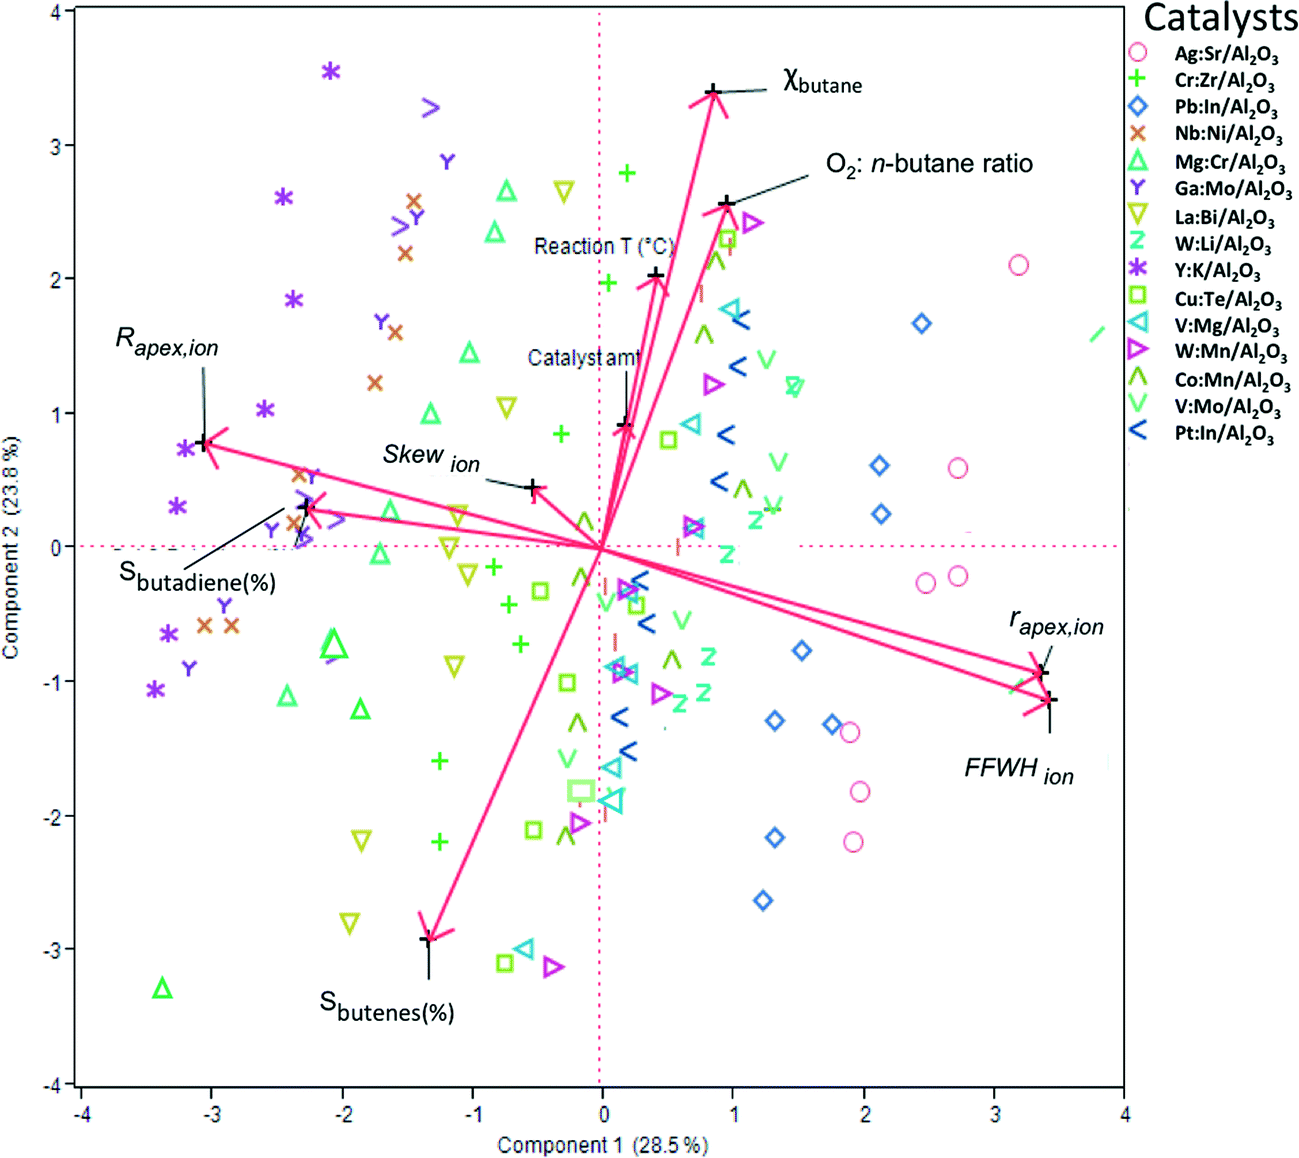 | ||
| Fig. 3 Biplot representation following a principal component analysis (PCA) of the experimental results, showing the distribution of the conversion and selectivity of catalysts 1–15 running under reaction conditions A–H in the space of the two first principal components. Each symbol represents one catalyst under one set of reaction conditions. The arrows indicate the direction and magnitude of the descriptors and the figures of merit. For example, the fact that the FFWHion arrow is opposite to Sbutadiene (%) means that oxides with a higher FFWHion value will give less butadiene. Similarly (and unsurprisingly) the conversion of butane is strongly correlated with the oxygen:butane ratio. | ||
Looking at the biplot in Fig. 3, we see that the conversion of n-butane (χbutane) is very closely grouped with three reaction parameters: catalyst amount, O2:n-butane flow and reaction temperature. Indeed, this is what you would expect. Further, we see that the selectivity of total butene is inverse to χbutane (cf.Fig. 1). Sbutadiene is correlated with the RDF descriptors. It depends directly on the parameters Rapex and Skew, and inversely on rapex and FWHHion. Interestingly, the product selectivity does not depend directly on the reaction conditions. This does not mean that Sbutadiene and Sbutenes are independent of each other. Butenes produced by ODH could be used for making 1,3-butadiene. Fig. 4 shows the loading of each sample on the first two principal components (PC1 and PC2). PC1 is sensitive to the type of catalyst, yet insensitive to any changes in the reaction conditions. This is important, because PC1 explains the largest amount of variance in the data, and the largest change in the production of butadiene comes when you change the catalyst precursor. Conversely, PC2 is much more sensitive to changes in the reaction conditions.
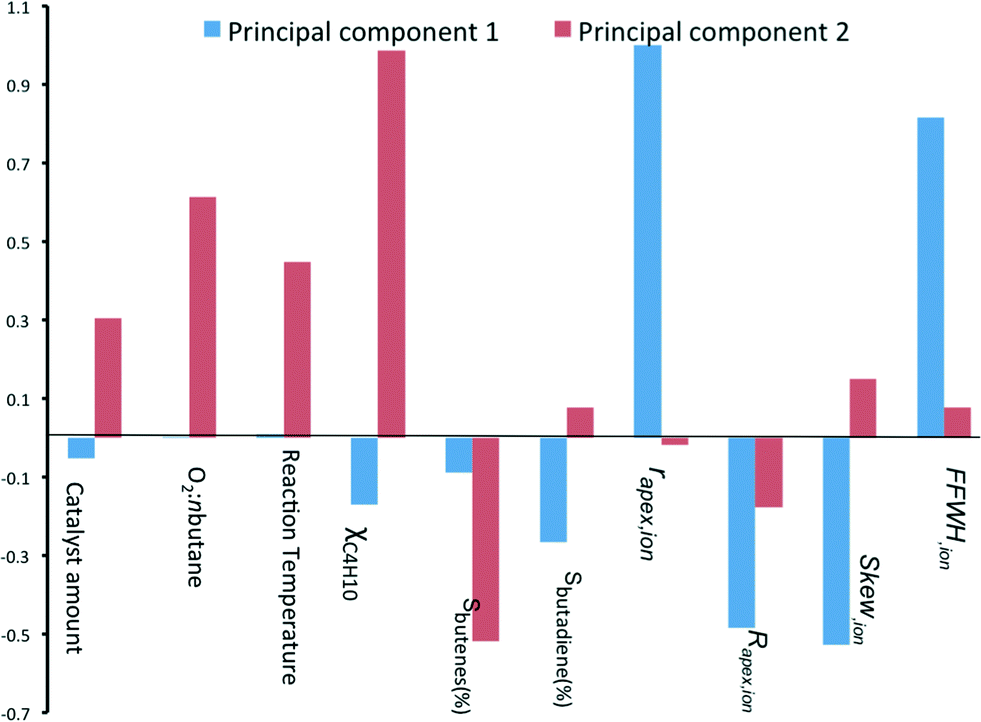 | ||
| Fig. 4 Bar chart showing the loading coefficients of each sample on the two first principal components. | ||
Predicting the performance of new ODH catalysts
Now that we have pinpointed good descriptors for these catalysts, we can use these for building a model for predicting the performance of new catalysts. Therein lies the real value of descriptor models. We use these models for screening a large space of virtual catalysts, and then test in the lab those catalysts for which the model predicts the desired performance (so-called ‘figure of merit’, see flowchart in Fig. 5).19 In this specific case, we are searching for bimetallic supported oxides that will give both high conversion of butane and a high selectivity for 1,3-butadiene. Thus, we want to maximise both χbutane and Sbutadiene. In addition, we need to synthesise and test some catalyst candidates with low predicted values. This may seem counter-productive, and it is always a sore point of discussion with the people who actually carry out the experiments. Yet testing “bad” candidates is essential for confirming the model's viability and robustness over a wide range of data.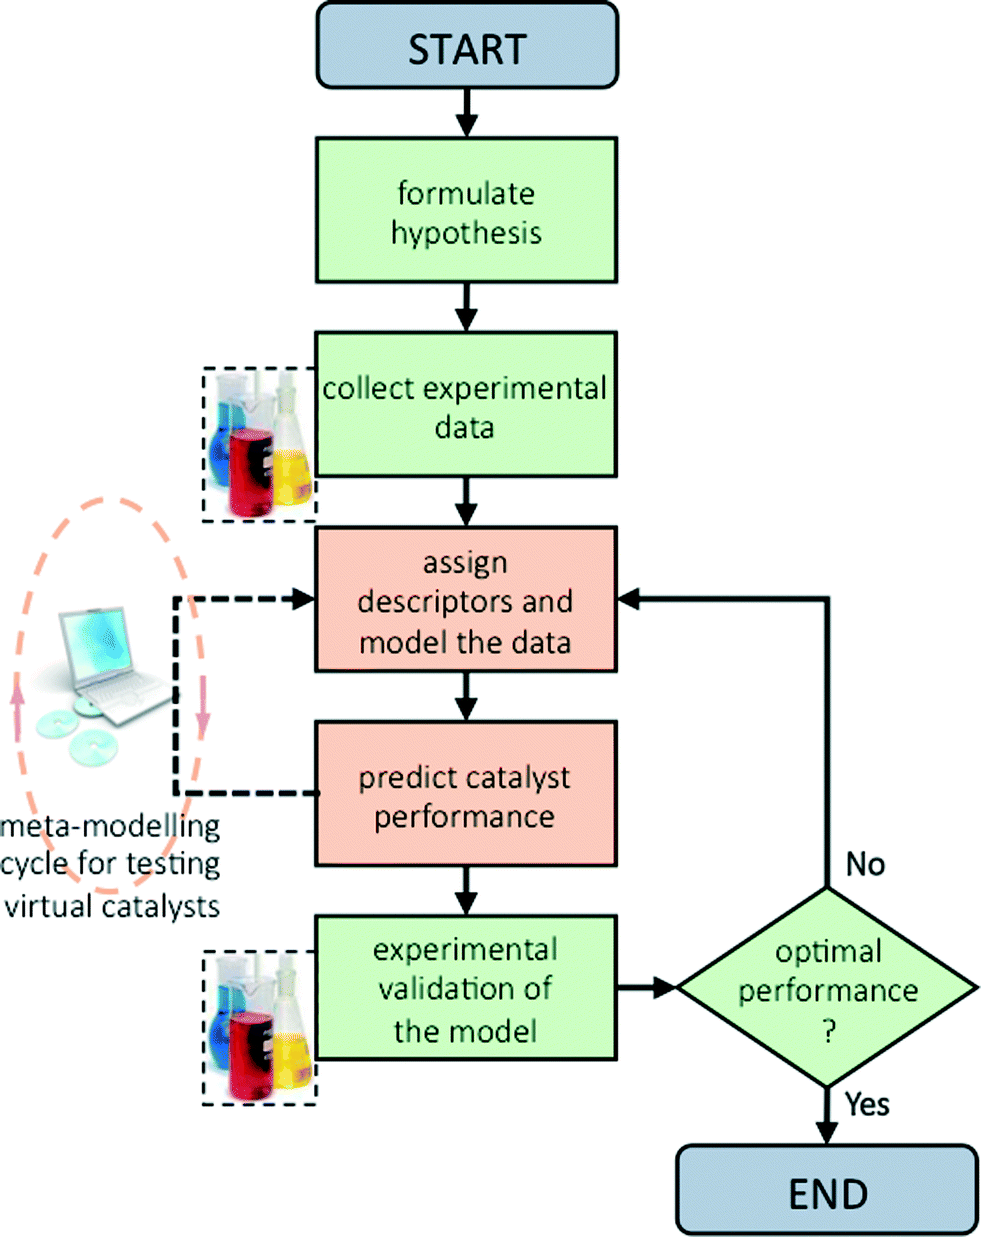 | ||
| Fig. 5 Schematic flowchart showing the iterative process of hypothesis formulation, data collection, regression modelling, screening of virtual catalysts (meta-modelling), and testing in the lab (experimental validation of the model results). | ||
First, we created and modeled our training set of 15 bimetallic supported oxide catalysts (catalysts 1–15). We applied a partial least squares (PLS) regression model, using the descriptor values based on the metal ion STOs as input. These differ from the pure metal STOs that we used earlier for modelling hydrogenation catalysts.16 The reason is that the pristine catalysts are metal oxides, and in an oxidative environment, metal(0) species are unlikely. The correlation coefficients (see Fig. 6) using the metal ion STOs were good: R2 = 0.865 for χbutane and R2 = 0.610 for Sbutadiene. These numbers may seem low, but they are actually impressive, especially considering the simplicity of the descriptors, and the fact that no interaction parameters were included for these bimetallic oxides. Control experiments showed that the correlation with metal(0) STO descriptors was much lower, R2 = 0.5748 for χbutane and 0.2321 for Sbutadiene, respectively, confirming the hypothesis that oxide models are more suitable for modelling metal oxides than pure metal models. All of the models were validated using leave-one-out cross-validation.
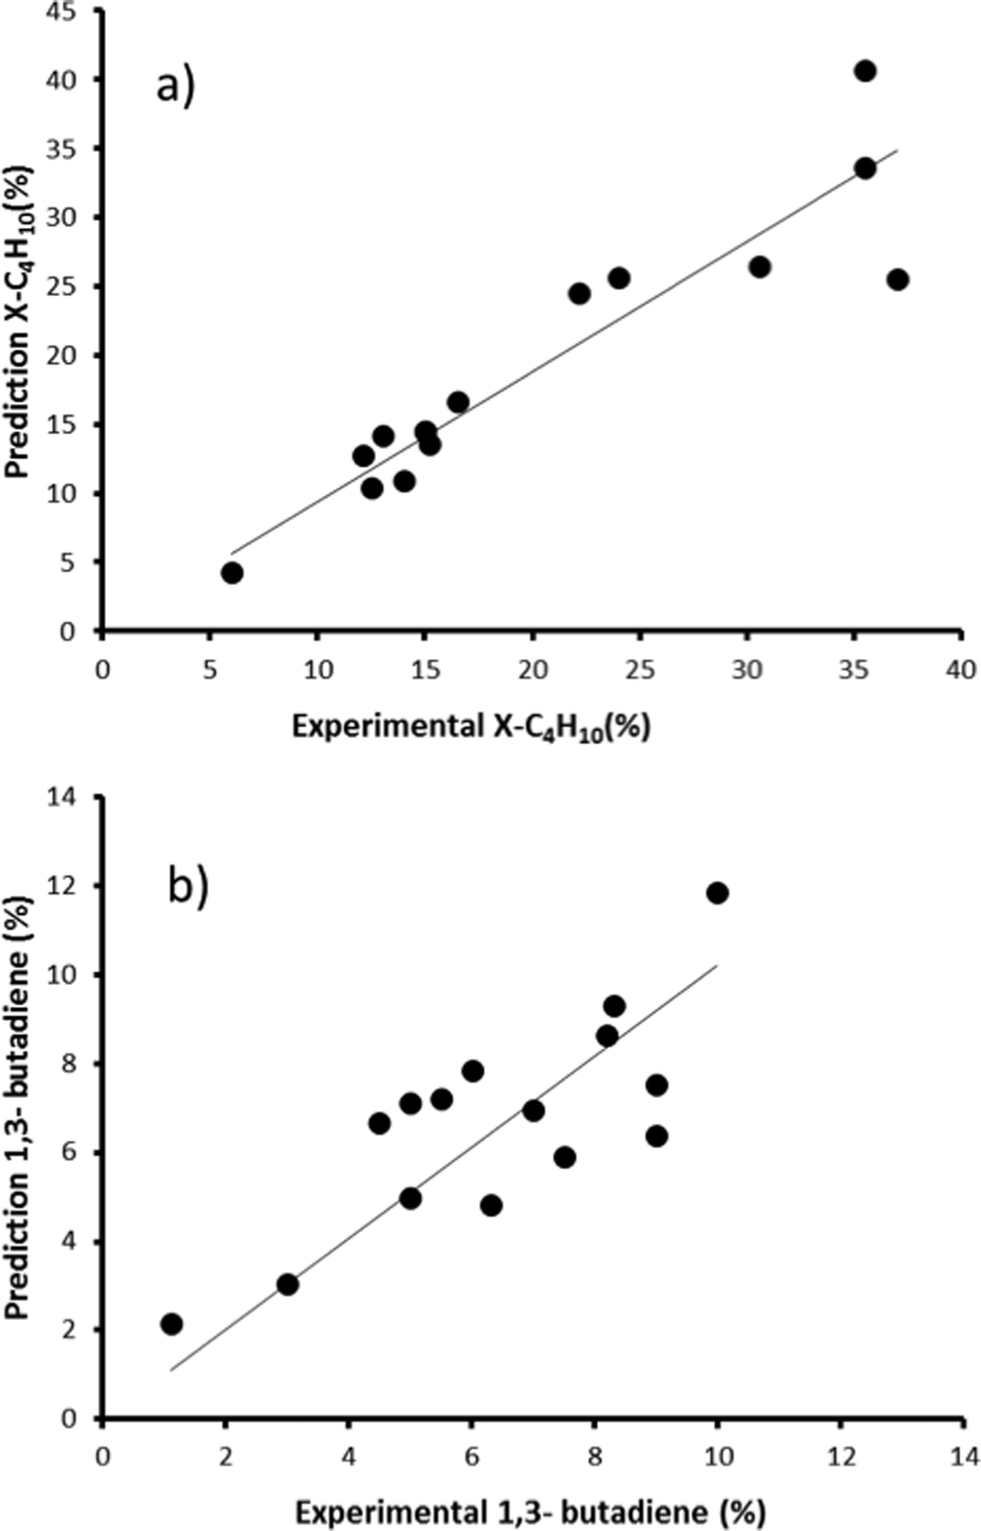 | ||
| Fig. 6 Predicted vs. experimental values for χbutane (%, graph a) and Sbutadiene (%, graph b) obtained using the bimetallic oxide catalysts 1–15. | ||
We then created a large set of virtual bimetallic oxides, comprised of 1711 bimetallic combinations of 59 elements in total (see Fig. 7). Calculating the descriptor values for these 1711 virtual catalysts is very fast (especially as there are no interaction parameters). It takes only seconds using a simple laptop. We then projected the results of the descriptor models for the 1711 virtual catalysts on the set of the 15 real catalysts, and selected six bimetallic supported oxides catalysts. These were then synthesized and tested in the lab. Fig. 8 shows the so-called parity plot of the predicted vs. the experimental results, both for the conversion of butane and the selectivity to 1,3-butadiene. The plot shows that there is a good fit between the model's predictions and the actual experimental data. Note that we selected not only catalysts with an expected high performance (high conversion and selectivity) but also ones for which we had low expectations. This is important, because it shows the wide operational range of the model. There is an understandable bias in published papers towards good results – publishing papers about badly performing catalysts is a tough sell, but if you want to predict the performance of catalysts, your model should cover a wide range. This means testing both good and bad candidates.
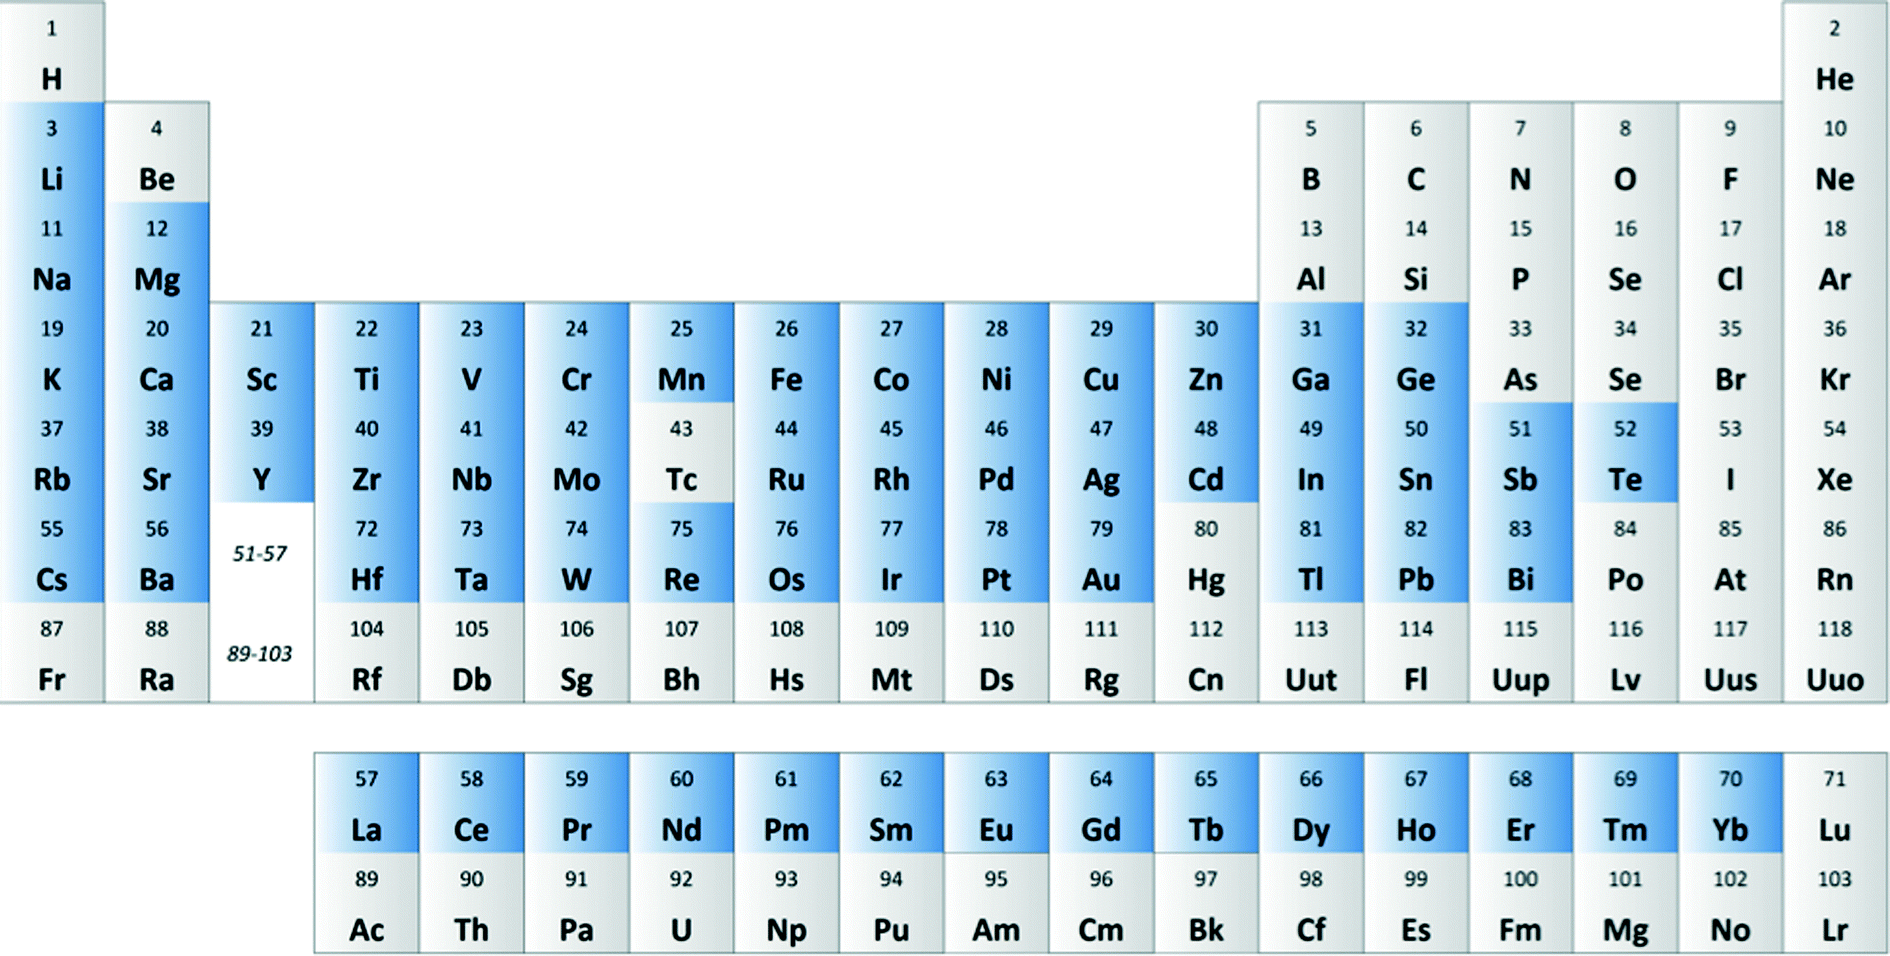 | ||
| Fig. 7 Periodic table showing the 59 metals used for creating the 1711 bimetallic oxide catalyst combinations in silico. | ||
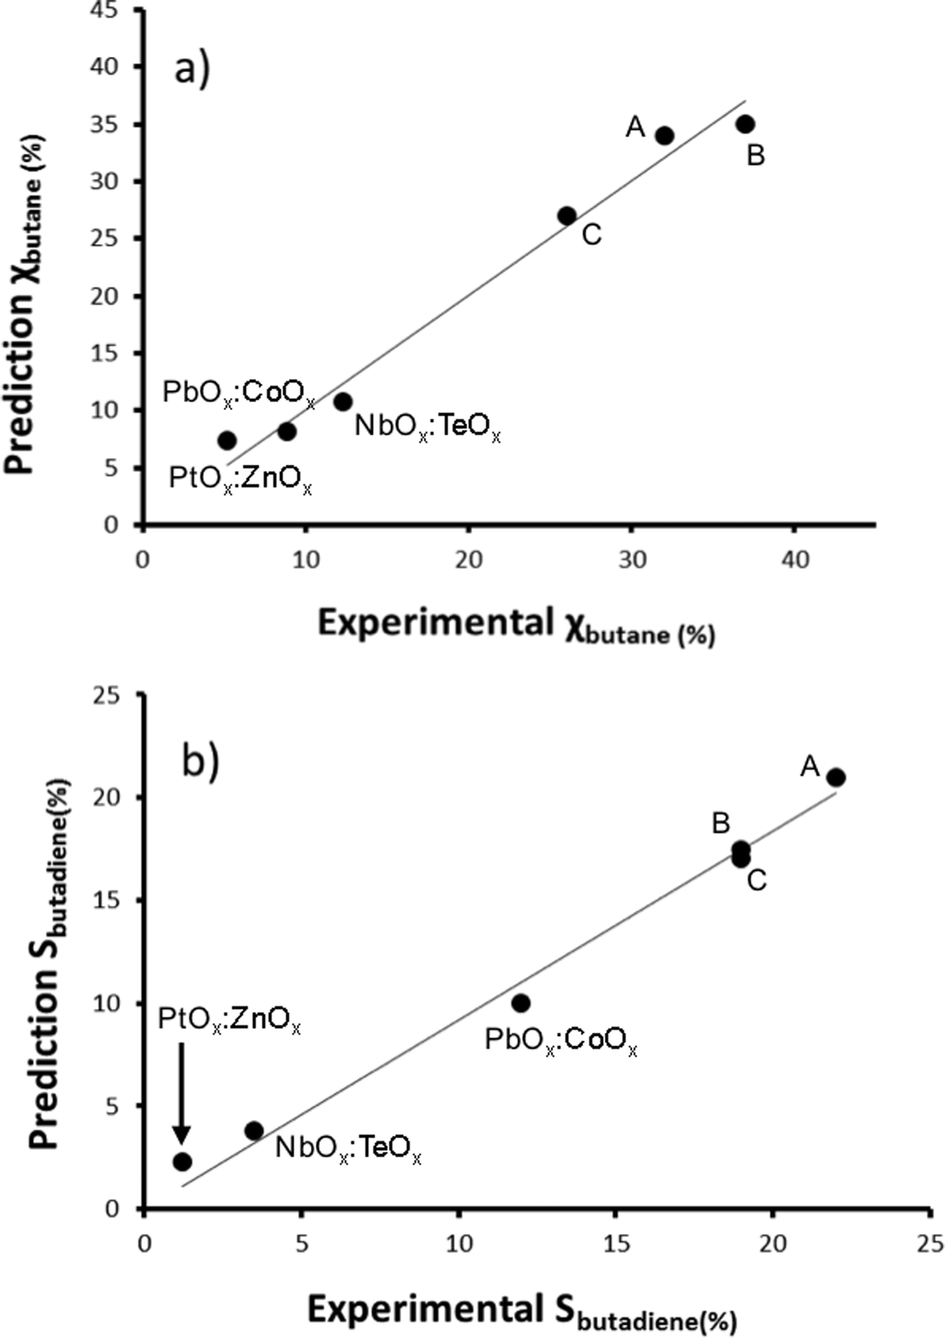 | ||
| Fig. 8 Parity plot showing the predicted vs. experimental butane conversion (a) and 1,3-butadiene selectivity (b) of the six new bimetallic oxide catalysts that were synthesised following the model's predictions. The formulas of catalysts A–C cannot be disclosed for proprietary reasons. Reaction conditions: each reactor was loaded with 100 mg catalysts. All catalysts were first activated in situ before each reaction in a flow of 45 ml min−1 Ar and 5 ml min−1 O2 at 500 °C. After activation, a feed of 50 ml min−1 was passed for 24 h in each reactor, with an O2:C4H10:Ar volumetric ratio of 1:1:8. Conversion and selectivity were monitored by GC and on-line MS (see the Experimental section for details). | ||
The good performance of the models in the case of mixed metal oxide raises the question of the importance (or in this case, lack of importance) of the interaction parameter. Basically, if no interaction parameter is included, it means that the model is limited to a linear combination of the effects of oxide A and oxide B. That is, for a catalyst containing two metals, M1 and M2, the figure of merit would be FOM = f(M1Ox) + f(M2Ox), giving some weighted average of the effects of the two oxides. This does not necessarily mean that there is no interaction effect at all. Rather, it may reflect the fact that these catalysts contain relatively little active material, 1 wt% of M1 and 1 wt% of M2. When these are impregnated on the alumina support and calcined, the actual sites where mixing occurs between the oxides are probably few and far between (see Fig. 9, left). In such a case, the weighted average would give (and indeed gives) a good description of the catalytic properties of the surface. Avoiding the interaction term in the model makes sense, because such a second-order term would increase the chances of over-fitting. In the case of a main metal and a promoter metal (see example in Fig. 9, right) there may be more justification for including interaction parameters (e.g. in the dehydrogenation of alkanes catalysed by Pt/Sn).
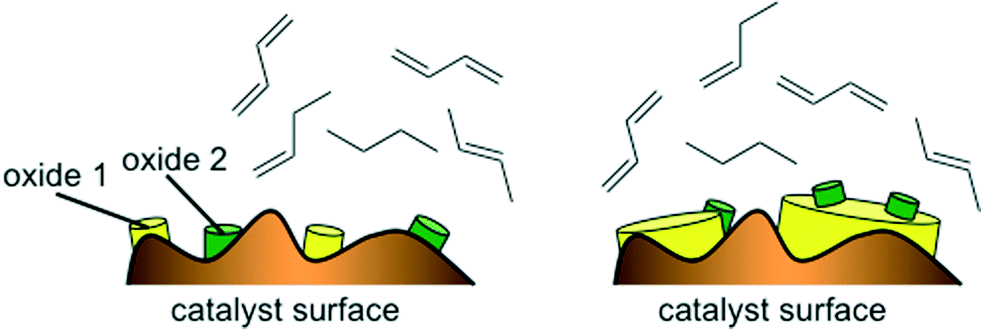 | ||
| Fig. 9 Cartoons of a catalyst surface containing small amounts of two oxides, where the chances of formation of a mixed oxide are lower (left) and of a second catalyst surface containing large amounts of a main oxide and small amounts of dopant, where the chances of formation of a mixed oxide sites are higher (right). | ||
Conclusions
Complex catalytic reactions such as the oxidative dehydrogenation of butane to butenes and butadiene can be modeled efficiently using heuristic descriptor models. These data-driven models are ‘quick & dirty’ – they cost practically zero in computer time, yet deliver surprisingly accurate results. The fact that such models work well also under oxidation conditions may not surprise mathematicians, who consider a model's performance as a function with a figure of merit and residuals. But for chemists, this means that the RDF descriptors based on Slater-type orbitals can now be applied across a wide range of catalytic processes. Since they perform well for metal(0) catalysts and metal oxides, they should in principle also do well in predicting the activity and selectivity of metal sulfides, nitrides and carbides. We hope that this work will encourage colleagues in academia and industry to apply these models as they search for new, active, selective and robust catalytic materials.Acknowledgements
We thank Ing. N. J. Geels, Ing. P. F. Collignon and Dr. M. C. Mittelmeijer-Hazeleger (UvA) for technical support, Dr. E. J. Ras and Dr. A. G. Maldonado for discussions, and LANXESS Deutchland GmbH Deutschland for funding. This work is part of the Research Priority Area Sustainable Chemistry of the UvA, http://suschem.uva.nl.References
- G. Rothenberg, Catalysis: Concepts and Green Applications, Wiley-VCH, Weinheim, 2008 Search PubMed.
- B. D. Chandler and J. D. Gilbertson, Top. Organomet. Chem., 2006, 20, 97–120 CrossRef CAS.
- S. H. A. M. Leenders, R. Gramage-Doria, B. de Bruin and J. N. H. Reek, Chem. Soc. Rev., 2015, 44, 433–448 RSC.
- P. Wentworth, Jr. and K. D. Janda, Cell Biochem. Biophys., 2001, 35, 63–87 CrossRef.
- D. Farrusseng, S. Aguado and C. Pinel, Angew. Chem., Int. Ed., 2009, 48, 7502–7513 CrossRef CAS PubMed.
- J. Beckers, C. Gaudillere, D. Farrusseng and G. Rothenberg, Green Chem., 2009, 11, 921–925 RSC.
- J. A. Hageman, J. A. Westerhuis, H.-W. Fruehauf and G. Rothenberg, Adv. Synth. Catal., 2006, 348, 361–369 CrossRef CAS.
- M. Foscato, G. Occhipinti, V. Venkatraman, B. Alsberg and V. R. Jensen, J. Chem. Inf. Model., 2014, 54, 767–780 CrossRef CAS PubMed.
- J. P. Dacquin, H. E. Cross, D. R. Brown, T. Duren, J. J. Williams, A. F. Lee and K. Wilson, Green Chem., 2010, 12, 1383 RSC.
- J. K. Nørskov, T. Bligaard, J. Rossmeisl and C. H. Christensen, Nat. Chem., 2009, 1, 37–46 CrossRef PubMed.
- F. Calle-Vallejo, D. Loffreda, M. T. M. Koper and P. Sautet, Nat. Chem., 2015 Search PubMed , Ahead of Print.
- H. Li, E. N. Brothers and M. B. Hall, Inorg. Chem., 2014, 53, 9679–9691 CrossRef CAS PubMed.
- E. V. Kondratenko, M. Schlueter, M. Baerns, D. Linke and M. Holena, Catal. Sci. Technol., 2015, 5, 1668–1677 CAS.
- M. M. Montemore and J. W. Medlin, Catal. Sci. Technol., 2014, 4, 3748–3761 CAS.
- K. C. Harper, S. C. Vilardi and M. S. Sigman, J. Am. Chem. Soc., 2013, 135, 2482–2485 CrossRef CAS PubMed.
- E.-J. Ras, M. J. Louwerse and G. Rothenberg, Catal. Sci. Technol., 2012, 2, 2456–2464 CAS.
- E.-J. Ras, M. J. Louwerse, M. C. Mittelmeijer-Hazeleger and G. Rothenberg, Phys. Chem. Chem. Phys., 2013, 15, 4436–4443 RSC.
- J. Beckers and G. Rothenberg, Dalton Trans., 2008, 6573–6578 RSC.
- N. Madaan, R. Haufe, N. R. Shiju and G. Rothenberg, Top. Catal., 2014, 57, 1400–1406 CrossRef.
- J. Pérez-Ramírez, R. J. Berger, G. Mul, F. Kapteijn and J. A. Moulijn, Catal. Today, 2000, 60, 93–109 CrossRef.
- J. A. Hageman, J. A. Westerhuis, H.-W. Frühauf and G. Rothenberg, Adv. Synth. Catal., 2006, 348, 361–369 CrossRef CAS.
- G. Rothenberg, Catal. Today, 2008, 137, 2–10 CrossRef CAS.
- J. Beckers, F. Clerc, J. H. Blank and G. Rothenberg, Adv. Synth. Catal., 2008, 350, 2237–2249 CrossRef CAS.
- G. Rothenberg, E. A. de Graaf and A. Bliek, Angew. Chem. Int. Ed., 2003, 42, 3366–3368 CrossRef PubMed.
- J. H. Blank, J. Beckers, P. F. Collignon, F. Clerc and G. Rothenberg, Chem. Eur. J., 2007, 13, 5121–5128 CrossRef CAS PubMed.
- M. J. Janik, K. A. Campbell, B. B. Bardin, R. J. Davis and M. Neurock, Appl. Catal., A, 2003, 256, 51–68 CrossRef CAS.
- R. A. van Santen, Chem. Eng. Sci., 1990, 45, 2001–2011 CrossRef CAS.
- F. Calle-Vallejo, J. I. Martinez, J. M. Garcia-Lastra, P. Sautet and D. Loffreda, Angew. Chem. Int. Ed., 2014, 53, 8316–8319 CrossRef CAS PubMed.
- M. J. Louwerse and G. Rothenberg, ACS Catal., 2013, 3, 1545–1554 CrossRef CAS.
- E. N. Dragoi, C. A. Horoba, I. Mamaliga and S. Curteanu, Chem. Eng. Process., 2014, 82, 173–184 CrossRef CAS.
- E.-J. Ras, B. McKay and G. Rothenberg, Top. Catal., 2010, 53, 1202–1208 CrossRef CAS.
- E.-J. Ras, M. J. Louwerse and G. Rothenberg, Catal. Sci. Technol., 2012, 2, 2456–2464 CAS.
- K. Li and D. Xue, J. Phys. Chem. A, 2006, 110, 11332–11337 CrossRef CAS PubMed.
- R. D. Shannon and C. T. Prewitt, Acta Cryst. Sect. B., 1969, 25, 925 CrossRef CAS.
- R. D. Shannon and C. T. Prewitt, J. Inorg. Nucl. Chem., 1970, 32, 1427–1441 CrossRef CAS.
- C. Kittel, Introduction to Solid State Physics, Wiley, New York, 2005 Search PubMed.
- E.-J. Ras and G. Rothenberg, RSC Adv., 2014, 4, 5963–5974 RSC.
| This journal is © The Royal Society of Chemistry 2016 |