 Open Access Article
Creative Commons Attribution 3.0 Unported Licence
In command of non-equilibrium†
Emil
Roduner
*ab and
Shankara Gayathri
Radhakrishnan
a
aChemistry Department, University of Pretoria, Pretoria 0002, Republic of South Africa
bInstitute of Physical Chemistry, University of Stuttgart, Pfaffenwaldring 55, D-70569 Stuttgart, Germany. E-mail: e.roduner@ipc.uni-stuttgart.de
First published on 5th May 2016
Abstract
The second law of thermodynamics is well known for determining the direction of spontaneous processes in the laboratory, life and the universe. It is therefore often called the arrow of time. Less often discussed but just as important is the effect of kinetic barriers which intercept equilibration and preserve highly ordered, high energy non-equilibrium states. Examples of such states are many modern materials produced intentionally for technological applications. Furthermore, all living organisms fuelled directly by photosynthesis and those fuelled indirectly by living on high energy nutrition represent preserved non-equilibrium states. The formation of these states represents the local reversal of the arrow of time which only seemingly violates the second law. It has been known since the seminal work of Prigogine that the stabilisation of these states inevitably requires the dissipation of energy in the form of waste heat. It is this feature of waste heat dissipation following the input of energy that drives all processes occurring at a non-zero rate. Photosynthesis, replication of living organisms, self-assembly, crystal shape engineering and distillation have this principle in common with the well-known Carnot cycle in the heat engine. Drawing on this analogy, we subsume these essential and often sophisticated driven processes under the term machinery of life.
Key learning points1. Spontaneous processes occur only in the presence of gradients, and they are generally associated with heat dissipation. The latter is related to the thermodynamic condition of increasing entropy of the universe.2. In addition to the thermodynamic criteria for spontaneous processes there is a kinetic constraint: activation barriers limit the rate of entropy production and preserve non-equilibrium states. Life is a non-equilibrium state with thousands of reactions with well-balanced barriers towards equilibrium. 3. Local highly ordered low-entropy non-equilibrium states can form spontaneously when the local entropy loss is compensated elsewhere. This sometimes requires a sophisticated mechanism. 4. In solar cells or in photosynthesis, photons (sunlight) excite equilibrium states and in this way fuel the formation of non-equilibrium states which are stabilised behind a barrier by heat dissipation. If an ordered state is reached by crystallisation or by self-assembly it is the enthalpy of aggregation that is dissipated. 5. Self-assembly in polar media is a consequence of the hydrophobic effect and an entropy driven, temperature dependent process. |
1. Introduction and fundamental principles
1.1 Motivation for this tutorial review
We all learn the second law of thermodynamics that expresses an increase of the entropy of the universe, dSuniverse > 0, as a criterion for processes to occur spontaneously (or irreversibly), i.e. without input of energy in the form of e.g. heat, work, or light. We then learn that a decrease of free energy, dGsystem < 0, is also a criterion for the spontaneity of processes, and we often forget how the two criteria are related. Since we might not be comfortable with inequalities we quickly replace the corresponding mathematical symbols by equal signs. This means that we disregard the irreversibility and look only at reversible processes; for example we calculate reversible efficiencies of heat engines or of heat pumps. We ignore that the reversible processes are not really processes but stationary states (i.e. equilibrium or metastable states which do not evolve in time). Thus, an engine at equilibrium does not run, and its efficiency is therefore meaningful at best as an asymptotic value. In reality, it is the inequality signs which make life possible.So if the entropy of the universe increases for spontaneous processes, why then does water freeze to ice spontaneously at night, why does salt crystallise when a saturated warm solution cools, why can living organisms reproduce, and why can photosynthesis make sugar from CO2 and water? In all these examples the products have lower entropy, so the processes occur against the arrow of time and seem to contradict the second law. Furthermore, in our laboratory work we constantly synthesise complex molecules, we separate mixtures by distillation and we make high symmetry ordered structures. Crystals of a certain composition have a well-known equilibrium structure, but often many other structural or morphological modifications are known and seemingly stable. By crystal shape engineering we can make multiple non-equilibrium shapes, just as nature does it when it makes snowflakes. Clearly, activation barriers prevent the non-equilibrium forms from equilibrating, and kinetic arguments are just as important as the above thermodynamic criteria.
In order to be successful as chemists in the lab we have to understand these principles and play with thermodynamic versus kinetic control. The present Tutorial Review is intended to help in this respect.
1.2 The first law of thermodynamics: conservation of energy
In thermodynamics one distinguishes (i) open systems which can exchange matter as well as energy with the environment, (ii) closed systems which can only exchange energy, and (iii) isolated systems which can exchange neither matter nor energy. An ideal isolated system is the entire universe.The laws of thermodynamics describe generally accepted empirical facts to which no exceptions have been found. The first law states the principle of conservation of energy, adapted to thermodynamic systems. For any process in a closed system the change in internal energy dU equals the change in heat δQ added to the system plus the work δW done by the system:
| dU = δQ + δW | (1) |
1.3 The second law of thermodynamics: a criterion that processes can occur spontaneously
While the direction of mechanical processes which obey the first law can be reversed (e.g. the oscillation of a pendulum) this is not the case for processes of thermodynamic systems. For example, heat is transferred spontaneously from a hot to a cold body, or two ideal gases mix, but the time-reversed processes are possible only when work is spent on the system. It was found that there exists a new state function called thermodynamic entropy S (the term entropy was introduced 1865 by Clausius) and its change dS is related to the exchanged heat and the absolute temperature as: | (2) |
 | (3) |
It is awkward to have to consider the entire universe for a judgement of spontaneity of a reaction. Therefore, the criterion of eqn (3) was rewritten for the special conditions of processes at constant temperature and pressure (for a derivation see the ESI†). Under these conditions which are obeyed quite well for most experiments in the laboratory and in particular for processes in living organisms the spontaneity criterion that is familiar to all chemists is given by the Gibbs free energy change
| dG ≤ 0, | (4) |
Eqn (3) requires that the entropy of the universe increases for a spontaneous process. However, we know of many spontaneous processes in which a more ordered state is formed, e.g. when water freezes in a cold night, when salt crystallises, or in fact when living organisms (considered states of low entropy) reproduce. That lowering of entropy in part of the universe (the ‘system’) is not in contradiction to the second law is easily seen when we rewrite eqn (4) as
| dG = dH − TdS ≤ 0, | (5a) |
| ΔG = ΔH − TΔS ≤ 0. | (5b) |
1.4 Dissipative systems
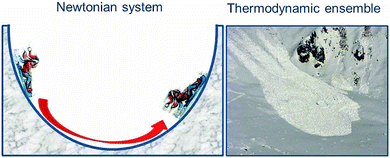
We have already addressed the pendulum which in the absence of friction oscillates indefinitely so that potential and kinetic energies interconvert continuously. Such systems are well understood on the basis of Newtonian mechanics. In contrast, thermodynamic systems differ from the systems of classical mechanics because they consist of extremely large numbers of atoms or molecules. In principle, the particles all follow classical Newtonian mechanics, although to some extent influenced by their quantum nature. It would be a huge task to monitor and describe the trajectories of all these particles separately, and the result would be difficult to understand. However, we are interested only in the averages of properties, and these are reflected in the thermodynamic parameters. For example, the heat content of matter reflects the average of the kinetic energy of all individual atoms and molecules. So why does the classical system oscillate about its equilibrium position, the minimum of potential energy, while the thermodynamic system shows monotonic behaviour and comes to rest when it reaches the equilibrium point? The difference is illustrated in Fig. 1, which shows the classical system by the pendulum-like motion of the child on the sledge and contrasts it with the motion of an avalanche which consists of a large number of tiny snow crystals, similar to an ensemble of atoms or molecules. The kinetic energy of the initially directed motion of these snow crystals gets randomised in many collisions, resembling the random motion of the particles in a chemical sample. In other words, the kinetic energy is dissipated as heat, and back conversion to a coherent motion up the opposite side of the valley is impossible. Therefore, chemical systems come to rest at equilibrium where the Gibbs free energy G assumes its minimum value, and the reaction energy is dissipated in collisions among the particles or with a solvent or any other heat bath. This dissipation of energy is a key feature in the present context.Nevertheless, it should be noted that chemical reactions do exist which show periodic or even chaotic oscillations in time and dynamic spatial pattern formation, pretending to contradict the above principle of unidirectional, monotonic behaviour of thermodynamic systems. Oscillating reaction systems are understood to be controlled by coupled non-linear kinetic equations and fuelled by a normal one-sided monotonic chemical reaction which comes to rest at equilibrium. A well-known example is the Belousov–Zhabotinsky reaction, fuelled by the oxidation of malonic acid in the presence of bromate which in the presence of the redox indicator ferroin results in spectacular red-blue colour oscillations in a stirred system or in spatially evolving wave fronts and spirals if conducted in an unstirred Petri dish.2
At equilibrium there is no longer a driving force for things to occur. Although it may be interpreted in a dynamic sense by equal conversion rates in the forward and backward directions, equilibrium represents a dead end of evolution. Once all processes in the universe have come to equilibrium the entropy of the universe has reached a maximum, and all energy has been converted and dissipated as heat. This is sometimes called the heat-death of the universe (see below).
1.5 The kinetic control of processes
From the last chapter we have a thermodynamic criterion for processes to occur spontaneously. This is a much discussed factor in the discussion of the origin and the evolution of life. It is a necessary but not a sufficient criterion. What is often overlooked in this context is that many chemical processes are activated, and that activation energies can be too high and prevent reactions to occur at noticeable rates. In fact, our body is not in equilibrium with its environment. Thermodynamically speaking, biomaterials react spontaneously with oxygen to produce mostly carbon dioxide and water. We should therefore be glad that the barriers preventing oxidation are sufficiently high so that we have some time to live before we end up in equilibrium. A glimpse of the involved complexity may be obtained from the metabolic scheme of fructose displayed in Fig. 2 which must be seen in the larger context of the highly complex network shown in Fig. S1 of the ESI.† The full scheme has many entry points for various substrates, including the components of nutrition and molecular oxygen from respiration, and CO2 and water are produced at multiple exit points of the scheme. The mass balance which holds of course for each element in the entire scheme of Fig. 2 and Fig. S1 (ESI†) provides a coupling between the multitudes of reactions. Many of the reaction sequences are parts of biochemical cycles since enzymes are catalysts which are regenerated. Furthermore, the chemistry of life is based on redox reactions, i.e. successive transfers of electrons and protons represent electrochemical half-cell reactions which can be written as a scheme of coupled, closed electrical circuits.3,4 The concentrations of reactants in these schemes may be constant and at a first glance represent equilibrium conditions. However, considering the constant flow of incoming substrates and outgoing combustion products the system is more accurately described as a stationary state, far from equilibrium and often superimposed by oscillations since cyclic pathways represent feedback loops which introduce non-linearity into the kinetics. Even if the system as a whole is far from equilibrium, some of its subsystems may be regarded as local equilibria, e.g. those governed by acid–base reactions which are non-activated and adjust immediately to new boundary conditions. Life may therefore be called a complex non-equilibrium state involving thousands of well-balanced reactions which were established during the evolution over millions of years.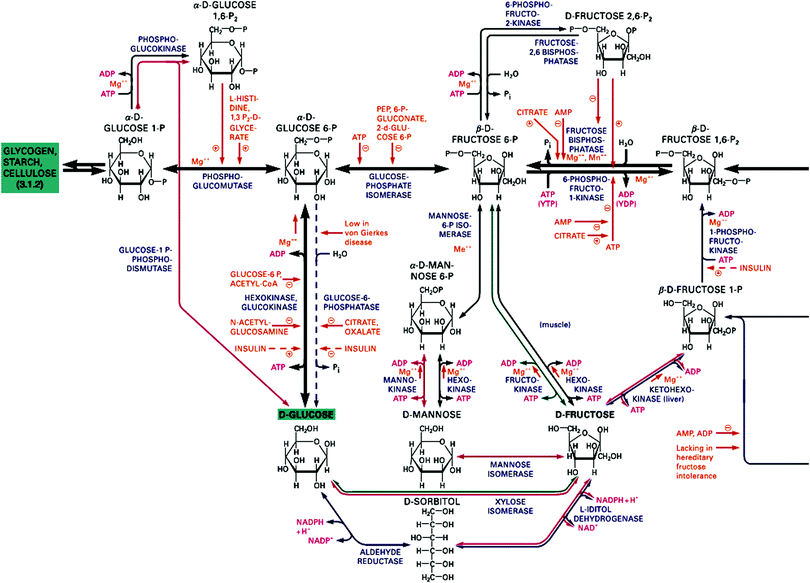 | ||
| Fig. 2 Section of the fructose metabolism in the human body to be seen in context of the full scheme of metabolic pathways in Fig. S1 of the ESI.† Reprinted from ref. 5. Copyright (2012) John Wiley & Sons, Inc. | ||
Periodic physiological behaviours like menstruation, day–night cycles or breeding and migration of birds are well known. Aiming at an understanding of the control mechanisms of metabolic oscillations, Semenov et al. have recently designed a rational synthetic enzymatic reaction network and investigated the influence of the concentrations of reaction partners on the frequencies, amplitudes and damping behaviour of the oscillations.6Fig. 3 shows an example of the oscillation of the active version of the enzyme trypsin in the presence of an inhibitor (see original work for details).
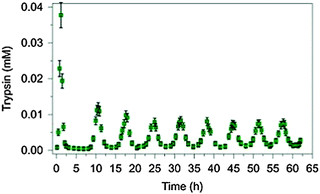 | ||
| Fig. 3 Pronounced sustained oscillation of the concentration of the enzyme trypsin for a period of 6.5 h in an artificially constructed tuneable dissipative chemical reaction network. Reprinted with permission from Macmillan Publishers Ltd: Nature Chemistry (ref. 6), copyright (2015). | ||
All reactions in living systems occur at the identical physiological temperature of around 310 K in the human organism. Although temperature is not a variable there are different ways to adjust the substrate turnover rates: first of all, the activation energies of the rate constants can be tuned independently by the type of catalyst (enzyme) that is used.7 Secondly, for elementary reactions the rates are proportional to the concentrations of the reaction partners which are linked across the entire reaction scheme. For enzymatic reactions, however, the rates are normally proportional to the substrate concentration only as long as these are low, but at high substrate concentrations all active sites of the enzyme are occupied and the enzyme works at its maximum capacity. In this case the substrate conversion rate is constant (i.e. the kinetics is of zero-order). Furthermore, fast reactions may be limited by diffusion which restricts the rate of encounter of reaction partners.
1.6 Boltzmann's statistical definition of entropy
As stated above, thermodynamic properties represent averages over all particles in the system. In a quantum system, the particles populate the quantum states of different energies in such a way that their average energy is consistent with the thermodynamic internal energy. The distribution function which represents the weighting of the states is called the Boltzmann distribution. There are many different ways to distribute the particles and satisfy this constraint of the average energy. Entropy is a measure of how many states are accessible at a given temperature; it therefore increases with temperature.In the early 1870s, Ludwig Boltzmann realised the logarithmic dependence of the entropy S on the number of possible ways W (this symbol derives from the German word ‘Wahrscheinlichkeit’ for probability and has nothing to do with W for ‘work’ in eqn (1)) that the particles can be distributed (or dispersed) in distinguishable ways, and he expressed the relation as
S = k![[thin space (1/6-em)]](https://www.rsc.org/images/entities/char_2009.gif) ln ln![[thin space (1/6-em)]](https://www.rsc.org/images/entities/char_2009.gif) W. W. | (6) |
 | ||
| Fig. 4 Boltzmann's gravestone with bust and engraved entropy equation at the Zentralfriedhof in Vienna. | ||
Eqn (6) looks quite different from eqn (2), with W being a dimensionless number ≥1. It is important to keep in mind that in thermodynamic systems it describes the distribution over states of different energy; it thus contains a hidden dependence on heat and temperature which appear explicitly in eqn (2). Statistical thermodynamics using probability theory to describe this distribution over states relates Boltzmann's formula to thermodynamic entropy of eqn (2).
However, Boltzmann's formula implies that also distributions over energetically degenerate states involve different entropies if they occur with different probabilities even though there is no heat exchange involved in going from one distribution to another. This additional contribution is often called configurational or logical entropy. In this case, large entropy, and thus also W in eqn (6), is often associated with a higher degree of disorder.8 The two forms of entropy, configurational and thermodynamic entropy, have led to much confusion and require clarification. A common misconception is explained in Fig. 5 based on the checkerboard and on two states of an atomic cluster.
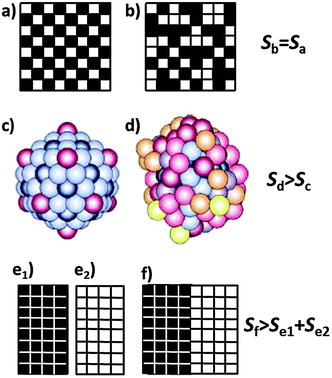 | ||
| Fig. 5 Checkerboard with conventional (a) and disordered (b) arrangement of the 32 black and the 32 white fields, and a cluster of 147 sodium atoms in its icosahedral crystalline (c) and molten state (d). A darker colour of the atoms indicates a stronger bonding and thus a lower energy of these atoms. The configurational entropy of the completely ordered compartmental states (e1) and (e2) is zero. It increases when the two compartments are merged, allowing the fields to rearrange to a mixed state (f) which is entropically equivalent to (a) or (b). [(c) and (d) reproduced with permission from ref. 10.] | ||
The number W of distinguishable ways to arrange k = 32 black fields over n = 64 fields is given by
 | (7) |
So why are the two cases different although they look so similar? The important point is that there is no interaction energy between the fields of the checkerboard. Therefore, reshuffling the fields does not involve any exchange of energy (heat) as required by eqn (2), and their thermodynamic entropy is thus the same. The situation changes if we associate the fields of the checkerboard with ions in a salt lattice. If e.g. the black fields represent sodium cations and the white field’s chloride anions, then (a) describes a two-dimensional sodium chloride lattice and (b) a disordered or perhaps ‘melted’ form of this lattice. (b) then has a higher entropy than (a) because of the ionic interactions. Melting of the NaCl lattice changes the thermodynamic entropy since the atoms assume different energies in the molten state. As Lambert has pointed out there is also ‘no thermodynamic entropy change’ involved with reshuffling macroscopic items, e.g. with shuffled cards, messy desks and disorderly rooms.9 Hence, such examples must be dealt with care. The reason is that thermodynamic processes occur at thermal energies on the order of kT. This energy is not sufficient to change the order on the top of a desk.
How about the configurational entropy? We have already stated that based on eqn (6) and (7) the configurational entropy of the arrangements (a) and (b) is the same even though (a) is intuitively associated with higher order. But what is order? It means the arrangement of objects according to a particular pattern or a sequence of distinguishable objects. For a definition of the number of distinguishable ways W to arrange objects we have to divide up space into boxes, or we have to provide them with colours, numbers, or coordinates (as e.g. in a crystal). An example is given in Fig. 5(e) where we have divided the board into two and filled all black fields into the left box and all white ones into the right box. For each of the two boxes there is only W = 1 way to arrange the fields since they are indistinguishable by virtue of their colour, thus the configurational entropy is zero. If we merge the two boxes and allow the fields to rearrange, then we obtain many distinguishable options, such as (f), or (a) or (b) which all have the same probability W and thus the same configurational entropy which is, however, higher than that of (e1) and (e2) together. The physical analogue in chemistry is the mixing entropy of two ideal gases for which the mixing process occurs without any exchange of heat.
2. The need of gradients to drive processes, and the inevitability of losses
As discussed in Section 1.3, reversible processes apply to systems in full equilibrium when there is no gradient that drives processes. These are processes in the limit of zero rate of change, so more adequately they should be called stationary states.Spontaneous, non-reversible processes require a gradient. Empirically, and not too far from equilibrium, a flow of heat is proportional to the gradient of temperature, Fick's law states that the flow of diffusion is proportional to the gradient of concentration, and rates of chemical reactions are proportional to a gradient in chemical potentials. This implies that the direction of the process is such that the gradient is diminished. In terms of the second law (eqn (3)) the rate of change of these properties is directly related to the rate of entropy production, dS/dt ≥ 0,1 which introduces time t as a variable in non-equilibrium thermodynamics.
2.1 The reversible and irreversible efficiency of a hydrogen fuel cell
A hydrogen fuel cell is an electrochemical device which produces electrical power by burning a fuel, often hydrogen, according to the reaction shown on top of Fig. 6, and it is a particularly transparent example to demonstrate the loss of efficiency and heat dissipation of a device when it is running. It is dG which provides the electrochemical gradient that drives the reaction and provides electrical power, but more commonly spontaneity is judged based on the standard property ΔG°. If the entire chemical energy, ΔH°, could be converted, the cell would produce an open circuit voltage E′ of 1.48 V (obtained by dividing ΔH° by the Faraday constant, F = 96![[thin space (1/6-em)]](https://www.rsc.org/images/entities/char_2009.gif) 485 A s mol−1, and the number of electrons transferred per formula unit, n = 2). However, the entropic part of ΔH° which corresponds to the volume work needed when the two gases are converted to liquid water does not contribute, only the free energy ΔG° can be converted, which leads to a theoretical open circuit potential E° = 1.23 V, corresponding to a reversible efficiency ηrev = E°/E′ = 0.82 (82%). It is this reversible efficiency which is normally quoted, but reversible values by definition relate to a device which does not run (here because no current flows under open circuit conditions), so they are useful only as a theoretical maximum value extrapolated to zero power.
485 A s mol−1, and the number of electrons transferred per formula unit, n = 2). However, the entropic part of ΔH° which corresponds to the volume work needed when the two gases are converted to liquid water does not contribute, only the free energy ΔG° can be converted, which leads to a theoretical open circuit potential E° = 1.23 V, corresponding to a reversible efficiency ηrev = E°/E′ = 0.82 (82%). It is this reversible efficiency which is normally quoted, but reversible values by definition relate to a device which does not run (here because no current flows under open circuit conditions), so they are useful only as a theoretical maximum value extrapolated to zero power.
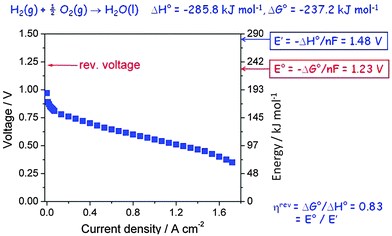 | ||
| Fig. 6 Polarisation curve of a polymer electrolyte hydrogen fuel cell as a function of current density. | ||
Actually, because of the nature of the electrode reaction this theoretical value of E° is never measured, not even at open circuit. In reality, a value around 1.0 V may be obtained, but when a current is drawn the observed voltage decreases further and over much of the current range approximately linearly because of the Ohmic resistance of the polymer electrolyte membrane. This Ohmic resistance and in fact the entire loss process produces heat which has to be removed by cooling. It is commonly called waste heat since it often remains unused, but it is actually inevitable and essential since it is directly related to the rate of entropy production of the universe (see eqn (3)). The relevant irreversible efficiency corresponds to the actually observed voltage divided by E′. It is plotted in Fig. 7 as a function of the electrical power that is drawn from the device. In a typical operation range the efficiency amounts to 45–50%, but at maximum power it barely exceeds 30%. That the real efficiency is less than ηrev is typical for all operating machines, devices and even for all processes which are not in equilibrium and thus evolve in time. The maximum entropy production occurs under short circuit conditions.
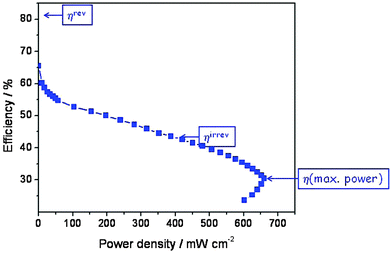 | ||
| Fig. 7 Efficiency of the hydrogen fuel cell (data from Fig. 6) as a function of electrical power density (the product of actual voltage and current density). | ||
2.2 The Carnot cycle and the reversible and irreversible heat engines revisited
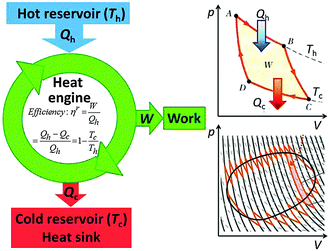
A heat engine (or an internal combustion engine) operates between a hot heat reservoir at temperature Th (the temperature of the burning fuel) and a cold reservoir (the cooling system) at Tc. The system is the gas of variable volume V at a variable pressure p inside the cylinder, and the piston which closes off the cylinder acts to transfer the work W of the expanding gas to drive the mechanical engine. Fig. 8 (left) shows the scheme that is conventionally used to represent the heat engine. For an ideal (reversible) process the machine is understood well based on the Carnot closed cycle which consists of a sequence of two isothermal (no temperature change of the system) and two adiabatic (also called isentropic, with no heat exchange between the system and the environment) steps, shown in a p–V plot (upper right of Fig. 8). During the reversible isothermal expansion from A to B the internal energy change of an ideal gas is zero, and the heat Qh that is consumed equals the work produced on the piston. No heat is exchanged during the adiabatic expansion from B to C, but some work is produced at the cost of the internal energy. By dissipating isothermally an amount of heat Qc the gas contracts from C to D, and then it is brought back adiabatically to A. Over the entire closed cycle the internal energy change ΔU is zero, but there is a net heat flux Qh − Qc that equals in magnitude the total work W which is represented by the enclosed area of the cycle in a p–V plot. It should be noted that the cycle applies only to the thermodynamic process, but the input of heat is accompanied by delivering a chemical fuel, an output of work and of chemical combustion products, mostly CO2 and water which carry off part of the waste heat.The reversible efficiency of the cycle is defined as the executed work divided by the heat used:
 | (8) |
Thus, the machine cannot operate without dissipating an amount of heat Qc so that even in the reversible case the efficiency is <1. Even though ηirrev < ηrev < 1 the energy of the system and the universe is conserved (Qc remains unused and is therefore not counted in the evaluation of the efficiency), but the entropy of the universe is not conserved in the irreversible process.
The reversible (equilibrium) process is characterised by the pressure of the piston being equal to that of the gas (this piston will not move) and by the temperature of the gas being equal to the temperature of the heat bath (in which case the heat is exchanged infinitely slowly), so this machine will not run. Lifting the constraint of reversibility by allowing for pressure and temperature gradients bends the lines connecting the points A, B, C, and D more to the inside of the cycle, which diminishes its area W, so that the irreversible efficiency ηirrev falls below ηrev. As a function of power drawn from the engine the efficiency has been worked out, leading to a plot similar to that for the fuel cell (Fig. 7) with efficiency at a maximum power of  .11,12 The lower efficiency is accompanied again by an additional dissipation of reversible heat.
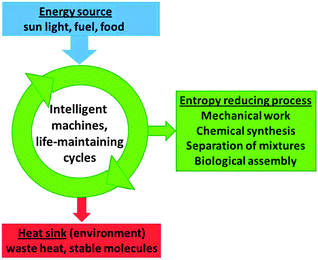
It is the cyclic mechanism of the heat engine that reflects the cyclic nature of the Carnot process and reminds of what we call a machine. Therefore, the well-known scheme shown in the left part of Fig. 8 is actually much more general and valid with slight modifications also for other processes: intelligent machines and life-maintaining cycles provide work that drives non-spontaneous processes such as endergonic chemical synthesis, the separation of mixtures in distillations or during crystallisation, or biological reproduction and self-assembly. The terms machinery or engines of life have been used previously by various authors.13–15
2.3 The second law of thermodynamics in a chemistry lab
The separation of reaction products by crystallisation or distillation is a typical non-spontaneous process in a chemistry laboratory. If mixing of liquids is spontaneous the mixing process increases the entropy of the system by the entropy of mixing. Work has to be conducted to reverse the process: by heating the mixture, volatile constituents are enriched in the gas phase and condensed in subsequent fractions of higher purity. The process that is called distillation does not work without creating a gradient and dissipating the waste heat in the condenser (Fig. 9).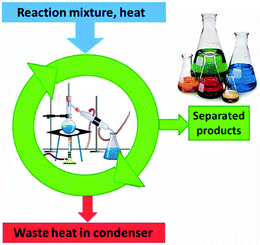 | ||
| Fig. 9 The separated products in a distillation represent a higher order than the initial reaction mixture. Distillation works only if the heat of condensation is dissipated in the condenser. | ||
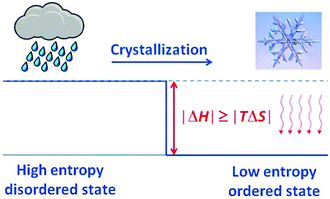
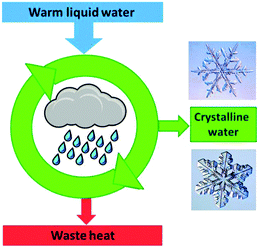
Crystallisation is discussed based on the Gibbs free energy (eqn (5a) and (5b)). In the equilibrium case (dG = 0) the heat of crystallisation is equal to TΔS. The crystalline state is the more ordered one, i.e. ΔS < 0, therefore, ΔH must also be negative. It means that heat must be dissipated to the surroundings even in the reversible case (Fig. 10), but the reversible process is infinitely slow because the crystal and the environment are at the same temperature. This is quite analogous to the well-known situation for the reversible heat engine which requires heat to be dissipated (Fig. 8). More important in the present context is the irreversible case (dG < 0), which is obtained if ΔH is even more negative. It is this additional fraction of ΔH which drives the process and leads to the increase of the entropy of the universe. Thus, if the temperature is to be maintained, the system has to be cooled. The scheme representing the cyclic machine is given in Fig. 11 for the crystallisation of water to ice.
2.4 The fundamental gradient that drives life on earth
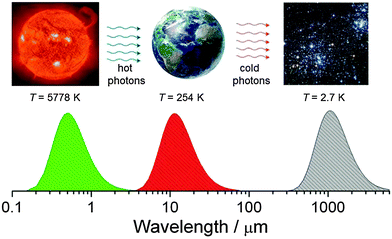
It is no secret that life on earth is driven by the energy of the sun, which is a black body with a surface temperature of ca. 5778 K that corresponds to a maximum intensity of the emitted light at ∼500 nm (Fig. 12). Planet earth is also approximately a black body at a temperature of 254 K (this is measured from what is radiated off the surface outside the atmosphere – because of the greenhouse effect the actual average temperature of the earth's surface inside the atmosphere is about 288 K) which emits infrared photons into a heat bath that consists of matter dispersed in interstellar space, another black body with a temperature of 2.7 K. Assuming that the flux of energy radiated off by the earth at 255 K (238 W m−2) is the same as the one which was absorbed from solar radiation at 5778 K we can calculate the increase of entropy of the universe due to this energy degradation to lower temperature based on eqn (3) as ca. 0.9 W m−2 K−1.16Thus the sun and the interstellar space span the gradient which drives life on earth. This is a necessary but not a sufficient condition for life to exist since there needs to be also a mechanism that can make use of the gradient and maintain or even initiate the existence of living organisms. The latter are considered to be highly ordered systems which are far from equilibrium with their environment. Below we shall discuss the principles which make this possible.
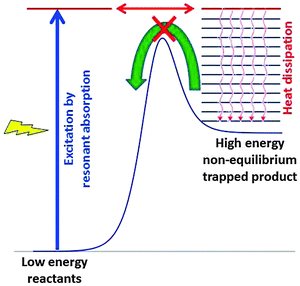
Fig. 13 explains in a simplified scheme how resonant absorption of light or excitation by the energy of any fuel, followed by transformation of the excited species and efficient heat dissipation, can lead to high energy non-equilibrium product states. These products are trapped and cannot react back easily because they are separated from the initial reactants by a high kinetic barrier. After dissipation of the excess heat there is no longer sufficient thermal energy to cross the barrier. Basically, our living organisms represent such trapped states, and we are quite glad that the barrier back to equilibrium is sufficiently high.
2.5 Why are solar cells so inefficient?
A photovoltaic cell has to provide current at a certain voltage. This is done by excitation of electrons via photon absorption across the band gap of a suitable semiconductor material, followed by spatial separation of the excited electron (upper red dot in Fig. 14) and the hole that it left behind (low gray dot).17 This separation is supported by a gradient due to band bending if excitation occurs near a junction between p type and n type semiconductor materials. Sliding down the slope (process 4 in Fig. 14a, the equivalent of heat dissipation in Fig. 13) drives the charge separation and provides the activation barrier that prevents the recombination of electrons and holes (process 3 on the left side). Of course, excitation is not by a single wavelength that corresponds to the band gap but by a spectral distribution of light. A fraction of the photons has too little energy to overcome the gap so that they are not absorbed (process 2). Others have too much energy so that the excess gets lost by downward relaxation of the electron and/or upward relaxation of the hole (process 1). An additional loss may occur at the junctions to the terminals which consist of metals with different Fermi levels (process 4). The usable energy that is left is U, considerably less than the original photon or the band gap energy.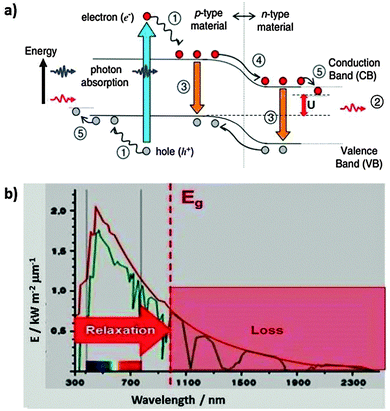 | ||
| Fig. 14 (a) Loss processes in a semiconductor photovoltaic cell: (1) lattice thermalisation loss (internal conversion), (2) non-absorption of below band gap photons, (3) recombination losses, (4) and (5): junction and contact voltage loss, U: usable voltage. Reprinted from ref. 17, copyright (2006), with permission from Elsevier. (b) The Shockley–Queisser limit for a given band gap energy Eg originates in loss processes due to non-absorption of below band gap photons (red hashed range, 2) in part (a) and relaxation processes (1), (4), and (5). | ||
The total losses due to the relaxation process (1) and non-absorption (2) were calculated by integration over the solar spectrum and including charge recombination (3). The maximum theoretical conversion efficiency for a single junction solar cell was found to be around 33.7% for a band gap near 1.34 eV, which is relatively close to the band gap of silicon (1.1 eV) that is the currently most common solar cell material. According to the authors, this maximum theoretical efficiency is called the Shockley–Queisser limit.19 The other loss processes, in particular (4) which drives charge separation, lead to a further reduction so that the maximum efficiencies in the laboratory are slightly above 20% and around 15% for large scale technical installations.
A solar cell delivers a current only because of dissipation of heat over the gradient in process (4). We can therefore represent it as a machine analogous to the heat engine (Fig. 15).
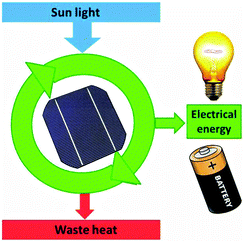 | ||
| Fig. 15 The solar cell as a device which can provide electrical energy only because it dissipates waste heat. | ||
2.6 A glimpse of the complexity of photosynthesis
Also in photosynthesis, the reality is not as simple as suggested in Fig. 13. CO2 and H2O do not absorb visible light. Their absorption is far in the UV region where no significant fraction of sunlight is transmitted through the atmosphere. Energy needs to be transferred by sensitisation from a molecule that absorbs sunlight. Photosynthesis in plants proceeds in two coupled proteins: photosystem I (PS I) and photosystem II (PS II) (Fig. 16).20 It involves near-simultaneous photoexcitation at 1.77 eV (700 nm, PS I) and at 1.83 eV (680 nm, PS II), each followed by a sequence of specific electron transfer cascade steps which dissipate the energy and lead to the desired product. The electrons stored in the acceptor site of PS I eventually lead to the reduction of the nicotinamide adenine cofactor (NAD+) to NADH which provides the energy for the enzymatically driven CO2 fixation. PS II leads to O2 production by water oxidation, and at the end of its cascade the electron replenishes the hole at the starting point of PS I.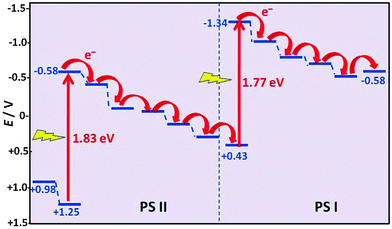 | ||
| Fig. 16 Electron transfer cascades in the photosynthetic reaction centres PS I and PS II (adapted from ref. 20). | ||
It should be noted that the cascades shown in Fig. 16 are not the only energy loss processes which limit the efficiency of photosynthesis. As in photovoltaic cells, the excess energy of photons with a wavelength below 680 nm will also be dissipated, and photons with too low energy are not absorbed and reduce the efficiency further. The total incident photon-to-current conversion efficiency in a photo-bio-electrochemical cell was quoted as 3.1%.20 Electron transport down the cascades, accompanied by heat dissipation, is necessary to ensure the stabilization of the non-equilibrium product states, which is compatible with the picture developed for the heat engine (Fig. 17).
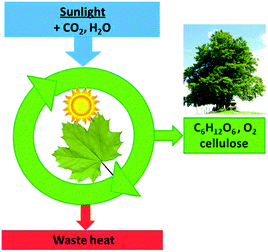 | ||
| Fig. 17 Photosynthesis can generate non-equilibrium low entropy glucose and cellulose only because it dissipates waste heat. | ||
2.7 Heat death: the ultimate end of an evolving universe
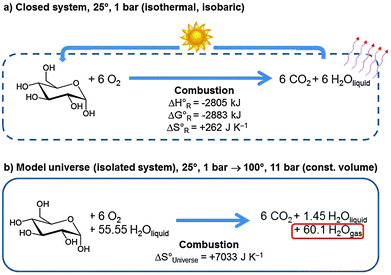
From the second law of thermodynamics we know that the entropy of the universe will increase for all spontaneous processes. Since the total possible reversible heat flow is limited by everything having the same temperature, and when no chemical or nuclear reactions are available anymore which can produce further heat, entropy will reach a maximum but will not go to infinity. This extrapolated end of a universe that evolves further in time has been dubbed heat death. But how will this final state look like? This is a question that is complex to answer. Considering an extremely simplified model universe helps to get a rough idea.We first consider a closed system consisting of 1 mol of glucose and 6 mol of molecular oxygen at 25 °C and 1 bar pressure (see Fig. 18a). The equilibrium state at the same temperature and pressure consists of the system after complete combustion to 6 mol of CO2 and 6 mol of liquid H2O. The heat of reaction of 2805 kJ will be dissipated from the system.
The reverse of the spontaneous combustion reaction is the photosynthesis of glucose from CO2 and water. The energy required corresponds to the equivalent of about 17 photons of 1.8 eV (compare Fig. 16). In reality, about 48 photons are needed for the conversion of 6 CO2 molecules.21
In an isolated system we need some material which can take up all this heat so that eqn (3) applies. We therefore embed the above system into an aqueous environment consisting of 1 kg (55.55 mol) of liquid water, and we do not permit any energy exchange with the outside world (Fig. 18b). The reaction is still spontaneous, but the entire heat of reaction is now absorbed by the system. It is sufficient to heat up the entire product system to 100° and to evaporate most of the water, leaving only 1.45 mol of liquid water. This defines the final state at 100° and ca. 11 bar pressure (the initial state contained 6 mol of O2 gas, the final state 6 mol of CO2 and 60.1 mol of gaseous H2O) at constant volume.
We learn from this example that the heat of reaction that is set free when organic matter transforms into the more stable state of CO2 and water heats up the system and evaporates water. Both effects contribute considerably to increase the entropy of the model universe. Heat death of the universe is thus equivalent to a hotter world with more gas phase water and CO2 but less oxygen. Today's high atmospheric molecular oxygen and low water concentration are characteristic of a state of the Earth's system that is far from equilibrium.22 One may even conjecture that once life existed and reproduced in a CO2 consuming and O2 producing form it contributed significantly to today's habitable atmospheric conditions. In terms of Fig. 12 heat death means that the sun has cooled off and the interstellar space heated up to some common intermediate temperature across the universe which is also the final temperature of the earth.
Towards the final state of the universe near heat death energy is available in no other form than heat. Heat is therefore often dubbed the lowest quality of energy.
3. Creating non-equilibrium (metastable) structures in the laboratory
3.1 Crystal face dependent control of the crystal growth rate
We have to distinguish between the structure and morphology of a crystal. Structure relates to the crystallographic elementary cell as it is seen in diffraction experiments. For example, crystalline graphite and diamond represent different allotropic forms of elementary carbon. For macroscopic crystallites the most stable one at room temperature is graphite, but other modifications can be trapped and are metastable at room temperature.18 However, this is not what we are focussing on here. Rather we will be concerned with morphology, which means the crystals have different macroscopic appearance although they all have the same unit cell structure.The energy of large crystallites is determined essentially only by a term that is proportional to volume, but for small crystallites a surface term makes a comparatively much larger contribution and in the equilibrium case determines the crystallite shape. Wulff's theorem states that the ratio of the surface free energy (which is equal to the surface tension) of the i-th crystal face to its distance, measured by its normal to the crystal centre, is constant.23 Thus, the small faces at the tips of needle-like crystallites have a much higher energy density than the larger faces parallel to the long axis, which minimises the total energy. In equilibrium all crystallites of a given material and structure should have the same shape, but crystal face-dependent modification of the crystal growth rates allows us to gain kinetic control and obtain shapes quite different from those determined by thermodynamics.
In reality things are often not so straightforward. Snow crystals, for example, can grow as platelets or as needles although the crystal structure is always that of hexagonal ice (see Fig. 11). The hexagonal crystallites have two inequivalent types of faces, the basal plane and the prism faces. Depending on temperature and supersaturation of the atmosphere with water vapour one or both of these can be covered with a film of liquid water, or they can be smooth or rough solid surfaces.24 This influences the efficiency of heat dissipation and affects the rate of accommodation of water molecules and thus the growth rate so that at a temperature >−4 °C the flakes grow as platelets, from −4° to −10° as needles, from −10° to −20° again as platelets and at <−20° as prisms. These growth conditions are described by the Nakaya diagram.18,24 The sequence of in-plane and out-of-plane growth as flakes are taken up and down the clouds, then leads to the well-known artistic and miraculous variation of shapes.
Another example with rich morphological variability is that of hexagonal ZnO, grown from the vapour phase at slightly different temperatures and degrees of supersaturation.25 ZnO crystals can also be grown from solution, where the growth rate can be reduced by selective adsorption of certain molecules or ions like citrate. In the latter case, since citrate adsorbs preferentially at the basal planes, high citrate concentrations form a barrier and reduce the growth rate in the direction of the prism axis.26 An example for the variability of the shape of cubic crystals was reported for Cu2O nanocrystals at different concentrations of H2NOH·HCl27 and a more general review of crystal shape engineering has been presented by Burda et al.28
An instructive example of crystal shape engineering is the formation of cubic rhodium nanoframes (Fig. 19).29 First, Pd nanocubes are synthesized, then the surfaces are decorated with bromide ions which adsorb preferentially on top of the {100} surfaces but not on the edges or corners. In the next step, rhodium is deposited by site selective overgrowth on the free edges and corners. When the frames are complete the Pd in the interior is etched away selectively, leaving the nanoframes as open structures with interesting properties for optical and catalytic applications.
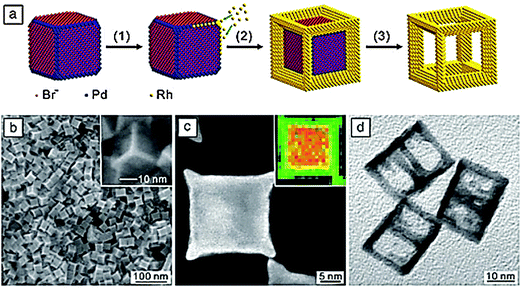 | ||
| Fig. 19 (a) Synthesis of cubic rhodium nanoframes by site-selective overgrowth of Pd nanocubes and selective etching of the Pd nanocores.29 (b) Scanning electron microscopy image of Pd–Rh core–frame nanocubes, (c) transmission electron microscopy and element-selective, energy-dispersive X-ray mapping (inset) images of an individual core–frame nanocube, (d) transmission electron microscopy image of Pd-etched rhodium nanoframes (Y. Xia, X. Xia, Y. Wang, S. Xie, Shape-controlled synthesis of metal nanocrystals, MRS Bull., 2013, 38, 335–344, reproduced with permission). | ||
3.2 Morphology control using templates
Metal oxides used to be prepared in furnaces at temperatures often exceeding 1000 °C considerably. Nature of course can make a large variability of oxide morphologies at ambient temperature, such as in diatoms or radiolaria. These structures are formed using heritable organic soft matter structures, often proteins, as templates in a moulding process and forming the bonds of the metal oxide network in condensation reactions around the template.Over the last few decades it has become possible to mimic the natural processes in the laboratory and to make a large number of non-equilibrium structures. Surfactants, based on their structure consisting of polar (hydrophilic) head groups and nonpolar tails (hydrophobic chains), can form a rich variety of soft matter structures with long-range order which are suitable as templates to synthesise new materials with ordered porous architectures (Fig. 20). Therefore, the hard oxide phase is obtained in a sol–gel process by hydrolysing and condensing metal alkoxides M(OR)4 or metal tetrachlorides, with M = Si, Ti, and Zr, among others. The organic template is then eluted or often simply burnt away by calcination in air, leaving behind a fully crystalline microporous zeolite or a mesoporous silicate with crystalline long-range order and amorphous porous walls. These silica structures are metastable allotropes of their most stable form, the α quartz.
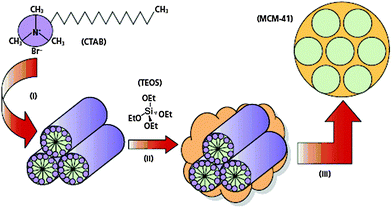 | ||
| Fig. 20 Surfactants, here cetyltrimethylammonium bromide (CTAB) form a rich variety of soft matter structures which are used as templates for the sol–gel process of alkoxides, here tetraethylorthosilicate (TEOS), which is hydrolysed, followed by condensation to the template-directed silica structure and subsequent burning off of the organic phase (reproduced from ref. 30). | ||
3.3 Electrochemical pore formation
Not too long ago, the discovery of carbon nanotubes was revolutionary, but today nanotubes can be grown for a multitude of materials, in particular from layered materials.31 An interesting variant of synthesis is by electrochemical anodisation of a sheet of metal in an electrolyte solution of suitable composition that often contains fluoride ions.32,33 An important step relates to the heating-induced initiation of a hexagonal convective flow pattern near the surface which reminds of Rayleigh–Bénard structures, also a non-linear effect due to conditions far from equilibrium (see Fig. 21).34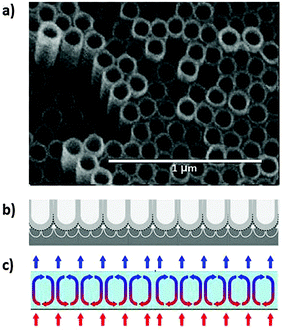 | ||
| Fig. 21 (a) Hexagonal array of TiO2 nanotubes grown by anodisation of a Ti foil.32 Reprinted from ref. 32, Copyright (2010) John Wiley & Sons, Inc. (b) Suggested plastic flow that leads to dissolution of Ti foil and formation of nanotubes.33 Reprinted from ref. 33, copyright (2011), with permission from Elsevier. (c) Rayleigh–Bénard convection cells developed in a gravitation field when a thin layer of a liquid is heated smoothly from below and cooled from above. The alternating clockwise and counter-clockwise rotations of the developing cells are a consequence of instabilities leading to spontaneous symmetry breaking and self-organisation to new order in the heat gradient. | ||
4. Spontaneous self-assembly of ordered super-structures
4.1 The hydrophobic effect and thermodynamics of self-assembly
No sunlight or other high energy input is required for the formation of ordered structures by protein folding, self-assembly of layers, or crystallisation. A heat flow is nevertheless necessary to satisfy the second law (eqn (3)). In this case the energy that drives the transition to higher order is provided by the system itself. It is therefore easier to discuss the spontaneity on the basis of the free energy criterion (eqn (5a) and (5b)). The energy is provided by the enthalpy ΔH of aggregation, and its origin may be in ionic interaction if ions are involved, or in hydrophobic, hydrogen bonding and dispersion type van der Waals interactions.35,36 The situation is analogous to that displayed in Fig. 10 for crystallisation, and the corresponding combustion engine scheme is displayed in Fig. 22.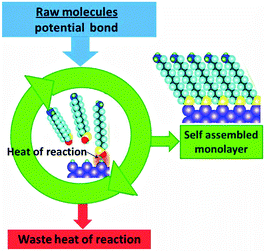 | ||
| Fig. 22 The heat of reaction that is liberated during spontaneous self-assembly of supramolecular structures has to be dissipated. | ||
In contrast to crystallisation, self-aggregation of surfactants in aqueous systems often leads to positive ΔS, which is at first counterintuitive. For an explanation let us consider the following: one can easily understand that hydrophobic substances attract each other, for example, hexane being non-polar in nature solubilises octane which is also non-polar. This goes with the saying, ‘like tends to dissolve like’. On the other hand, the solubilisation of hexane in water which is polar in nature is less easy to visualise. The behaviour of non-solubility of non-polar hydrocarbons in water can be related to the cohesive and adhesive properties of water. The ‘work of adhesion’ for two immiscible liquids 1 and 2, which is defined37 as the amount of work required to separate a column of liquid with a cross-section of 1 m2 to give two plane surfaces of 1 m2 each has been given in the form of the equation by Dupré,38
| Wadh = γ1 + γ2 − γ12 | (9) |
Although the water–hydrocarbon interaction is attractive as a result of the cohesive forces, hydrocarbons tend to avoid being dissolved in water as their cohesive forces cannot compete with the strong cohesive forces of water,41i.e. the hydrocarbons in water tend to be caged by water mainly because of the predominant water–water hydrogen bonding that forces the rearrangement of the water molecules around them. When hydrocarbons are inserted into water as a solvent, Wcoh has to be spent and Wadh is set free. This corresponds to a non-spontaneous reaction with a positive insertion free energy of the order of 2γ12 = 51 mJ m−2.42 Since both cohesion and adhesion are dispersion type interactions of similar magnitude, the dispersive part of the free enthalpy change of hydrocarbon caging is near zero. This is in accordance with eqn (5b) where the non-solubility of hydrocarbon in water is mainly entropy driven since TΔS ≪ 0.43 However, we know that water can cage hydrocarbon molecules. This is due to the loss in entropy caused by the structural rearrangement of the water molecules in the vicinity of the hydrocarbon molecule. The phenomenon is termed ‘Hydrophobic Effect’,39,40 which is popularly defined as ‘the observed tendency of the non-polar substances or oils to associate with aqueous medium and exclude water molecules’.41 It indicates that the increase in the entropy due to such a restructuring of water molecules compensates for ΔH ≈ ΔGdisp ≈ 0, thereby making the total ΔG term negative and permitting such a process to occur.
In contrast, water is not caged when dissolved in hydrocarbons, clearly proving that the hydrophobic effect arises due to the driving force from the increase in entropy of water. Thus, one must understand that hydrophobic association arises mainly due to the water molecules and not due to the attraction between the hydrocarbons themselves. This effect between a pure hydrocarbon and water helps us to comprehend the behaviour of a surfactant (an amphiphile containing a hydrophilic head and a hydrophobic tail) molecule at the oil–water interface. Thus the hydrophobic effect plays a major role in understanding various effects in biological systems; in particular, it provides the driving force for the formation of globular proteins.40
In general, aggregation and self-assembly are seen in polar media and are accompanied by a decrease in the overall entropy. In spite of this it is evident that aggregation occurs. Therefore in such cases, entropy change per aggregate (containing N free molecules, ϕfree being their volume fraction) formed in the self-assembly process can be given by a simplified equation:43
ΔSagg ≈ kN![[thin space (1/6-em)]](https://www.rsc.org/images/entities/char_2009.gif) ln ln![[thin space (1/6-em)]](https://www.rsc.org/images/entities/char_2009.gif) ϕfree < 0 for N ≫ 1. ϕfree < 0 for N ≫ 1. | (10) |
4.2 Self-assembly of amphiphilic molecules
A molecule containing a polar (hydrophilic) part, termed ‘head’, and a nonpolar (hydrophobic) part, termed ‘tail’, is considered to be amphiphilic. Usually, surfactants, lipids and certain synthesized block co-polymers are amphiphilic in nature (Fig. 23a–d). Depending on geometric considerations, medium and concentration of the molecule involved, they can pack into various aggregate shapes such as micelles (Fig. 23f), inverted micelles (Fig. 23g), planar bilayers (Fig. 23h), or spherical bilayer structures, called vesicles (Fig. 23i), or lead to further shapes such as rods or tubes. Amphiphilic molecules can also assemble at an air–water interface to form so-called Langmuir monolayers (Fig. 23e).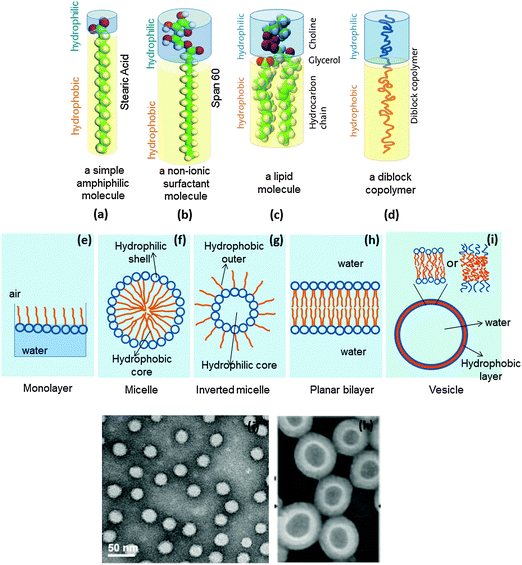 | ||
| Fig. 23 A representation of (a) an amphiphile, (b) a surfactant, (c) a lipid molecule, (d) an amphiphilic diblock copolymer; the structures formed by an amphiphile (e) a Langmuir monolayer at the air–water interface, (f) a micelle, (g) an inverted micelle, (h) a bilayer, (i) a vesicle; transmission electron micrographs of (j) micelles formed from PSMA100-b-PS250 and (k) PS300-b-PAA44, amphiphilic diblock copolymers (figures a, d and i are adapted from http://www.ifnh.ethz.ch/vt/research/projects/engelh, and figures j and k are reprinted with permission from ref. 45), Copyright (2014) American Chemical Society, and from ref. 46, Copyright (2001) American Chemical Society. | ||
The self-assembly of amphiphilic molecules is an extension of the understanding of the hydrophobic effect, only that the amphiphiles contain both polar and non-polar groups. Thus when amphiphilic molecules are dissolved in water or in polar solvents, their tail groups are expelled from the polar medium and form an organic core whereas the head groups face the solvent water molecules.44 Such a process is structurally favoured owing to a large negative free energy obtained by the gain in entropy. Once the amphiphile is dissolved in water it is solvated by water molecules. When a critical concentration of the amphiphile is reached, they associate, and the water from the hydration shells surrounding the hydrophobic parts of the amphiphiles is released leading to a gain in entropy at room temperature. Therefore, the process of self-assembly is entropy-driven at room temperature but with increasing temperature, it is expected to be enthalpy-driven in order to compensate for the entropy change.
A representative example of such a self-assembly process is shown in Fig. 23j which shows the micelles formed from amphiphilic diblock copolymers of poly(styrene-alt-maleic anhydride)-block-poly(styrene) represented as (PSMA100-b-PS250, where 100 and 258 represent the molecular weights) which have been prepared for the purpose of drug delivery applications.45 A similar phenomenon is evidenced in the situation where inverted micelles (Fig. 23g) are realised.
Self-assembly, leading to the formation of vesicles, will involve the initial formation of structures termed ‘bilayers’ as displayed in Fig. 23h. The bilayers are especially formed from the diblock copolymers and lipids or lipid-like molecules where most of the time there are two hydrophobic alkyl chains of specific chain length, say 12 carbons, attached to the hydrophilic head group. The bilayers, owing to contributions from interfacial energy, can bend to form vesicles. In principle, such an association is disfavoured by a loss in entropy but achieved by the hydrophobic effect owing to the solvent water molecules in which they associate. In the case of Fig. 23i, the vesicles can be realised from three different types of molecules. When they are formed from amphiphilic diblock copolymers and ionic surfactants they are simply termed ‘vesicles’, but when lipids are involved in the formation; they are termed ‘liposomes’ and more recently, when non-ionic surfactants form such a structure, they are termed ‘niosomes’. Such type of structure association is dependent on the concentration of the solute and the temperature as has been described in Section 4.1. This has indeed been studied by Luo and Eisenberg46 on the vesicles formed by the polystyrene-block-poly(acrylic acid) (PS300-b-PAA44) amphiphilic block co-polymer (Fig. 23k).
Vesicles may be regarded as simple models for biological cells. Cell membranes are bilayers formed mainly from phospholipids (amphiphiles with two hydrophobic tails and a glycerol, phosphate and choline containing hydrophilic head group) interspersed with cholesterol and with membrane proteins.
4.3 Modelling the self-assembly of living systems
The self-assembly described so far represents structures in thermodynamic equilibrium. However, depending on the pathway of their preparation (dilution, annealing, addition of salts), supramolecular structures can also get trapped in non-equilibrium states which are separated by an energy barrier from their equilibrium states, akin to the situation displayed in Fig. 13.47 The energy landscapes of supramolecular aggregates are defined by electrostatic or steric repulsion and attractive interactions of parallel stacked but laterally displaced or T-shape arranged aromatic π-systems which are in simple cases dominated by molecular quadrupole interactions.48 Since electrostatic interactions play a role the energy landscape and therefore the structure of the aggregates depends on the ionic strength, as demonstrated by Tantakitti et al. for a peptide amphiphile, i.e. a molecule in which an aliphatic hydrophobic segment is covalently linked to an amino acid sequence.47Fuel-driven, active self-assembly of actin filaments and microtubules is a key component of cellular organisation.49 Such structures distinguish themselves from equilibrium self-assembled materials by their ability to achieve transient structure formation by using the free energy provided by the conversion of a fuel. Their behaviour is not determined by thermodynamic stability but by the kinetics of consumption of a sacrificial fuel.49 A model of such a system was recently studied in which the transient intermediate of an esterification (i.e. the ester) followed by hydrolysis back to the chosen carboxylic acid showed self-assembly behaviour. The cyclic process is fuelled by the reaction that provides the ester group, and depending on the relative rates of esterification and ester hydrolysis one observes self-assembly.49
5 Concluding remarks
Heat engines produce work that is typically used to drive processes which do not occur spontaneously. This is achieved by letting the machine operate between two temperatures, where energy is provided to the system at the high temperature and partly converted to work. This can be done only when an unavoidable remaining fraction of the energy input is degraded to lower temperature and dissipated as waste heat. It is shown here that this principle is not limited to heat engines but holds more generally for many other processes in which a subsystem of the universe is to be transformed to higher order, as in the separation by distillation or crystallisation, photosynthesis, solar cells, or self-assembly.Also the reproduction of living organisms is a non-spontaneous process that leads to a higher degree of order.50Fig. 24 shows a generalised scheme that summarises the series of more specific schemes in this Tutorial. Because of its general applicability we may call it the machinery of life.
The thermodynamic criterion of the second law, i.e. the arrow of time, does not provide a sufficient description of processes in living systems and in the laboratory. Non-spontaneous (driven) processes lead to subsystems which are stabilised often far from equilibrium with environment. In other words, kinetic barriers intercept the arrow of time and prevent the subsystem from rapid equilibration. They play a pivotal role in controlling the processes of life and the rate at which the entropy of the universe increases towards its final future value at equilibrium.
The majority of materials which are prepared in the laboratory are not in equilibrium states. It is therefore essential that we understand how non-equilibrium states are stabilised by trapping behind a barrier. Furthermore, a continuous evolution of living systems requires that its states are not trapped but are maintained by a continuous input of energy. In living organisms a steady state is established that involves an extremely large number of local equilibria and processes which are all balanced in detail by activation barriers. Since a steady state is not time-dependent this keeps kinetics extremely simple, and for a holistic description of the rate of entropy production it is sufficient to know the fluxes of incoming and outgoing energies at the corresponding temperatures. However, as soon as fluctuations become of interest, for example for the analysis of the stability of the steady state towards external perturbations, this requires detailed knowledge about the kinetics.
The simple model universe of Fig. 18, the combustion of glucose, predicted that the final state of the universe will be much warmer compared with today and consists of a higher fraction of atmospheric CO2 and H2O at the cost of O2. One might therefore ask whether the global warming that we see on our planet actually reflects that we are noticeably approaching the heat death of the universe as a consequence of combustion of fossil fuels with corresponding heat and entropy production. The answer is straightforward: the direction of the effect is correct, but it does not quantitatively reflect the approach of our planet to heat death. The solar heat incident on our atmosphere is about 5 orders of magnitude more than the total energy consumption by the human population. CO2 and water produced by combustion just increase the mismatch between incident and reflected solar energy by increasing the greenhouse effect of the atmosphere, thereby amplifying the direct effect by a considerable factor.
This reading may have left more questions open than answered, but we hope that as a tutorial it increased the awareness and the interest in a subject that is of tremendous importance not only for the work of scientists but more generally for an understanding of our world.
Acknowledgements
We are grateful to Stefan Karolczak for valuable discussions and the referees' comments on the manuscript.References
- I. Prigogine, Time, structure and fluctuations, Nobel Lecture, 8. December 1977, http://www.nobelprize.org/nobel_prizes/chemistry/laureates/1977/prigogine-lecture.pdf.
- I. R. Epstein and K. Showalter, J. Phys. Chem., 1996, 100, 13132–13147 CrossRef CAS.
- P. G. Falkowski, T. Fenchel and E. F. Delong, Science, 2008, 320, 1034–1039 CrossRef CAS PubMed.
- P. Županović and D. Juretić, Croat. Chem. Acta, 2004, 77, 561–571 Search PubMed.
- Biochemical Pathways: An Atlas of Biochemistry and Molecular Biology, ed. G. Michal and D. Schomburg, John Wiley Sons, Hoboken, USA, 2nd edn, 2012 Search PubMed.
- S. N. Semenov, A. S. Y. Wong, R. M van der Made, S. G. J. Postma, J. Groen, H. W. H. van Roekel, T. F. A. de Greef and W. T. S. Huck, Nat. Chem., 2015, 7, 160–165 CrossRef CAS PubMed.
- E. Roduner, Chem. Soc. Rev., 2014, 43, 8226–8239 RSC.
- J. E. J. Schmitz, The Second law of Life, William Andrew Publishing, Norwich, 2006 Search PubMed.
- F. K. Lambert, J. Chem. Educ., 1999, 75, 1385–1387 CrossRef.
- M. Schmidt and H. Haberland, C. R. Phys., 2002, 3, 327–340 CrossRef CAS.
- F. L. Curzon and B. Ahlborn, Am. J. Phys., 1975, 43, 22–24 CrossRef.
- F. Barbir, PEM Fuel Cells, Academic Press, Burlington, 2005 Search PubMed.
- D. S. Goodsell, The Machinery of Life, Springer, New York, 2nd edn 2009, 1993 Search PubMed.
- A. Kleidon, Phys. Life Rev., 2010, 7, 424–460 CrossRef PubMed.
- P. G. Falkowski, Life's Engines: How Microbes Made the Earth Habitable, Princeton University Press, Princeton, 2015 Search PubMed.
- A. Kleidon and R. Lorenz, Entropy Production by Earth System Processes, in Non-equilibrium Thermodynamics and the Production of Entropy: Life, Earth and Beyond, ed. A. Kleidon and R. Lorenz, Springer, Heidelberg, 2004 Search PubMed.
- B. S. Richards, Sol. Energy Mater. Sol. Cells, 2006, 90, 2329–2337 CrossRef CAS.
- E. Roduner, Nanoscopic materials: Size-dependent phenomena and growth principles, Royal Society of Chemistry, Cambridge, 2nd edn, 2014 Search PubMed.
- W. Shockley and H. J. Queisser, J. Appl. Phys., 1961, 32, 510–519 CrossRef CAS.
- R. Tel-Vered and I. Willner, ChemElectroChem, 2014, 1, 1778–1797 CrossRef CAS.
- B. A. Osborne and R. J. Geider, New Phytol., 1987, 106, 631–644 CrossRef CAS.
- A. Kleidon, Philos. Trans. R. Soc., A, 2010, 368, 181–196 CrossRef CAS PubMed.
- G. Wulff, Z. Kristallogr. Mineral., 1901, 34, 449–530 CAS.
- Y. Furukawa, Chem. Unserer Zeit, 1997, 31, 58–65 CrossRef CAS.
- Z. L. Wang, Mater. Today, 2004, 7, 26–33 CrossRef CAS.
- Z. R. Tian, J. A. Voigt, J. Liu, B. McKenzie, M. J. McDermott, M. A. Rodriguez, H. Konishi and H. Xu, Nat. Mater., 2003, 2, 821–826 CrossRef CAS PubMed.
- W.-C. Huang, L.-M. Lyu, Y.-C. Yang and M. H. Huang, J. Am. Chem. Soc., 2012, 134, 1261–1267 CrossRef CAS PubMed.
- C. Burda, X. Chen, R. Narayanan and M. A. El-Sayed, Chem. Rev., 2005, 105, 1025–1102 CrossRef CAS PubMed.
- Y. Xia, X. Xia, Y. Wang and S. Xie, MRS Bull., 2013, 38, 335–344 CrossRef CAS.
- Sigma-Aldrich, Mater. Matters, 2008, 3, 17 Search PubMed.
- G. Radovsky, R. Popovitz-Biro and R. Tenne, Chem. Mater., 2014, 26, 3757–3770 CrossRef CAS.
- Y. C. Nah, I. Paramasivam and P. Schmuki, ChemPhysChem, 2010, 11, 2698–2713 CrossRef CAS PubMed.
- S. Berger, S. P. Albu, F. Schmidt-Stein, H. Hildebrand, P. Schmuki, J. S. Hammond, D. F. Paul and S. Reichlmaier, Surf. Sci., 2011, 605, L57–L60 CrossRef CAS.
- A. V. Getling, Rayleigh–Bénard Convection: Structures and Dynamics, World Scientific, 1998 Search PubMed.
- J. Israelachvili, Intermolecular & Surface Forces, Academic Press, London, 1992 Search PubMed.
- D. Myers, Surfaces, Interfaces and Colloids – Principles and Applications, Wiley-VCH, New York, 1999 Search PubMed.
- W. D. Harkins and Y. C. Cheng, J. Am. Chem. Soc., 1921, 43, 35–53 CrossRef CAS.
- A. Dupré, Theorie Mécanique de la Chaleur, 1869, 69 Search PubMed.
- C. Tanford, Proc. Natl. Acad. Sci. U. S. A., 1979, 76, 4175–4176 CrossRef CAS.
- C. Tanford, The hydrophobic effect: formation of micelles and biological membranes, Wiley, New York, 1980 Search PubMed.
- G. S. Hartley, Aqueous Solutions of Paraffin-Chain Salts: A Study in Micelle formation, Hermann & Cie, Paris, 1936 Search PubMed.
- N. T. Southall, K. A. Dill and A. D. J. Haymet, J. Phys. Chem. B, 2002, 106, 521–533 CrossRef CAS.
- L. Magnus Bergström, Thermodynamics of Self-Assembly, Application of Thermodynamics to Biological and Materials Science, ed. M. Tadashi, 2011, ISBN: 978-953-307-980-6, InTech, DOI: 10.5772/13711. Available from: http://www.intechopen.com/books/application-of-thermodynamics-to-biological-and-materials-science/thermodynamics-of-self-assembly.
- C. Tanford, Proc. Natl. Acad. Sci. U. S. A., 1974, 71, 1811–1815 CrossRef CAS.
- M. P. Baranello, L. Bauer and D. S. W. Benoit, Biomacromolecules, 2014, 15, 2629–2641 CrossRef CAS PubMed.
- L. Luo and A. Eisenberg, Langmuir, 2001, 17, 6804–6811 CrossRef CAS.
- F. Tantakitti, J. Boekhoven, X. Wang, R. V. Katzantsev, T. Yu, J. Li, E. Zhuang, R. Zandi, J. H. Ortony, C. J. Newcomb, L. C. Palmer, G. S. Shekhawat, M. Olvera de la Cruz, G. C. Schatz and S. I. Stupp, Nat. Mater., 2016, 15, 469–476 CrossRef CAS PubMed.
- J. H. Williams, Acc. Chem. Res., 1993, 26, 593–598 CrossRef CAS.
- J. Bokhoven, W. E. Hendriksen, G. J. M. Koper, R. Eelkema and J. H. van Esch, Science, 2015, 349, 1075–1079 CrossRef PubMed.
- J. England, J. Chem. Phys., 2013, 139, 121923 CrossRef PubMed.
Footnote |
| † Electronic supplementary information (ESI) available. See DOI: 10.1039/c6cs00115g |
| This journal is © The Royal Society of Chemistry 2016 |

