 Open Access Article
Creative Commons Attribution 3.0 Unported Licence
Correction: Number density distribution of solvent molecules on a substrate: a transform theory for atomic force microscopy
Ken-ichi
Amano
*a,
Yunfeng
Liang
b,
Keisuke
Miyazawa
c,
Kazuya
Kobayashi
ab,
Kota
Hashimoto
a,
Kazuhiro
Fukami
d,
Naoya
Nishi
a,
Tetsuo
Sakka
a,
Hiroshi
Onishi
e and
Takeshi
Fukuma
c
aDepartment of Energy and Hydrocarbon Chemistry, Graduate School of Engineering, Kyoto University, Kyoto 615-8510, Japan. E-mail: amano.kenichi.8s@kyoto-u.ac.jp
bEnvironment and Resource System Engineering, Kyoto University, Kyoto 615-8540, Japan
cDivision of Electrical Engineering and Computer Science, Kanazawa University, Kakuma-machi, Kanazawa 920-1192, Japan
dDepartment of Materials Science and Engineering, Graduate School of Engineering, Kyoto University, Kyoto 606-8501, Japan
eDepartment of Chemistry, School of Science, Kobe University, Nada, Kobe, Hyogo 657-8501, Japan
First published on 6th July 2016
Abstract
Correction for ‘Number density distribution of solvent molecules on a substrate: a transform theory for atomic force microscopy’ by Ken-ichi Amano et al., Phys. Chem. Chem. Phys., 2016, 18, 15534–15544.
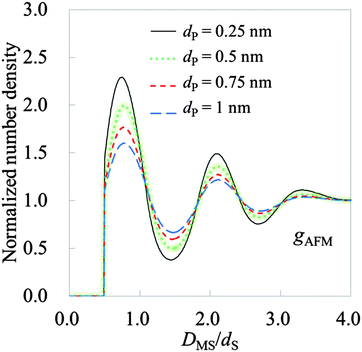
The original Fig. 8 and 9 should be replaced with the revised versions below. The original Fig. 8 was not the short range force curve, but that of the total force. In the revised figure, the short range force curve is shown, which is obtained by subtracting the long range force curve from the total force curve. The revised Fig. 9 is the hydration structure on mica calculated from the revised Fig. 8. In addition, the values 1.0 nm written in page 15541 of the published article should be replaced by 0.5 nm. Moreover, the following sentence written in page 15542 of the published article “In fact, the effective diameter of the real probe in this study has been estimated to be about 1.0 nm, which is three to four times larger than that of a water molecule.” should be replaced by “In fact, the effective diameter of the real probe in this study has been estimated to be about 0.5 nm, which is about two times larger than that of a water molecule.”.
The Royal Society of Chemistry apologises for these errors and any consequent inconvenience to authors and readers.
| This journal is © the Owner Societies 2016 |


