 Open Access Article
Creative Commons Attribution 3.0 Unported Licence
Effect of graphene support on large Pt nanoparticles†
L. G.
Verga
a,
J.
Aarons
a,
M.
Sarwar
b,
D.
Thompsett
b,
A. E.
Russell
a and
C.-K.
Skylaris
*a
aDepartment of Chemistry, University of Southampton, Highfield, Southampton SO17 1BJ, UK. E-mail: c.skylaris@soton.ac.uk
bJohnson Matthey Technology Centre, Blounts Court, Reading, Berkshire RG4 9NH, UK
First published on 18th November 2016
Abstract
State-of-the-art catalysts are often created via deposition of monolayers, sub-monolayers or nanoparticles of the catalytic material over supports, aiming to increase the surface area and decrease the loading of the catalytic material and therefore the overall cost. Here, we employ large-scale DFT calculations to simulate platinum clusters with up to 309 atoms interacting with single layer graphene supports with up to 880 carbon atoms. We compute the adsorption, cohesion and formation energies of two and three-dimensional Pt clusters interacting with the support, including dispersion interactions via a semi-empirical dispersion correction and a vdW functional. We find that three-dimensional Pt clusters are more stable than the two-dimensional when interacting with the support, and that the difference between their stabilities increases with the system size. Also, the dispersion interactions are more pronounced as we increase the nanoparticle size, being essential to a reliable description of larger systems. We observe inter-atomic expansion (contraction) on the closest (farthest) Pt facets from the graphene sheet and charge redistribution with overall charge being transferred from the platinum clusters to the support. The Pt–Pt expansion, which is related to the charge transfer in the system, correlates with the adsorption energy per Pt atom in contact with the graphene. These, and other electronic and structural observations show that the effect of the support cannot be neglected. Our study provides for the first time, to the best of our knowledge, quantitative results on the non-trivial combination of size and support effects for nanoparticles sizes which are relevant to catalyst design.
1 Introduction
During the last decades, the interest in more powerful and flexible ways to generate electricity is bringing special attention to fuel cell technology. First of all, fuel cells may help to reduce the dependence on fossil fuels and lower the emission of poisonous products into the atmosphere.1 Secondly, they are capable of producing electrical energy with higher efficiency and autonomy, allowing small fuel compartments to act as decentralized power plants. Among several options, the direct methanol and ethanol fuel cells, DMFCs and DEFCS, are emerging technologies with several possible applications due to the easiness of handling these fuels, their high energy densities, low pollutant emissions, and low working temperatures.2One of the main challenges on DEFCs is the search for efficient catalysts for the ethanol oxidation reaction in the anode, EOR,3 and the oxygen reduction reaction in the cathode, ORR.4 Platinum and platinum based alloys, are widely studied as excellent catalysts for both reactions, but due to the high cost of Pt, its inadequate global supply, and the slow kinetics of the ORR in pure Pt catalysts, it is necessary to search for different approaches to construct Pt based catalysts. Aiming to solve these problems, most of the catalyst researchers choose to disperse nanoparticles or monolayers of the catalyst material over supports as recently pointed in some review papers.3,5,6 Another interesting approach to design efficient catalysts is the usage of Pt monolayers as the external layer of core–shell structures.3,7,8 In both techniques, the main goal is to decrease the platinum loading, increase its surface area and decrease the overall cost of the catalyst.
Recently, studies regarding the stability of free and supported platinum clusters and its catalytic and electronic properties have increased considerably. From a theoretical point of view we can cite, for example, the work by Xiao and Wang,9 which treated isolated platinum clusters with up to 55 atoms in several 1D, 2D and 3D configurations. They constructed platinum clusters as open and closed structures and compared their stabilities via ab initio quantum mechanics simulations. In general, their results exhibit the existence of a wide number of Pt clusters isomers, showing similar binding energies for 2D and 3D structures in Pt systems with up to 9 atoms and an unequivocal preference for 3D structures in larger systems.
Even with the difficulties of growing large two-dimensional clusters of platinum, some of their unique characteristics make them very attractive for practical applications. As previously said, the usage of monolayers reduces the problem of high Pt loading. Moreover, the catalytic activity of platinum monolayers can be controlled by using different supports, enabling these catalysts to provide remarkable success for both anodic and cathodic reactions.7,8,10–12
Despite some advantages associated with metallic or oxidic supports, such as the easiness of growing Pt monolayers, the carbonaceous materials such as graphene, graphite, carbon black and carbon nanotubes are commonly used as catalysts supports on fuel cells applications. Among these materials, graphene is receiving special attention in these last few years due to some inherent advantages of its structure. First of all, the two-dimensional shape of graphene enables a surface area higher than other forms of carbon. Secondly, some of its characteristics, such as high electrical conductivity, good thermal stability, and electronic configuration with π orbitals able to interact with the d orbitals of the catalytic materials, makes graphene a promising material for fuel cell applications.6
Unfortunately, the adsorption energy between platinum clusters and pristine graphene is relatively weak, which can cause loss of catalyst surface, due to the agglomeration of Pt particles.13 Also, as the number of the atoms on platinum nanoparticles increases the interactions per Pt atom in contact with the graphene support decrease, leading to difficulties on growing large Pt monolayers over graphene supports.14
Studies aiming to understand the interaction between metallic systems and carbon-based supports and the efficiency of these catalysts for fuel cell applications are widely present in the literature.6,13–26 One interesting example is the work by Maiti and Ricca,20 where Au, Pt and Pd atoms, monolayers, multilayers, and clusters interacting with graphene supports were studied via DFT simulations. According to their results, only small Pt subnanoclusters are able to wet a graphene surface. Okazaki-Maeda et al.25 also investigated the interaction between Ptn clusters with (n ≤ 13) and graphene supports using ab initio simulations, achieving similar conclusions to Maiti and Ricca, and showed that 3D clusters are unequivocally more stable over graphene when the Pt cluster has more than 10 Pt atoms. Furthermore, other studies such as the work of Schneider et al.22 and Ramos-Sanchez and Balbuena23 showed that the interaction between platinum clusters and carbonaceous supports have a major contribution from van der Waals interactions.
Recently, graphene supports with point defects have also attracted attention from the scientific community. From a theoretical point of view, Fampiou and Ramasubramaniam17 studied Ptn (n ≤ 13) clusters interacting with pristine graphene and other types of defective graphene sheets using density functional theory and empirical potential simulations. They demonstrated that point defects can act as binding traps for Pt clusters, increasing the strength of the interaction. This work can not only help to elucidate the graphene–metal interaction, due to the natural defects present in experimental graphene, but can also be used to guide defect engineering in supports for fuel cells.
In addition to the support effects in the catalytic activity, the optimum size of Pt nanoparticles for EOR and ORR catalysts is still an unsolved problem. According to the experimental research, we expect great size dependence in the catalytic properties of metallic clusters with a diameter of 1–3 nm, which can be related not only with the size of the Pt nanoparticles but also with the possible structures that can be obtained in different sizes of these clusters.27 Moreover, both theoretical and experimental works show that the maximum mass activity for EOR and ORR tends to happen when the platinum cluster has a diameter between 2 and 2.5 nm.28–32 Nevertheless, some recent experimental works33–35 have been able to show promising results using metallic subnanoclusters (<1 nm) as catalysts, reaching high surface areas, good CO tolerance and high catalytic activity depending on the Pt cluster structure.
The study of catalysts and their reactions can largely benefit from quantum mechanical simulations. Conventionally, the recent works using quantum mechanical simulations have focused on studying small Pt clusters (≤1 nm) and extended Pt surfaces,15–23,25,26 leaving some unanswered questions related to this subject, such as the effects of the metallic nanoparticle size in the interaction with the support. Therefore, in this paper we present our calculations treating large platinum clusters over graphene with the ONETEP code for linear scaling DFT calculations.
First of all, we validate our calculations with the literature, simulating Ptn clusters with (n = 1–4) and comparing with the work of Fampiou and Ramasubramaniam.17 Secondly, we simulated Ptn systems (n = 1–55) constructed as two and three dimensional structures on graphene supports, aiming to check when a platinum monolayer differs significantly in stability from a Pt nanoparticle. Additionally, we simulated cuboctahedral Ptn with (n = 147, 309), which represents Pt nanoparticles with diameters close to 1.7 nm and 2.2 nm respectively, enabling us to see how the support and size effects can act to change the properties of platinum nanoparticles. The calculations were performed with and without dispersion interactions, which were included via the semi-empirical dispersion correction proposed by Grimme36 and by using a vdW exchange correlation functional, rVV10.37,38 We finish with discussions and conclusions highlighting the relevance of our results to catalyst design.
2 Methods
The calculations were carried out using the ONETEP code,39 which performs linear scaling DFT calculations. In our case, we use the ensemble DFT method, implemented by Serrano and Skylaris,40 which allows simulations on metallic structures with thousand of atoms. In ONETEP the density matrix is constructed from non-orthogonal generalised Wannier functions (NGWFs),41 and a matrix called density kernel. The NGWFs are localised functions which are expressed by a basis set of psinc functions.42 The radius of the NGWFs is an input parameter and the completeness of the basis set can be controlled by the psinc kinetic energy cutoff input parameter.Both the density kernel and the NGWFs are optimised self-consistently using a variational method for the total energy. The NGWFs can be optimised in situ, allowing the same variational freedom as regular plane waves approaches thus eliminating transferability problems that tend to occur with the usage of fixed local orbitals.
The projector augmented wave (PAW) method43 was used to describe the interaction of the core with the valence electrons. We adopted the generalised gradient approximation with the PBE,44 RPBE,45 and one vdW functional, the rVV10,37,38 as our exchange correlation functionals. We also included the empirical dispersion correction proposed by Grimme36 in the PBE and RPBE functionals, generating two variations here called PBE-D2 and RPBE-D2. The parameters used in the empirical dispersion correction were the same as the values proposed by Grimme for the carbon atoms,36 while for platinum atoms, the dispersion coefficient C6 and the van der Waals radius R0 were taken from the literature.23 The universal scaling factor S6, was also obtained from the literature being equal to 0.75 for the PBE functional36 and 1.25 for the RPBE functional.23
We set the kinetic energy cutoff to 550 eV for geometry optimisations and 850 eV for total energy and properties calculations. For each Pt (C) atom we assigned 12 (4) NGWFs with 9.0a0 radii. The NGWF conjugated gradient optimisation preconditioning parameter k046 used in our simulations was equal to 2.5a0−1, and the geometry optimisations were performed until the forces on all atoms being below 0.005 Eh a0−1.
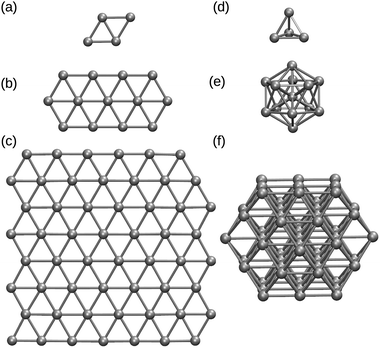
The nanoparticles (monolayers) were constructed with an initial Pt–Pt distance of 2.80 Å (2.60 Å)9 in the configurations shown in Fig. 1, where the cuboctahedral shape was used for Pt13, Pt55, Pt147, and Pt309. Orthorhombic simulation boxes were built allowing periodicity to the graphene sheet and a minimum gap of 10 Å between the borders and Pt atoms, making sure that the images would not affect the system we are studying. Two dimensional clusters were studied up to 55 Pt atoms.
We computed: (i) the adsorption energies EAD; (ii) the formation energy EFOR; and (iii) the cohesive energy of a free Pt cluster ECOH, which are defined as follows:
| EAD = EPtn/graph − (Egraph + EPtn) | (1) |
| EFOR = EPtn/graph − (Egraph + n × EPt) | (2) |
| ECOH = EPtn − n × EPt | (3) |
3 Results
3.1 Two and three dimensional Pt clusters
In this section we present our calculations in order to compare two and three dimensional Pt clusters interacting with a graphene support. Initially, we validated our calculations by reproducing results from Okazaki-Maeda et al.,25 and Fampiou and Ramasubramaniam17 on Ptn with (n = 1–4) subnanoclusters interacting with graphene, using the PBE exchange correlation functional. Despite the amount of theoretical work which highlights the success of PBE based functionals to deal with transition metals, the lack of dispersion interactions from this functional, intrinsically important to carbon-based materials, can be considered a problem that hinders the description of the entire system within this approach.To address this problem, we decided to use the PBE, and RPBE functionals with two variations here called PBE-D2, RPBE-D2, which are constructed using the D2 empirical approach of Grimme to include dispersion interactions. We also simulated our systems with the rVV10 exchange correlation functional, which is one of the so-called vdW density functionals designed to include the dispersion interactions via a fully non-local term depending on the electronic density.
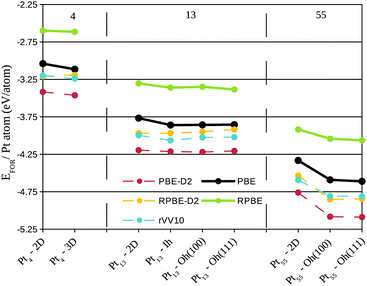
Fig. 2 shows the formation energy per Pt atom for the simulated systems up to Pt55, aiming to compare the stability of different clusters in contact with a pristine graphene. We can see that for any three and two dimensional clusters, with the same number of Pt atoms, the three-dimensional structures present lower formation energies, i.e. for all the simulated cases the closed Pt symmetries are more stable over the Pt monolayers when supported on graphene.
As the system size increases the difference in the formation energy between two and three dimensional clusters is enhanced. This effect is evidenced in Fig. 2 by comparing the two plateaus formed for Pt4 and Pt13 clusters and the decrease observed for Pt55 systems, especially if we take into account that in all the sizes the formation energy is being divided by the number of Pt atoms. We can see the same trend for all the simulated functionals. Obviously, the inclusion of dispersion interactions acts to decrease the formation energy for all the systems, and this effect increases with the cluster size, i.e., the difference in the formation energy between PBE and PBE-D2 is higher for Pt55 clusters than the observed for Pt4 clusters.
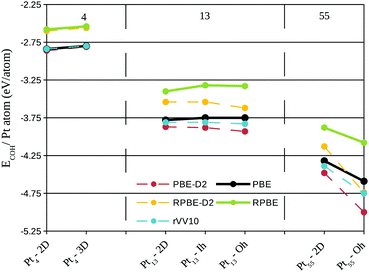
One of the reasons for higher stability of three-dimensional clusters can be understood through the cohesive energy of free Pt systems. In Fig. 3 we plotted the cohesive energies per Pt atom of Ptn clusters (n = 4–55) obtained with different functionals. The trends obtained in Fig. 2 and 3 are very similar, showing that the stability of the Pt–graphene systems is determined to a great extent by the Pt–Pt interactions.
It is also interesting to notice in Fig. 3 that the results obtained with the rVV10 functional are extremely close to the ones obtained with PBE. This trend can be seen as a favourable result of the rVV10 functional, as Fig. 3 treats isolated Pt clusters, which should not have large dispersion contributions. In large platinum clusters, the dispersion interactions obtained with the D2 method start to dominate, showing that maybe D2 overestimates the dispersion interactions in these systems.
As previously said, several experimental and theoretical studies have shown that as the number of Pt atoms in contact with the graphene increases the binding energy per contact atom decreases.6,14,20,22 Moreover, Fig. 2 shows that the dispersion interaction increases with the cluster size, even for the rVV10 functional which showed minor effects in isolated clusters, therefore it is expected that for larger clusters the interactions between metal clusters and carbon-based supports will be dominated by the dispersion interactions.
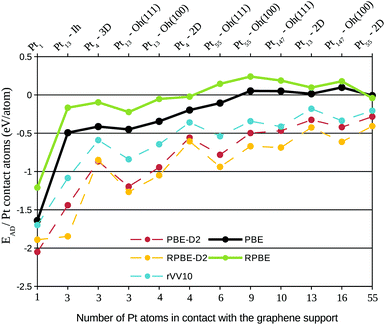
To illustrate both effects, the decrease in the binding energy per contact atom associated with the increase of Pt atoms in the interface region, and the importance of dispersion interactions to describe large systems, we plotted in Fig. 4 the adsorption energy per contact Pt atom for all the simulated functionals, ordering the systems according to the number of Pt atoms in the interface with the graphene support. We can observe that the adsorption energy per contact atom weakens as we increase the system size, being almost negligible for larger systems. It is also interesting to notice that the adsorption energy per contact atom strengthens for cuboctahedral clusters when the triangular (111) facet is close to the graphene. This decrease in Pt–C interaction associated with the increase of the number of Pt atoms in contact with the graphene can also lead to more difficulties on growing large Pt monolayers over graphene supports.
The dispersion interactions strengthen the adsorption energy per contact atom in all the systems. It is important to emphasize that the inclusion of dispersion was able to provide negative adsorptions energies for systems such as Pt55, Pt147, which are nanoparticles with diameter close to 1.1 nm and 1.7 nm respectively, and commonly seen over carbonaceous supports in experimental results,32,35,47,48 but have shown a highly positive (repulsive) adsorption energy when simulated without the dispersion interactions. This result shows that the Pt–C interaction in large platinum nanoparticles is dominated by dispersion, confirming the importance of dispersion for a reliable description of these systems.
Presently, no optimum functional to describe the dispersion interactions for all types of systems exists and it is difficult to clearly state which one has better accuracy without developing benchmarking tests with reliable experimental data. Still, it is pleasing to observe that we obtained similar qualitative behaviour with the three functionals that include dispersion interactions, even for the adsorption energy, which is a sensitive quantity.
Moreover, Björkman et al.49 recently simulated 74 different compounds from magnetic metals to wide-gap insulators with several types of functionals with vdW description. In their studies, they concluded that all the studied functionals were unable to give good results for all the properties simultaneously. Even though, in their results the rVV10 functional was capable of providing excellent geometries with the drawback of a stiff but consistent overestimation for the binding energies in layered compounds. From our results the rVV10 functional also appears to be one interesting option to include the dispersion interactions, as its physical description for fully metallic clusters (isolated Pt nanoparticles) is similar to what is obtained with the PBE and RPBE functionals, also rVV10 does not depend on parametrizations. There are also variations of rVV10, such as the rVV10-sol,50 which presented a good performance for graphite and similar systems, being interesting for further studies.
3.2 Analysis of geometrical and electronic effects of the graphene support on the platinum clusters
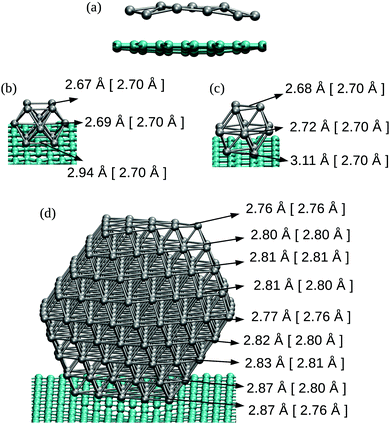
So far we have investigated the stability of different Pt clusters over a graphene support through the formation energies, and confirmed the importance of dispersion interactions through the adsorption energies results. We can now, explore the support effects on Pt clusters. The results presented in this section were obtained with rVV10. Simulations with RPBE-D2 are qualitatively similar, resulting in the same overall analysis, as can be seen by looking at the ESI.†The final structure after a geometry optimisation can provide a visual representation of the difficulties of growing monolayers on graphene. Fig. 5, shows the final geometries of Pt13 and Pt309 clusters interacting with the graphene support. It is possible to see that the interaction causes deformations on both geometries. For the Pt13 monolayer a repulsion between the support and the cluster appears, which is illustrated in Fig. 5(a), through the direction which the graphene support bends.
In Fig. 5(b) and (c) we can observe the average Pt–Pt bond length for different layers in a Pt13 cuboctahedral when (100) and (111) facets are optimised in contact with the graphene support. The Pt–Pt bond lengths in the closest (farthest) facets increase (decrease) in the supported cluster, as compared with the 2.70 Å Pt–Pt average bond lengths obtained after geometry optimisation in an isolated Pt13 cuboctahedron, which are presented between brackets. Fig. 5(d) illustrates the same effect for cuboctahedral Pt309, with almost no difference in the bond length averages of Pt layers far from the graphene support.
Structural changes are also observed in the graphene sheet with C–C bond length expanding to values up to 1.45 Å from the isolated graphene value 1.43 Å in the closest regions to the metallic nanoparticle. The comparison with the smaller clusters in contact with the support shows that for larger clusters the changes in the Pt–Pt bond length are diminished. Such effect is expected once the Pt–graphene interaction weakens as the number of Pt atoms in the interface increase, moreover, the enhancement in the number of intermediate layers helps to dilute the contractions of Pt–Pt bond lengths in the farthest facets. Pt–Pt bond length averages per Pt layer for all the cuboctahedral clusters can be found in the ESI.†
Fig. 6 provides an analysis based on the average Pt–Pt strain for the platinum facet in the interface with the graphene support, showing a relation between the Pt–Pt strain and the adsorption energy per Pt atom in contact with the graphene support. Systems with a larger Pt–Pt strain have stronger adsorption per contact atom, and larger deformations are present when the triangular facet (111) is in contact with the graphene system.
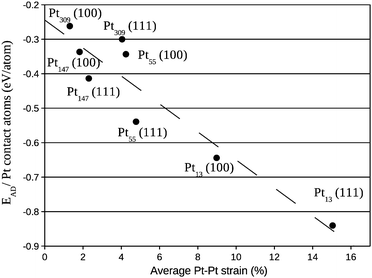 | ||
| Fig. 6 Adsorption energy per Pt atom in contact with the graphene support versus the average percentage of Pt–Pt bond length expansion in the nanoparticle facet in contact with the graphene sheet. | ||
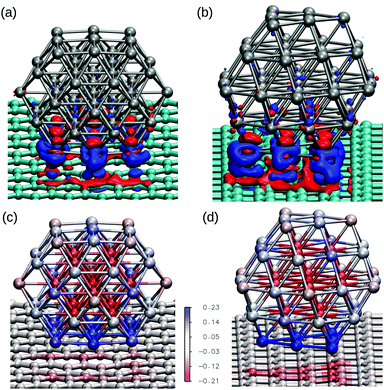
To understand the causes of the Pt–Pt deformations we have investigated the electronic changes in the graphene support and in the platinum cluster caused by the interaction. Fig. 7(a) and (b) show charge rearrangements through electronic density differences plots of Pt55 cuboctahedral with the (100) and (111) facets interacting with graphene, providing a visual representation of the charge transfer between Pt and C atoms in the cluster/support interface. The cuboctahedral with the (111) facet in contact with the graphene, which has a stronger adsorption energy per contact atom, shows larger charges redistributions. Moreover, Fig. 7(c) and (d) show the Mulliken charges for each atom within a colour scale for the same systems, evidencing the interaction of the bottom facet with the graphene, with charge transfer from the metallic cluster to the support.
A deeper analysis of the charge transfer is performed in Fig. 8, where the charge difference per atom in the nearest Pt facet was calculated via Mulliken population analysis and plotted against the average Pt–Pt strain. As also reported in other studies,14,17,23,25,26,51 electrons moved from the Pt cluster to the support for small clusters interacting with the support. Moreover, a clear relation between the average Pt–Pt strain and the charge transferred per Pt atom in the Pt/graphene interface can be observed.
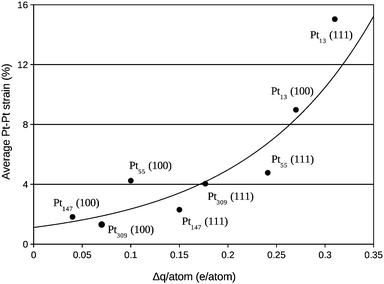 | ||
| Fig. 8 Average percentage of Pt–Pt bond length expansion in the nanoparticle facet in contact with the graphene versus the charge transfer per Pt atom in the same nanoparticle facet. | ||
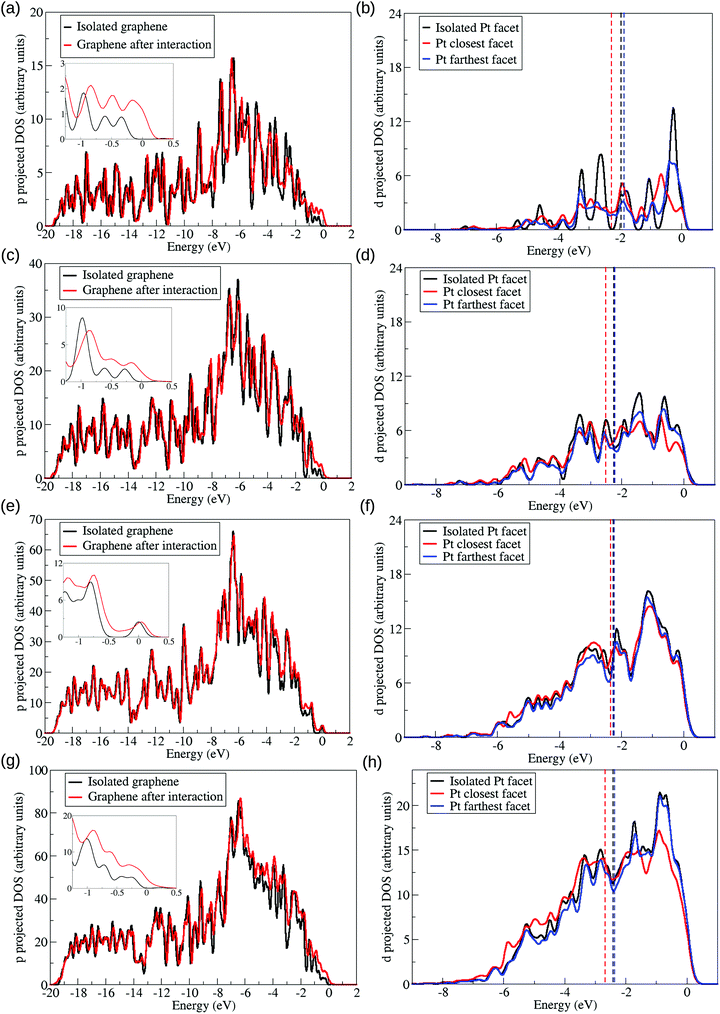
We also plotted in Fig. 9 the density of states normalised by the occupancies and projected on the d (p) angular momenta of Pt (C) atoms. Changes in the d-band centre are commonly used as a descriptor of the catalytic activity of metallic clusters, downshifts (upshifts) of the d-band centre in catalysts are usually associated with catalysts more efficient for bond making (breaking) reactions. Moreover, previous studies have discussed that bond lengths strain and ligand effects can change the d-band centre of metallic clusters and their catalytic activities.52
The density of states was projected onto chosen Pt and C atoms. The p-band of carbon atoms in the interacting region of the graphene sheet were plotted considering the system before and after the interaction in Fig. 9(a), (c), (e), and (g) which represents respectively, the interaction with the Pt13, Pt55, Pt147, and Pt309 cuboctahedral nanoparticles. Meanwhile, Fig. 9(b), (d), (f), and (h) represents the d-band of Pt13, Pt55, Pt147, and Pt309 cuboctahedral nanoparticles in closest and farthest facets from the graphene support. The projected densities of states were analysed only for nanoparticles with (111) facet interacting with the support.
The relation between changes in the d-band centre and the Pt–Pt bond lengths strain is explained in the literature with the Nørskov d-band centre model.52,53 According to this model, the changes in the d-band centre are related to the changes in the bandwidth induced by the bond length strain, i.e., considering that the number of electrons in the d-band remains constant, a expansive (compressive) strain would lead to a narrow (wider) bandwidth which consequently should generate an upshift (downshift) in the d-band centre to preserve the band filling.
Meanwhile, ligand effects are related to the electronic changes caused by the interaction between catalytic material and support. In practice it is difficult to separate ligand and strain effects, but it is possible to find in the literature publications exploiting both effects to explain changes in the d-band centre. One good example is the work developed by Tsai et al.,10 which showed changes in the catalytic activity of core–shell Os/Pt catalysts with different number of Pt monolayers, that the strain effects were not capable of explaining.
As previously said, we are presenting the density of states weighted by the occupancies, meaning that the states with higher energy in Fig. 9 represent states close to the Fermi level. In the density of states, we observed a lowering in the peaks for the higher energy states in the interface Pt facet after the interaction with the support, while similar states in the graphene p-band increased, as shown in the insets in Fig. 9(a), (c), (e), and (g). This effect, coupled with the electron density differences and the Mulliken population analysis, shows the existence of interaction between the p-band of the carbon atoms with the d-band of the Pt atoms, with charge redistribution from the Pt to the carbon atoms, followed by a C–C bond length expansion in the interface region of the graphene support. These effects are consistent with the Dewar–Chatt–Duncanson model,54–56 as previously shown by Mahmoodinia et al.57 in the interaction of a Pt cluster and a polyaromatic hydrocarbon.
The d-band of the farthest Pt facet from the support shows different trends when compared with the isolated Pt and with the closest Pt facet, showing that the support effect changes each Pt facet differently. As we grow the system size, the differences between supported and isolated systems for the top facet starts to be negligible, as a direct result of the decrease in the Pt/support interaction per atom, and the increase in the number of Pt layers between this facet and the support. Fig. 9 also shows downshifts in the d-band centre of the Pt facets close to the graphene, indicated by vertical dashed lines.
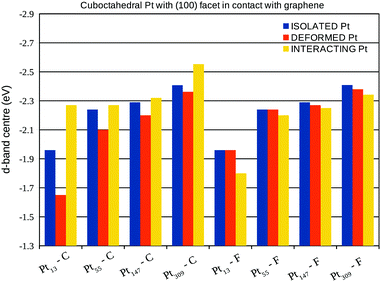
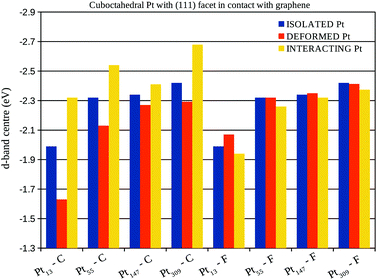
A more detailed analysis of the support effect on the d-band centre of Pt nanoparticles is presented in Fig. 10 and 11, which show the d-band centre from closest (C) and farthest (F) Pt facets from the graphene sheet considering, respectively, the interaction of (100) and (111) Pt facets with the support. Aiming to separate the electronic and geometrical effects caused by the interaction with the support, we calculate the projected density of states using three different configurations: (i) isolated Pt clusters with the structure obtained after geometry optimisations in vacuum, here called isolated Pt; (ii) isolated Pt clusters using the structure obtained via geometry optimisations of the Pt/graphene systems, here called deformed Pt and; (iii) the whole Pt/graphene system, here called interacting Pt.
The comparison between the isolated Pt and the deformed Pt configurations enables us to compute the effects of geometrical changes on the d-band centre, while, the interacting Pt configuration includes all the support effects. In general, the interaction with the support leads to downshifts (upshifts) in the d-band centre of closest (farthest) Pt facets from the graphene surface, which is the opposite effect expected, if we consider the changes in the d-band centre generated only due to the Pt–Pt bond lengths strains.
In fact, the comparisons with the deformed Pt configuration show the existence of two concurrent effects, the first one is the change in the d-band centre due to the Pt–Pt strain. This effect can be observed by comparing the d-band centre of deformed Pt and isolated Pt systems in Fig. 10 and 11 with the Pt–Pt bond lengths expansions from Fig. 6. For all the studied sizes and different facets in contact with the graphene, larger expansions lead to greater upshifts in the d-band centre.
The second effect is related to the electron loss from the high energy occupied states from the d-band of Pt due to the Pt–C interactions, which lowers the weight of high energy levels in the d-band centre calculation, generating the observed downshifts. This effect can be clearly shown comparing the d-band centre of interacting Pt and deformed Pt systems in Fig. 10 and 11 with the charge transfer previously presented in Fig. 8, systems with larger charge transfer per number of Pt contact atoms present larger downshifts in the d-band centre.
The analysis of isolated systems also shows upshifts in the d-band centre with the decrease in the system size. Similar size effects were already reported as a result of stronger CO adsorption in platinum cuboctahedral clusters due to the decrease in the nanoparticle size.58 As shown in the Fig. 10 and 11, the support effects in the d-band centre are size-dependent, being more pronounced in smaller clusters, once the Pt–C interaction weakens with the number of Pt in contact. Therefore, the size effect trend for d-band centres of platinum nanoparticles interacting with a graphene support is no longer the same as those obtained for isolated systems, which indicates that it may be possible to search for optimum catalysts for specific reactions by linking support and size effects.
4 Conclusions
We presented a DFT study of support and size effects of Pt nanoparticles on graphene, where we have simulated systems ranging from Pt1 on 308 carbon atoms to Pt309 on 880 carbon atoms. We compared two-dimensional and three-dimensional Pt clusters interacting with the graphene support, and we have found that nanoparticles are generally more stable than monolayers when supported by a graphene sheet. The differences between their stabilities increase with the size of the system, and the Pt–Pt interactions, as represented by the cohesive energies, control to a great extent the formation energies of such systems.The dispersion interactions were included in our simulations via a semi-empirical dispersion correction and a vdW functional. Our results show that the adsorption energy per Pt contact atom decreases with the number of Pt atoms in contact with the graphene. Meanwhile, the formation energies show that the dispersion interaction grows with the system size. The combination of these two effects make the inclusion of dispersion interactions important for an accurate description, especially for large systems. We also found that the vdW functional gives a more reliable description of these systems.
Furthermore, we studied the effects of the graphene support over the geometries and electronic properties of Pt clusters. The Pt–Pt distances increase (decrease) in the closest (farthest) Pt facets from the graphene sheet, as a result of the electron redistribution between Pt and graphene. We were also able to correlate the Pt–Pt expansion in the closest facet with the adsorption energy per number of Pt atoms in contact with the graphene support, i.e., Pt systems with larger expansions showed more intense interactions with the graphene sheet.
In terms of electronic effects, analysed by electronic density difference plots, charge differences obtained via Mulliken populations and densities of states projected on the d-band of Pt atoms and p-band of carbon atoms, we found considerable electron redistributions, with overall charge being transferred from the platinum cluster to the graphene support. Moreover, the Pt–Pt bond length strain and electron transfer from Pt to the graphene changes the d-band centre, which is one descriptor for the catalytic activity of the metallic surfaces, indicating that is possible to modify the catalytic activity by combining support and size effects. As Pt nanoparticles supported on carbon are commonly used as catalysts in important technological applications such as fuel cells, we expect that the results of this study will be useful to the development of new catalysts.
Acknowledgements
L. G. V. acknowledges the support of Brazilian Government's Science Without Borders Programme (CNPQ: 206419/2014-7). J. A. acknowledges an EPSRC CASE PhD studentship supported by Johnson Matthey. We are grateful for access to the ARCHER national supercomputer via the UKCP consortium (EPSRC grant number: EP/K013556/1). We are also grateful for access to the University of Southampton supercomputers Iridis3 and Irirdis4.References
- S. Song and P. Tsiakaras, Appl. Catal., B, 2006, 63, 187–193 CrossRef CAS.
- M. Z. F. Kamarudin, S. K. Kamarudin, M. S. Masdar and W. R. W. Daud, Int. J. Hydrogen Energy, 2013, 38, 9438–9453 CrossRef CAS.
- J. Friedl and U. Stimming, Electrochim. Acta, 2013, 101, 41–58 CrossRef CAS.
- M. Shao, Q. Chang, J.-P. Dodelet and R. Chenitz, Chem. Rev., 2016, 116, 3594–3657 CrossRef CAS PubMed.
- M. T. M. Koper, Nanoscale, 2011, 3, 2054–2073 RSC.
- S. Navalon, A. Dhakshinamoorthy, M. Alvaro and H. Garcia, Coord. Chem. Rev., 2016, 312, 99–148 CrossRef CAS.
- R. Loukrakpam, Q. Yuan, V. Petkov, L. Gan, S. Rudi, R. Yang, Y. Huang, S. R. Brankovic and P. Strasser, Phys. Chem. Chem. Phys., 2014, 16, 18866–18876 RSC.
- M. Li, P. Liu and R. R. Adzic, J. Phys. Chem. Lett., 2012, 3, 3480–3485 CrossRef CAS PubMed.
- L. Xiao and L. Wang, J. Phys. Chem. A, 2004, 108, 8605–8614 CrossRef CAS.
- H.-C. Tsai, Y.-C. Hsieh, T. H. Yu, Y.-J. Lee, Y.-H. Wu, B. V. Merinov, P.-W. Wu, S.-Y. Chen, R. R. Adzic and A. W. Goddard, ACS Catal., 2015, 5, 1568–1580 CrossRef CAS.
- X. Xia, G. Jones, M. Sarwar, Q. Tang, I. Harkness and D. Thompsett, J. Mater. Chem. A, 2015, 3, 24504–24511 CAS.
- J. L. R. Yates, G. H. Spikes and G. Jones, Phys. Chem. Chem. Phys., 2015, 17, 4250–4258 RSC.
- B. H. Morrow and A. Striolo, Nanotechnology, 2008, 19, 195711 CrossRef PubMed.
- X. Liu, Y. Han, J. W. Evans, A. K. Engstfeld, R. J. Behm, M. C. Tringides, M. Hupalo, H.-Q. Lin, L. Huang, K.-M. Ho, D. Appy, P. A. Thiel and C.-Z. Wang, Prog. Surf. Sci., 2015, 90, 397–443 CrossRef CAS.
- P. Błoński and J. Hafner, J. Chem. Phys., 2011, 134, 154705 CrossRef PubMed.
- T. Daio, A. Staykov, L. Guo, J. Liu, M. Tanaka, S. M. Lyth and K. Sasaki, Sci. Rep., 2015, 5, 13126 CrossRef CAS PubMed.
- I. Fampiou and A. Ramasubramaniam, J. Phys. Chem. C, 2012, 116, 6543–6555 CAS.
- I. Fampiou and A. Ramasubramaniam, J. Phys. Chem. C, 2013, 117, 19927–19933 CAS.
- D.-H. Lim and J. Wilcox, J. Phys. Chem. C, 2011, 115, 22742–22747 CAS.
- A. Maiti and A. Ricca, Chem. Phys. Lett., 2004, 395, 7–11 CrossRef CAS.
- Y. Okamoto, Chem. Phys. Lett., 2006, 420, 382–386 CrossRef CAS.
- W. B. Schneider, U. Benedikt and A. A. Auer, ChemPhysChem, 2013, 14, 2984–2989 CrossRef CAS PubMed.
- G. Ramos-Sanchez and P. B. Balbuena, Phys. Chem. Chem. Phys., 2013, 15, 11950–11959 RSC.
- C. F. Sanz-Navarro, P.-O. Åstrand, D. Chen, M. Rønning, A. C. T. van Duin, T. Jacob and W. A. Goddard, J. Phys. Chem. A, 2008, 112, 1392–1402 CrossRef CAS PubMed.
- K. Okazaki-Maeda, Y. Morikawa, S. Tanaka and M. Kohyama, Surf. Sci., 2010, 604, 144–154 CrossRef CAS.
- Q. Qi, H. Liu, W. Feng, H. Tian, H. Xu and X. Huang, Comput. Mater. Sci., 2015, 96(part A), 268–276 CrossRef CAS.
- F. Baletto and R. Ferrando, Rev. Mod. Phys., 2005, 77, 371–423 CrossRef CAS.
- J. Perez, V. A. Paganin and E. Antolini, J. Electroanal. Chem., 2011, 654, 108–115 CrossRef CAS.
- G.-F. Wei and Z.-P. Liu, Phys. Chem. Chem. Phys., 2013, 15, 18555–18561 RSC.
- V. Viswanathan and F. Y.-F. Wang, Nanoscale, 2012, 4, 5110–5117 RSC.
- V. Tripković, I. Cerri, T. Bligaard and J. Rossmeisl, Catal. Lett., 2014, 144, 380–388 CrossRef.
- M. Shao, A. Peles and K. Shoemaker, Nano Lett., 2011, 11, 3714–3719 CrossRef CAS PubMed.
- S. Proch, M. Wirth, H. S. White and S. L. Anderson, J. Am. Chem. Soc., 2013, 135, 3073–3086 CrossRef CAS PubMed.
- R. Siburian, T. Kondo and J. Nakamura, J. Phys. Chem. C, 2013, 117, 3635–3645 CAS.
- T. Imaoka, H. Kitazawa, W.-J. Chun, S. Omura, K. Albrecht and K. Yamamoto, J. Am. Chem. Soc., 2013, 135, 13089–13095 CrossRef CAS PubMed.
- S. Grimme, J. Comput. Chem., 2006, 27, 1787–1799 CrossRef CAS PubMed.
- O. A. Vydrov and T. Van Voorhis, J. Chem. Phys., 2010, 133, 244103 CrossRef PubMed.
- R. Sabatini, T. Gorni and S. de Gironcoli, Phys. Rev. B: Condens. Matter Mater. Phys., 2013, 87, 041108 CrossRef.
- C.-K. Skylaris, P. D. Haynes, A. A. Mostofi and M. C. Payne, J. Chem. Phys., 2005, 122, 084119 CrossRef PubMed.
- A. Ruiz-Serrano and C.-K. Skylaris, J. Chem. Phys., 2013, 139, 054107 CrossRef PubMed.
- C.-K. Skylaris, A. A. Mostofi, P. D. Haynes, O. Diéguez and M. C. Payne, Phys. Rev. B: Condens. Matter Mater. Phys., 2002, 66, 035119 CrossRef.
- C.-K. Skylaris, A. A. Mostofi, P. D. Haynes, C. J. Pickard and M. C. Payne, Comput. Phys. Commun., 2001, 140, 315–322 CrossRef CAS.
- P. E. Blöchl, Phys. Rev. B: Condens. Matter Mater. Phys., 1994, 50, 17953–17979 CrossRef.
- J. P. Perdew and Y. Wang, Phys. Rev. B: Condens. Matter Mater. Phys., 1992, 45, 13244–13249 CrossRef.
- B. Hammer, L. B. Hansen and J. K. Nørskov, Phys. Rev. B: Condens. Matter Mater. Phys., 1999, 59, 7413–7421 CrossRef.
- A. A. Mostofi, P. D. Haynes, C.-K. Skylaris and M. C. Payne, J. Chem. Phys., 2003, 119, 8842 CrossRef CAS.
- X. Li, X. Qiu, H. Yuan, L. Chen and W. Zhu, J. Power Sources, 2008, 184, 353–360 CrossRef CAS.
- K. J. J. Mayrhofer, B. B. Blizanac, M. Arenz, V. R. Stamenkovic, P. N. Ross and N. M. Markovic, J. Phys. Chem. B, 2005, 109, 14433–14440 CrossRef CAS PubMed.
- T. Björkman, A. Gulans, A. V. Krasheninnikov and R. M. Nieminen, J. Phys.: Condens. Matter, 2012, 24, 424218 CrossRef PubMed.
- T. Björkman, Phys. Rev. B: Condens. Matter Mater. Phys., 2012, 86, 165109 CrossRef.
- H. Shi, S. M. Auerbach and A. Ramasubramaniam, J. Phys. Chem. C, 2016, 120, 11899–11909 CAS.
- T. Bligaard and J. Nørskov, Electrochim. Acta, 2007, 52, 5512–5516 CrossRef CAS.
- B. Hammer and J. Nørskov, Adv. Catal., 2000, 45, 71–129 CAS.
- M. J. S. Dewar, Bull. Soc. Chim. Fr., 1951, 18, C79 Search PubMed.
- J. Chatt and L. A. Duncanson, J. Chem. Soc., 1953, 2939–2947 RSC.
- D. M. P. Mingos, J. Organomet. Chem., 2001, 635, 1–8 CrossRef CAS.
- M. Mahmoodinia, M. Ebadi, P.-O. Astrand, D. Chen, H.-Y. Cheng and Y.-A. Zhu, Phys. Chem. Chem. Phys., 2014, 16, 18586–18595 RSC.
- L. Li, A. H. Larsen, N. A. Romero, V. A. Morozov, C. Glinsvad, F. Abild-Pedersen, J. Greeley, K. W. Jacobsen and J. K. Nørskov, J. Phys. Chem. Lett., 2013, 4, 222–226 CrossRef CAS PubMed.
Footnote |
| † Electronic supplementary information (ESI) available. See DOI: 10.1039/c6cp07334d |
| This journal is © the Owner Societies 2016 |

