 Open Access Article
Photochemical recovery of europium from non-aqueous solutions
Bart
Van den Bogaert
a,
Lore
Gheeraert
a,
Mumin Enis
Leblebici
a,
Koen
Binnemans
b and
Tom
Van Gerven
*a
aKU Leuven Department of Chemical Engineering, Celestijnenlaan 200F, 3001 Heverlee, Belgium. E-mail: tom.vangerven@kuleuven.be; Tel: +32 16322342
bKU Leuven Department of Chemistry, Celestijnenlaan 200F, 3001 Heverlee, Belgium
First published on 17th October 2016
Abstract
The photochemical recovery of europium from non-aqueous media, more specifically alcohols, is studied. The recovery was performed by photochemical reduction of europium(III) to europium(II) and subsequent removal as the insoluble EuCl2. Two charge transfer bands are present in the UV-C region, one originating from the alcohol (around 230 nm) and the other from the chloride anion (at 271 nm), which are responsible for the photochemical reduction when the solution is illuminated by a medium-pressure mercury lamp. When using different alcohol solvents, a trend is observed with regards to the removal rate and efficiency, following methanol (MeOH) < ethanol (EtOH) < isopropanol (IPA) <50/50 v/v ethanol/isopropanol (EtOH/IPA). This trend can be explained by the solubility of EuCl2 in the different solvents, and by the photon absorption at the wavelengths which provoke the reduction. In a 50/50 v/v EtOH/IPA solution, it is observed that addition of chloride ions (as LiCl) intensifies the chloride-to-europium(III) CT band, effectively increasing the photon absorption in the 260–340 nm wavelength region. Moreover, addition of extra chloride ions decreases the solubility of EuCl2, which in turn accounts for a better recovery efficiency. However, this beneficial effect disappears when the water content rises above 1.5 wt%. For an EtOH/IPA solution with a high chloride concentration and low water content, it is feasible to recover europium from binary europium/yttrium mixtures with an efficiency of up to 94.7% and a purity of 96.7–99.8%, depending on the Eu/Y molar ratio. For higher yttrium excess, the removal rate of europium is higher, which is explained by the ability of yttrium to coordinate water molecules, decreasing the free water content in the solution. The fact that a large excess of yttrium does not compromise the removal rate of europium from the solution, proves that this technique has potential for europium recovery from red lamp phosphors (Y2O3:Eu3+), which consist entirely of europium and yttrium with a Eu/Y molar ratio of 1/20–1/30.
Introduction
The rare-earth elements, including europium, are a group of chemical elements of high importance for many high-tech applications and green technologies.1,2 Separation of these elements into pure fractions is an elaborate and difficult procedure, due to their similar chemical properties.3 Europium in particular can be efficiently recovered from a solution by means of selective reduction because of its typical redox behavior, for instance by photochemical reduction.4 Photochemical reduction of europium(III) to europium(II) and subsequent removal from the solution has been studied mostly in aqueous solutions, where europium is recovered as solid EuSO4. Different light sources have been used, such as excimer lasers and high- and low-pressure mercury lamps, and both chemical and light source parameters have been optimized to maximize the europium removal from rare-earth mixtures.5–19 This photochemical separation technique has proven to be able to recycle europium from europium/yttrium mixtures as found in red lamp phosphor powders in a one-step procedure with high efficiency (>95%) and purity (>98%).19 Photochemical recycling of europium in aqueous solutions is a very promising technique, but offers a main disadvantage, namely the use of deep-UV light of 240 nm and below. This light is difficult and hence expensive to produce in high intensities, therefore it would be interesting to be able to shift the wavelengths towards near-UV or even visible light.20The energy of the photons that trigger the photochemical reduction is determined by the solution, i.e. the solvent and additives. In aqueous solutions containing sulfate ions, two charge transfer bands (CT bands) are present, one at 188 nm (water-to-europium CT band) and the other at 240 nm (sulfate-to-europium CT band).14 By changing the solvent and additives, different CT bands can appear, which are related to photochemical reductions at other wavelengths.21 Preferentially, these new CT bands lie in longer wavelength regions, where the energy of the photons is lower. In alcohol solutions of europium(III) chlorides, two CT bands have been reported around 235 nm and around 271 nm, effectively shifting the photon absorption towards longer wavelengths.
In this study, emphasis is put on the photochemical separation of europium and yttrium in alcoholic media, a binary rare-earth mixture that is found in the red lamp phosphors of compact fluorescent lamps.22,23 This red phosphor is the main component with the highest value, and can be selectively isolated from the lamp phosphor blend.24Via selective photochemical reduction, europium and yttrium can subsequently be separated into pure fractions. Trivalent rare-earth chlorides are much more soluble in alcohols than divalent rare-earth chlorides. Therefore, photochemical reduction of europium(III) to europium(II) and subsequent precipitation as EuCl2 in the presence of chloride ions can be used as a europium separation technique from rare-earth mixtures.25 The influence of solvent, water content, chloride concentration and rare-earth composition is examined, as well as the reaction mechanism and the photon absorption in different wavelength intervals. The experiments are carried out with a medium-pressure mercury lamp (MPML) as a light source.
Experimental
Chemicals
Methanol, ethanol, isopropanol and mixtures of these alcohols were used as solvents (99.5%, VWR, Heverlee, Belgium). The rare earths europium and yttrium were added to the alcohol solvents as chloride hexahydrate salts (RECl3·6H2O, RE = Eu, Y) and had a purity of 99.9% (Acros Organics, Geel, Belgium). The europium concentration was kept constant at 10 mM. When added, the yttrium concentration was varied to fit the desired Eu/Y molar ratio. In the solutions containing LiCl, a concentration of 220 mM was added (99.99%, Sigma-Aldrich, Diegem, Belgium).Light source and set-up
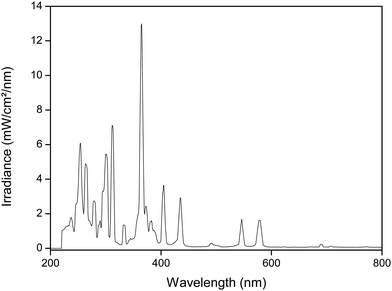
A 700 W medium-pressure mercury lamp (MPML) was used for the experiments (UV Technik). The lamp is equipped with a customized electronic ballast. The output profile of the lamp is shown in Fig. 1. A quartz cooling jacket around the lamp, connected to a Julabo FP45-HE cooling bath, enables to operate the MPML at 10 °C surface temperature for several hours. A cooled double-jacket reactor (V = 50 mL) is illuminated from the top and is magnetically stirred during irradiation. Samples are taken at regular time intervals via a tube and syringe. The reactor is covered by a quartz plate. A 160 W low-pressure mercury lamp (LPML) (UV Technik) was used in the same set-up. This lamp used a DVG200 electronic ballast (UV Technik) and had an arc length of 45 cm. For safety reasons, the complete set-up is constructed inside a ventilated dark box (PEC), to protect the surroundings from the hazardous UV light. Special UV safety goggles are worn during the experiment (LOT-QuantumDesign).Analysis
UV/Vis absorbance spectra were taken on a Varian Cary 5000 spectrometer in quartz cuvettes with a path length of 1 cm, in a wavelength range of 200–900 nm. The water content in the samples was measured via coulometric Karl-Fisher titration using a Mettler Toledo DL39 apparatus. The spectral output of the light sources is characterized by an Ocean Optics QE65 Pro Scientific irradiance spectrometer, operating in the wavelength region 200–900 nm. The spectrometer was equipped with a cosine corrector (diameter = 3900 μm) and measurements were taken at a distance of 2 cm, unless stated otherwise. The spectrometer was calibrated with a DH2000-Cal calibration light source.The metal concentration in solution was analyzed by Total Reflection X-Ray Fluorescence (TXRF), using a Bruker Picofox S2 spectrometer. 50 μL of the sample solution was mixed with 50 μL of a 1000 mg L−1 samarium standard and 900 μL of a MilliQ solution containing 2 vol% HNO3 and 10 vol% Triton X-100 surfactant. Of this mixture, a droplet of 2 μL was put on a quartz sample carrier, which was precoated with a silicone (SERVA, Heidelberg, Germany) solution to render it hydrophobic.
Precipitate purity was calculated by dissolving the EuCl2 precipitate in 1 M hydrochloric acid and measuring the amount of europium and yttrium in the sample using TXRF. Purities are given mole%.
Morphology studies on the EuCl2 precipitate were conducted using Scanning Electron Microscopy (SEM) combined with Energy-Dispersive X-ray spectroscopy (EDX). These measurements were performed on a Philips XL30 apparatus. The solid sample was dispersed in isopropanol and sonicated for 15 min. A droplet (10 μL) of the suspension was then put on a carbon tape sample holder and dried for 3 h in a vacuum chamber. A carbon coating of 35 nm was applied before placing the sample holder in the device.
Results and discussion
Fig. 2 shows the absorption bands of europium(III) chloride in methanol. In this UV/Vis spectrum, two broad charge transfer bands (CT bands) are visible, one accounting for an oxygen-to-europium(III) CT band (with the oxygen originating from the alcohol solvent) and the other corresponding to a halogen-to-europium(III) CT band, the halogen in this case being a chloride ion. The allocation of the CT bands has been hypothesized and proven earlier by Keller et al., by dissolving LnCl3 and LnBr3 (Ln = Eu, Sm, Pr) in different alcohol solvents (methanol, ethanol and n-propanol) and assessing which of the two bands shifted to different wavelengths.21 In Table 1, the maxima of both absorption bands are listed for all solvents used in this study, i.e. methanol (MeOH), ethanol (EtOH), isopropanol (IPA) and the 50/50 v/v mixtures of ethanol/isopropanol (EtOH/IPA) and methanol/isopropanol (MeOH/IPA).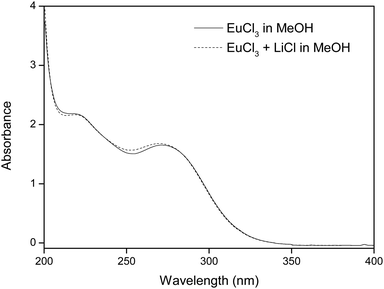 | ||
| Fig. 2 UV/Vis absorption spectrum of 10 mM EuCl3 in methanol, with and without addition of 220 mM LiCl. | ||
| Solvent | Alcohol-to-Eu(III) CT band (nm) | Chloride-to-Eu(III) CT band (nm) |
|---|---|---|
| MeOH | 226 | 272 |
| EtOH | 231 | 271 |
| IPA | 239 | 270 |
| EtOH/IPA | 236 | 271 |
| MeOH/IPA | 232 | 271 |
Qiu et al. described the photoreduction of europium in alcohols as a four-step process, with subsequent steps being: (1) dissolving and complexing, (2) photoexcitation, (3) electron transfer and (4) precipitation.8 The net outcome of the reaction is then EuCl2, which is insoluble in most alcohols, and various organic oxidation products. More detailed reactions can be expressed, where a distinction is made between the alcohol-to-europium(III) CT band on the one hand and the chloride-to-europium(III) CT band on the other hand. The former reaction is described by:9
 | (1) |
| [R2CHO˙H]+ → R2C˙OH + H+ | (2) |
 | (3) |
| Eu2+ + 2Cl− → EuCl2,solid | (4) |
 | (5) |
| Cl˙ + R2CHOH → R2C˙OH + HCl | (6) |
| Cl˙ + H2O → HCl + ˙OH | (7) |
| ˙OH + R2CHOH → R2C˙OH + H2O | (8) |
Both the chloride-to-europium(III) and the alcohol-to-europium(III) CT band result in the formation of an organic radical (see eqn (2) and (8)). This organic radical can cause an extra reduction of europium(III), which has already been reported in aqueous solution earlier:19
| R2C˙OH + Eu3+ → Eu2+ + R2CO + H+ | (9) |
In Fig. 3, the results for europium removal are shown in five different solvents, namely MeOH, EtOH, IPA and two 50/50 v/v mixtures, EtOH/IPA and MeOH/IPA.
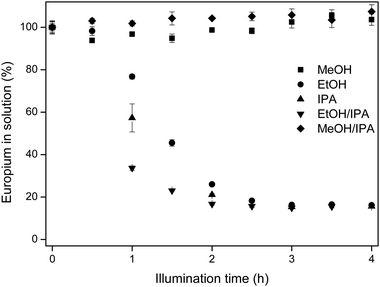 | ||
| Fig. 3 Europium removal in different solvents versus the illumination time. Solutions contained 10 mM EuCl3·6H2O. For EtOH/IPA and MeOH/IPA, 50/50 v/v mixtures were illuminated. | ||
In MeOH and MeOH/IPA, the removal of europium from the solution is not observed, as reflected in the concentration analysis and this is also visually confirmed, with the lack of solids in the reactor vessels at the end of the experiment. For the three other solvents, the europium concentration decreased over time until an equilibrium concentration was reached. For longer illumination times, no additional europium removal was observed. The fastest europium removal is detected in EtOH/IPA, followed by IPA and then EtOH.
The observed trend MeOH < EtOH < IPA can be explained by the stability of the radicals formed in eqn (2) and (8). The difference in illumination time between ethanol and isopropanol lies in the stability of the solvent radical, formed in eqn (4). For ethanol (R1 = CH3, R2 = H), the radical is less stabilized than for isopropanol (R1 = R2 = CH3). The reductive radicals formed in methanol are very unstable, since they are not stabilized by methyl groups (R1 = R2 = H). Therefore, the extra reduction of Eu(III) to Eu(II) (eqn (9)) follows the same trend.
Next to that, the absence of europium removal in methanol and methanol/isopropanol and the difference in removal efficiency in ethanol, isopropanol and the ethanol/isopropanol mixture is due to the solubility of EuCl2 in these different solvents. The EuCl2 solubility in methanol is very high (>250 mM), preventing precipitation subsequent to illumination. Even though Eu(III) is reduced to Eu(II), no isolation from the solution is possible through EuCl2 precipitation. In the other solvents, the solubility of EuCl2 decreases according to the series ethanol > ethanol/isopropanol > isopropanol as seen in Table 2.
| Solvent | Water content (wt%) | EuCl2 solubility (mM) | Error (mM) | Water content (wt%) | EuCl2 solubility (mM) | Error (mM) |
|---|---|---|---|---|---|---|
| a It is observed that upon dissolving EuCl2 in methanol, the solution turns yellow. | ||||||
| Methanola | 0.66 | >250 | — | — | — | — |
| Methanol + LiCla | 0.68 | >250 | — | — | — | — |
| Ethanol | 0.26 | 6.83 | 0.09 | 1.43 | 62 | 2 |
| Ethanol + LiCl | 0.13 | 0.96 | 0.02 | 1.44 | 48 | 4 |
| Isopropanol | 0.31 | 0.08 | 0.02 | 1.83 | 18.0 | 0.6 |
| Isopropanol + LiCl | 0.22 | 0.020 | 0.007 | 1.81 | 6.1 | 0.1 |
| Ethanol/isopropanol | 0.25 | 1.58 | 0.04 | 1.80 | 40 | 1 |
| Ethanol/isopropanol + LiCl | 0.18 | 0.80 | 0.01 | 1.86 | 30.3 | 0.9 |
The water content is another factor influencing the solubility of EuCl2. Since EuCl2 is well soluble in water, a high water content increases the solubility of EuCl2 in the mixture, resulting in a lower removal efficiency. Therefore, while a high water content will not interfere in the photochemical reduction itself, it can inhibit the formation of the precipitate, effectively preventing to obtain a high europium recovery yield. Water is inherently present in the solutions, since the rare-earth chlorides are added as hexahydrates. Moreover, to some extent the solvents also contain water. In principle, carrying out the process in anhydrous conditions could increase the yield of EuCl2, by using carefully dried solvents (for instance by molecular sieves) and anhydrous starting products, but on the other hand avoiding any water would complicate the set-up and handling. In Table 2, the EuCl2 solubility in the different solvents at various water contents is shown. In most experiments, the water content was kept below 0.50 wt%. The higher water contents (Table 2, fifth column) were obtained by adding a small volume of water to the samples. The solubilities in the presence of 220 mM LiCl are included and will be referred to later.
This trend in EuCl2 solubility is in accordance with the dielectric constants of these solvents, which describes the interaction between oppositely charged species and are shown in Table 3. For higher dielectric constants, the attraction between chloride anions and europium(III) cations is lower, therefore their interaction is weaker. Based on this parameter, it is obvious why EuCl2 remains in solution in methanol, since it has a much higher dielectric constants than the other solvents. This solvent characteristic parameter could therefore be a useful tool to select other solvents for future research.
| Solvent | Dielectric constant ε |
|---|---|
| Water | 78.3 |
| Methanol | 32.7 |
| Ethanol | 24.5 |
| Isopropanol | 17.9 |
Interestingly, and as already observed by Qiu et al., a 50/50 v/v mixture of ethanol and isopropanol shows even better performance than pure isopropanol.8 This is due to the broader charge-transfer band for the mixture, resulting in a better photon absorption in the wavelength regions corresponding to the photochemical reduction. A distinction is made between the photon absorption due to the alcohol-to-europium CT band and the chloride-to-europium CT band. Based on the UV/Vis spectra, the former is described by the photons absorbed between 220 nm and 260 nm, the latter is characterized by the interval between 260 nm and 340 nm (see Fig. 4).
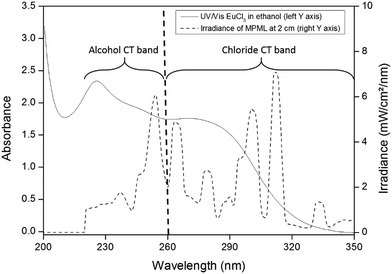 | ||
| Fig. 4 Overlay of UV/Vis spectrum and MPML irradiance output, with the wavelength interval of both CT bands indicated. | ||
The minimum between the two CT bands coincides with the minimum in irradiance output of the medium-pressure mercury lamp (MPML), at 260 nm. To analyze the amount of photons absorbed, a reactor containing the irradiated solution was placed between the MPML and an irradiance probe. The irradiance in the intervals 220–260 nm and 260–340 nm after passing through the different solutions was compared to that of the empty reactor. The results are shown in Table 4.
| Solvent containing 10 mM Eu3+ | 220–260 nm (mW cm−2) | Abs% | 260–340 nm (mW cm−2) | Abs% |
|---|---|---|---|---|
| Empty | 32.1 | 0.0 | 73.3 | 0.0 |
| MeOH | 2.48 | 92.3 | 17.1 | 76.7 |
| EtOH | 1.82 | 94.3 | 9.86 | 86.6 |
| IPA | 1.77 | 94.5 | 8.13 | 88.9 |
| EtOH/IPA | 1.66 | 94.8 | 9.37 | 87.2 |
| MeOH + LiCl | 2.17 | 93.2 | 15.4 | 79.0 |
| EtOH + LiCl | 1.80 | 94.3 | 9.02 | 87.7 |
| IPA + LiCl | 1.79 | 94.4 | 7.52 | 89.7 |
| EtOH/IPA + LiCl | 1.66 | 94.8 | 7.43 | 89.9 |
There is a higher absorption in the alcohol-to-europium charge transfer band, as compared to the chloride-to-europium CT band. The addition of LiCl intensifies the absorption in the 260–340 nm region, due to the higher chloride concentration in the solution. However, the most important observation is that the EtOH/IPA mixture has a higher photon absorption than the pure IPA solutions, which in turn shows more photon absorption as compared to pure ethanol solutions. This explains the trends in Fig. 3, where the performance of different solutions has been examined. Note that although there is no europium removal in methanol solutions, there is a considerable photon absorption in this solvent. This clearly indicates that the absence of europium removal in methanol is not necessarily due to the absence of photochemical reduction of europium, but rather a consequence of the high solubility of EuCl2, preventing the formation of a precipitate.
It is hypothesized that the addition of chloride ions, in this case in the form of LiCl salt, will enhance the separation of europium from Eu/Y mixtures, because of two reasons. Firstly, the presence of extra chloride ions will intensify the CT band at 271 nm, which contributes largely to the reduction of Eu(III).10 This intensified CT band can also be seen on a UV/Vis absorption spectrum (see Fig. 2). Secondly, a higher chloride concentration reduces the solubility of EuCl2 (see Table 2), effectively increasing the yield of the divalent species. This hypothesis confirmed in Fig. 5, where EtOH/IPA samples which contain no extra chlorides are compared to samples where 220 mM of LiCl was added. It is seen that the addition of chloride ions causes both faster europium removal and a higher recovery efficiency.
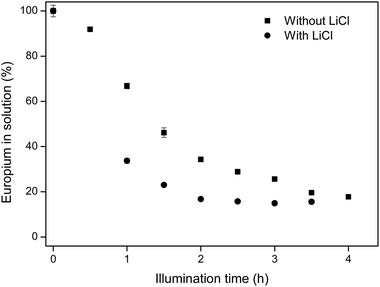 | ||
| Fig. 5 Comparison between europium removal in EtOH/IPA 50/50 v/v with and without addition of 220 mM LiCl. Initial europium concentration was 10 mM EuCl3·6H2O. | ||
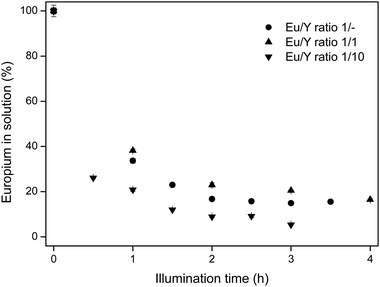
Based on the previously discussed results, photochemical recovery of europium works optimally in an EtOH/IPA 50/50 v/v mixture, in the presence of LiCl and a low water content. For these conditions, different Eu/Y molar ratios are tested, in order to determine the influence of an excess of yttrium. In commercial red lamp phosphors, the Eu/Y molar ratio varies between 1/20 and 1/30.28 In the experiments, synthetic mixtures of 1/1 and 1/10 Eu/Y molar ratios are tested. The results are shown in Fig. 6.
Since the yttrium concentration was not affected by the illumination and stayed constant at 100% ± 2% in all samples, this concentration is omitted from the graphs. Surprisingly, the presence of large amounts of yttrium does not affect the europium removal rate from the solution. On the contrary, for high yttrium concentrations, the removal is even slightly better than without the presence of yttrium. This could be due to the fact that yttrium binds up to eight water molecules in its first coordination sphere, which decreases the actual water content that the europium ions experience. Therefore, the efficiency of the charge transfer will be higher, since more solvent molecules or chloride ions are in the proximity of trivalent europium centers. Moreover, since yttrium is added as its chloride salt, the chloride concentration is slightly higher, resulting in a more intense chloride-to-europium CT band and lower EuCl2 solubility. This result clearly emphasizes the possibility of recovering europium from red lamp phosphor waste streams containing large amounts of yttrium.
In pure ethanol and pure isopropanol solutions, europium recovery from equimolar Eu/Y mixtures was also feasible, albeit with lower recovery than in the EtOH/IPA mixture. The results are shown in Fig. 7.
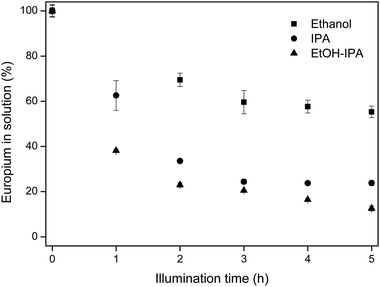 | ||
| Fig. 7 Europium removal in different solvents for equimolar Eu/Y mixtures. Initial rare-earth concentrations were 10 mM EuCl3·6H2O and 10 mM YCl3·6H2O. | ||
The purity of the EuCl2 precipitate in all solvents was very high, over 99.5%. In Table 5, a summary of the europium recovery efficiency and purity of the precipitate is displayed.
| Solvent | Eu/Y | LiCl | Recovery (%) | Puritya (%) |
|---|---|---|---|---|
| a For solutions containing only europium and no yttrium, no purity is calculated. | ||||
| MeOH | 1/— | No | 0 | — |
| MeOH | 1/— | Yes | 0 | — |
| EtOH | 1/— | Yes | 83.8 | — |
| EtOH | 1/1 | Yes | 44.7 | 99.6 |
| IPA | 1/— | Yes | 84.7 | — |
| IPA | 1/1 | Yes | 76.2 | 99.5 |
| EtOH/IPA | 1/— | No | 82.3 | — |
| EtOH/IPA | 1/— | Yes | 84.5 | — |
| EtOH/IPA | 1/1 | Yes | 87.9 | 99.8 |
| EtOH/IPA | 1/10 | Yes | 94.7 | 96.7 |
The precipitates were analyzed with scanning electron microscope (SEM) to check the morphology. The result is shown in Fig. 8. SEM images of the precipitate were obtained from the EtOH/IPA solution containing LiCl with a Eu/Y molar ratio of 1/10. The precipitate consists of aggregates of fine, sub-micron particles. The EDX analysis showed that the particles are made up from chloride and europium, but does not give additional information regarding the oxidation state of europium. The high europium purity of the precipitate is confirmed by the absence of yttrium peaks on the EDX spectrum. XRD studies showed that the material has a high amorphous content, hence no further conclusion regarding the oxidation state was drawn. However, since the particles only form when the solution is illuminated, it is assumed that they consist of EuCl2, as reported earlier.8
 | ||
| Fig. 8 SEM analysis of EuCl2 precipitate from EtOH/IPA solution containing Eu/Y 1/10 and 220 mM LiCl, with a magnification of 5000×. The EDX profile is shown on the right. | ||
Separation experiments were carried out using MPMLs, which have a broad output in the UV range and therefore emit photons of the appropriate energy. Attempts with low-pressure mercury lamps (LPMLs) proved unsuccessful, although the output spectrum of these lamps also coincides with the CT bands, since the peak output of a LPML is found around 254 nm. Even after 24 h of illumination, no europium removal was observed. The reason here is that the photon absorption with the much less intense LPMLs is not sufficient to obtain the reduction. The much stronger MPMLs emit a high amount of photons in the UV region, and many of them are absorbed by the europium ions. Since LPMLs are a factor 15× less intense in the wavelength range of interest, it is obvious why no reduction and EuCl2 precipitation is observed in the studied time frame when using these light sources (see Table 6).
| Light source | Irradiance 220–260 nm (mW cm−2) | Irradiance 260–340 nm (mW cm−2) | Irradiance 220–340 nm (mW cm−2) |
|---|---|---|---|
| LPML | 5.6 | 1.4 | 7.0 |
| MPML | 32.1 | 73.3 | 105.4 |
Compared to photochemical removal of europium in aqueous solutions, the wavelengths used to establish the reduction have shifted from 188 nm and 240 nm in water to 236 nm and 271 nm in EtOH/IPA, with the tail of the absorption band extending to even 340 nm. This is already a significant jump towards longer (and hence cheaper) UV light. Moreover, in alcohol solvents there is no negative influence of an excess of yttrium. On the contrary, a Eu/Y molar ratio of 1/10 in EtOH/IPA improves the europium removal rate and efficiency, whereas this yttrium excess in aqueous solutions causes an increased induction time and hence a longer illumination time.19
Conclusions
Photochemical reduction of europium in alcohol media takes place via two charge transfer bands in the UV-C region, i.e. an alcohol-to-europium(III) CT band around 235 nm and a chloride-to-europium(III) CT band around 271 nm. After reduction to europium(II), the reduced species is precipitated as EuCl2. The removal efficiency of europium depends on the alcohol solvent and follows the trend MeOH, MeOH/IPA < EtOH < IPA < EtOH/IPA, which corresponds to the trends in dielectric constant, the EuCl2 solubility, the stability of intermediarily formed radicals and the photon absorption. In solutions containing methanol, the solubility of EuCl2 is very high, therefore no europium removal is observed, even though the reduction takes place. High water contents (>1 wt%) also negatively affect the yield of solid EuCl2 since this product is highly water-soluble. Moreover, water molecules easily coordinate to the europium(III) centers, decreasing the amount of chloride and solvent molecules in the vicinity of the metals and hence lowering the charge transfer interactions with these species. This can be partially solved by adding extra chloride ions, as LiCl, to intensify the chloride-to-europium CT band as well as to decrease the EuCl2 solubility in the medium. Europium can be recovered very selectively and efficiently from europium/yttrium mixtures using this technique, with purities higher than 96.7% and yields up to 94.7%. With a large excess of yttrium present, the europium removal is enhanced, since yttrium could coordinate most of the water in the solution, permitting efficient photochemical reduction of europium. This shows great potential for the recovery of europium from red lamp phosphors, which entirely consist of europium and yttrium (Y2O3:Eu3+). An enhanced reactor design, optimizing the photochemical space-time yield (PSTY) and transitioning from batch to milliflow reactors could assist in the scale-up of this technique for future industrial applications.29,30References
- European Commission, Report on critical raw materials for the Eu, Ad Hoc working group on defining critical raw materials, 2014.
- US department of Energy, Critical Materials Strategy, DOE report, US Government Printing Office, Washington DC, 2011.
- C. K. Gupta and N. Krishnamurthy, Int. Mater. Rev., 1992, 37, 197–248 CrossRef CAS.
- C. A. Morais and V. S. T. Ciminelli, Hydrometallurgy, 2001, 60, 247–253 CrossRef CAS.
- H. L. Pinch, J. Am. Chem. Soc., 1964, 86, 3167–3168 CrossRef CAS.
- T. Donohue, US Pat., 4,172,775, 1979 Search PubMed.
- T. Donohue, J. Am. Chem. Soc., 1978, 100, 7411–7413 CrossRef CAS.
- L.-F. Qiu, X.-H. Kang and T.-S. Wang, Sep. Sci. Technol., 1991, 26, 199–221 CrossRef CAS.
- M. Kusaba, N. Nakashima, W. Kawamura, Y. Izawa and C. Yamanaka, Chem. Phys. Lett., 1992, 197, 136–140 CrossRef CAS.
- M. Kusaba, N. Nakashima, W. Kawamura, Y. Izawa and C. Yamanaka, J. Alloys Compd., 1993, 192, 284–286 CrossRef CAS.
- Y. Haas, G. Stein and R. Tenne, Isr. J. Chem., 1972, 10, 529–536 CrossRef CAS.
- Y. Haas, G. Stein and M. Tomkiewicz, J. Phys. Chem., 1970, 74, 2558–2562 CrossRef CAS.
- T. Donohue, Opt. Eng., 1979, 18, 181–186 CrossRef CAS.
- T. Donohue, J. Chem. Phys., 1977, 67, 5402–5404 CrossRef CAS.
- T. Hirai, N. Onoe and I. Komasawa, J. Chem. Eng. Jpn., 1993, 26, 64–67 CrossRef CAS.
- T. Hirai and I. Komasawa, Ind. Eng. Chem. Res., 1995, 34, 237–243 CrossRef CAS.
- C. A. Morais and V. S. T. Ciminelli, Sep. Sci. Technol., 2002, 37, 3305–3321 CrossRef.
- B. Van den Bogaert, L. Van Meerbeeck, K. Binnemans and T. Van Gerven, Green Chem., 2016, 18, 4198–4204 RSC.
- B. Van den Bogaert, D. Havaux, K. Binnemans and T. Van Gerven, Green Chem., 2015, 17, 2180–2187 RSC.
- L. H. Levine, J. T. Richards, J. L. Coutts, R. Soler, F. Maxik and R. M. Wheeler, J. Air Waste Manage. Assoc., 2011, 61, 932–940 CAS.
- B. Keller, K. Bukietynska and B. Jezowska-Trzebiatowska, Bull. l’académie Pol. des Sci., 1976, 24, 763–769 CAS.
- K. Binnemans, P. T. Jones, B. Blanpain, T. Van Gerven, Y. Yang, A. Walton and M. Buchert, J. Cleaner Prod., 2013, 51, 1–22 CrossRef CAS.
- K. Binnemans and P. T. Jones, J. Rare Earths, 2014, 32, 195–200 CrossRef CAS.
- D. Dupont and K. Binnemans, Green Chem., 2015, 17, 856–868 RSC.
- B. S. Hopkins and L. L. Quill, Proc. Natl. Acad. Sci. U. S. A., 1933, 19, 64–68 CrossRef CAS.
- M. Kusaba, Y. Tsunawaki and N. Nakashima, J. Photochem. Photobiol., A, 1997, 104, 35–37 CrossRef CAS.
- A. A. Maryott and E. R. Smith, Table of dielectric constants of pure liquids, US Government Printing Office, Washington DC, 1951 Search PubMed.
- C. Ronda, Luminescence: From Theory to Applications, Wiley-VCH, Weinheim, 2008 Search PubMed.
- M. E. Leblebici, G. D. Stefanidis and T. Van Gerven, Chem. Eng. Process. Process Intensif., 2015, 97, 106–111 CrossRef CAS.
- D. Cambié, C. Bottecchia, N. J. W. Straathof, V. Hessel and T. Noël, Chem. Rev., 2016, 116, 10276–10341 CrossRef PubMed.
| This journal is © the Owner Societies 2016 |

