Stabilizing effect of TMAO on globular PNIPAM states: preferential attraction induces preferential hydration†
Received
30th August 2016
, Accepted 3rd November 2016
First published on 3rd November 2016
Abstract
We study the effect of the organic co-solute trimethylamine N-oxide (TMAO) on the volume phase transition of microgel particles made from poly(N-isopropylacrylamide) (PNIPAM) using dynamic light scattering (DLS) and all-atom molecular dynamics (MD) simulations. The DLS measurements reveal a continuous TMAO-induced shrinking process from a coil to a globular state of PNIPAM microgel particles. Analyzing the DLS data by the phenomenological Flory–Rehner theory verifies the stabilization of the globular state of the particles in the presence of TMAO. Complementary atomistic MD simulations highlight a pronounced accumulation of TMAO molecules around PNIPAM chains. We observe a significant preferential attraction between TMAO and the globular state of PNIPAM, which is additionally stabilized by a larger number of hydrating water molecules compared to pure aqueous solutions. Further DLS measurements were also conducted on PNIPAM suspensions with the co-solute urea added. The observed differences compared with the results obtained for TMAO support the proposed mechanism.
1 Introduction
Poly(N-isopropylacrylamide) (PNIPAM) is a thermoresponsive polymer. A coil-to-globule transition in aqueous solution above a lower critical solution temperature (LCST) can be observed which makes PNIPAM attractive for biomedical applications.1 The occurrence of the LCST can be explained by a temperature induced change of the number of hydrating water molecules.2–7 An early publication recognized the close relationship between the coil-to-globule transition for PNIPAM and the cold denaturation of proteins.8 Over the last years, experimental studies also focused on PNIPAM behavior in presence of aqueous osmolyte solutions.9–15
Naturally occurring osmolytes like urea, trimethylamine N-oxide (TMAO) or hydroxyectoine are low weight organic molecules which are part of an evolutionary strategy allowing organisms to survive under extreme environmental conditions.16 Thus, high temperatures, high pressures or high salinity significantly harm the cell metabolism and induce the denaturation of protein structures. Noteworthy, some bacteria as well as higher organisms are able to survive under these extreme environmental circumstances by producing osmolytes to counteract the osmotic stress. Osmolytes like TMAO, hydroxyectoine and others are known as protein protectants whereas urea, guanidinium and some salts impose protein structure denaturation (protein denaturants). It was argued17–21 that the delicate interplay between denaturants and protectants balances the contributions of the individual osmolyte species. Biological applications for protein protectants include pressure stabilization,22,23 fluidization of membranes24,25 and the stabilization of proteins in presence of high temperatures.16,26 In contrast to the less often studied protectants, the denaturing properties of urea and guanidinium were discussed in a series of publications.4,27–32 However, the detailed underlying interaction mechanism between solutes and osmolytes is yet to be clarified. As a more or less accepted consensus, a preferential exclusion of protectants from the protein surface is assumed whereas denaturants reveal a preferential binding mechanism. The theoretical framework describing these effects is given by the so-called law of matching water affinities.33 Although being attractive due to its simplicity, recent articles demonstrated the limitations of this concept in terms of concentration dependent binding effects for denaturants15,31,34 or well-known protein protectants that indeed induce denaturation.35,36 Henceforth, the chemical properties of solutes and osmolytes have to be studied in more detail for a deeper understanding of the resulting accumulation behavior.37–40 The properties of osmolytes and their influence on PNIPAM were already discussed in a series of publications.6,7,9–15,41–44 Recent experiments and simulations, for example, revealed a preferential binding of urea to PNIPAM which induces bridging effects that stabilize globular PNIPAM states even below the LCST.10,15 In contrast, more detailed studies for low urea concentrations below 1 mol L−1 indicated a preferential exclusion mechanism which stabilizes the coil state.15 Furthermore, it was also shown by Micciulla et al.15 that urea reveals a concentration dependent accumulation behavior. In fact, also the influence of TMAO on PNIPAM has been studied just recently.12,14 Recent experiments12 revealed that increasing concentrations of TMAO are accomplished by a decrease of the LCST. The authors of this study attribute their finding to the hydrogen bond cleavage of PNIPAM with water molecules due to a direct binding of TMAO.
In this article, we study the behavior of PNIPAM in TMAO solution by dynamic light scattering (DLS) experiments and computer simulations. TMAO has recently attracted a lot of interest due to its unique combined hydrophilic/hydrophobic properties,45 its effect on the structure of water,46–50 in combination with urea19,20,50 and its protection against pressure denaturation of proteins.22,23 Moreover, PNIPAM also reveals some interesting co-nonsolvency effects in binary mixtures51 whose origin is still highly debated.52–54 Sophisticated theories were also proposed to explain the observed effects of co-nonsolvency and the variation of the LCST in presence of co-solutes.34,55 Our experimental findings reveal a stabilization of the globular PNIPAM state below the LCST in presence of TMAO. Atomistic molecular dynamics (MD) simulations of a single PNIPAM chain in solution were conducted to shed light on the underlying mechanism. We found a preferential attraction of TMAO to the globular state, which is accompanied by a preferential hydration of PNIPAM as represented by additional hydrogen-bonded water molecules forming a thin water layer between TMAO and PNIPAM. It has to be mentioned that the preferential hydration of proteins was already proposed to occur uniquely in presence of a preferential exclusion behavior.56,57 In contrast to these assumptions, our results indicate that protectants like TMAO preferentially accumulate around macromolecules which results in a preferential hydration of PNIPAM due to the strong kosmotropic and hygroscopic properties of TMAO. In fact, this mechanism, which was suggested for other co-solutes like cryoprotectants,58,59 is in good agreement with the experimental results and allows us a qualitative explanation and interpretation of the DLS measurements. We also studied the influence of urea on PNIPAM by DLS experiments which additionally verifies our proposed mechanism due to the observed deviations from the results found for TMAO.
The paper is organized as follows. In the next section we present the theoretical background i.e. the Flory–Rehner and the Kirkwood–Buff theory in addition to a brief introduction into DLS experiments, which are needed for a meaningful interpretation of PNIPAM properties and the interaction with osmolytes. In Section 3, we give a brief description of the experiments and the simulation details. The results will be presented in the fourth section. We conclude and summarize in the last section.
2 Theoretical background
2.1 Flory–Rehner theory
The Flory–Rehner theory is a phenomenological theory to predict the swelling behavior of gels,60–62 which can be also used to describe the volume phase transition of PNIPAM macrogel62,63 and microgel samples.64–66 In short, a macromolecular gel is in thermodynamic equilibrium if the osmotic pressure Π in the gel is zero, which yields for a neutral gel| | 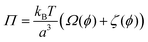 | (1) |
with
| Ω(ϕ) = [−ϕ − ln(1 − ϕ) − χϕ2] |
and
where the first term describes mixed solvent and macromolecular contributions and the second term in eqn (1) expresses the elastic contribution. Here, a is the monomer segment length, kBT the thermal energy with Boltzmann constant kB and temperature T and ϕ the volume fraction associated with the microgel particle. Moreover, the value ϕ0 denotes the volume fraction in the collapsed state. In case of a fully collapsed and dry gel, one can find ϕ0 = 1, whereas ϕ0 < 1 indicates that the gel, even in the collapsed state, is still slightly swollen.62,64 The average number of monomers between two cross-links is denoted by Ngel which is also the average degree of polymerization of the polymer chain. A large value of Ngel reveals a weakly cross-linked network and thus a soft gel.62,66 The Flory solvency parameter χ describes the polymer–solvent interaction and can be regarded as the central parameter in the phenomenological Flory–Rehner theory. For χ < ½, the polymer–solvent interactions are energetically preferred whereas for χ ≥ ½ solvent–solvent interactions are more favorable, which represents a poor solvent for the polymer.62 Furthermore, the solvency parameter depends on the change of the free energy ΔF when a solvent–solvent contact is replaced by a solvent–polymer contact62 and thus reads| |  | (2) |
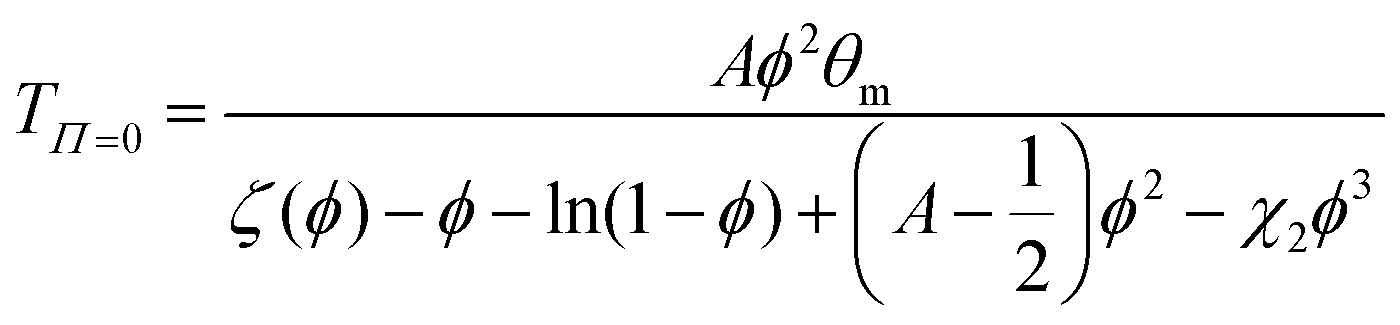
where ΔH and ΔS denote the corresponding change of enthalpy and entropy, respectively. In case of a volume phase transition, both contributions reveal ΔH < 0 and ΔS < 0. The parameters A = (2ΔS + kB)/kB and θm = 2ΔH/(2ΔS + kB) are directly related to these quantities at the temperature θm, where χ = ½. It was previously found for PNIPAM chains, that χ does not only depend on the temperature but also on the volume fraction ϕ with χ(T,ϕ) = χ1(T) + χ2ϕ + O(ϕ2)62,64,66 where χ1(T) reflects the temperature dependence and is given by eqn (2). The usage of these parameters up to the first order in ϕ has been shown to give a good description of the experimental data.64–66 Hence, the volume phase transition temperature reads| |  | (3) |
under the condition of thermodynamic equilibrium with ζ(ϕ) as defined by eqn (1).
Hydrodynamic radii obtained via DLS experiments and measured along the volume phase transition can be analyzed using the Flory–Rehner theory in terms of the swelling parameter
| | 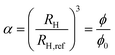 | (4) |
where
RH,ref denotes the hydrodynamic radius at a reference state which we choose to be the swollen, expanded state. Thus, for temperatures higher than the volume phase transition temperature with
α ≪ 1, the combination of
eqn (3) and (4) allows us to refine the experimental data. As
eqn (3) contains several parameters, care has to be taken that the refinement only yields physical meaningful results. We follow the approach of Fernandez-Barbero
et al.64 to avoid this ambiguousness. First, the parameters were chosen such that 0 ≤
χ1 ≤ 1, and second,
θm had to be close to the volume phase transition temperature
Tm obtained by the minimum of the temperature-derivative of the hydrodynamic radius. In addition, the volume fraction in the collapsed state,
ϕ0, and
Ngel had to be chosen such that these have, within the error, the same value for all different TMAO concentrations as the values of these parameters should not be affected by the addition of osmolytes. Moreover,
χ2 was assumed to be temperature independent in agreement with previous findings.
64–66
2.2 Analysis of binding mechanisms
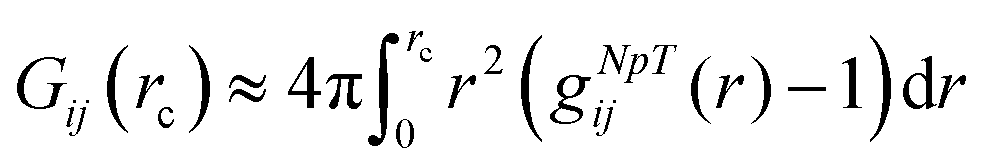
The Kirkwood–Buff theory allows us to study the accumulation properties of osmolytes around macromolecules.67 The Kirkwood–Buff (KB) integral in the μVT ensemble is given by| | 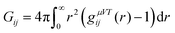 | (5) |
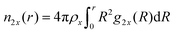
with the radial distribution function gij(r) between molecular species i and j.39,67–72 Since the full integration of the KB integral in computer simulations is not feasible, the introduction of a cut-off radius is necessary.70,73 In fact, the KB integrals can be also evaluated in the NpT or NVT ensemble68,70 such that the equation above can be rewritten as| | 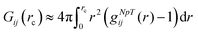 | (6) |
representing the excess volume of co-solute molecules j around the solute i with the cut-off radius rc.73 The solvent (water) will be usually denoted by the subscript i,j = ‘1’, the solute (PNIPAM) by ‘2’ and the osmolyte (TMAO) by ‘3’.
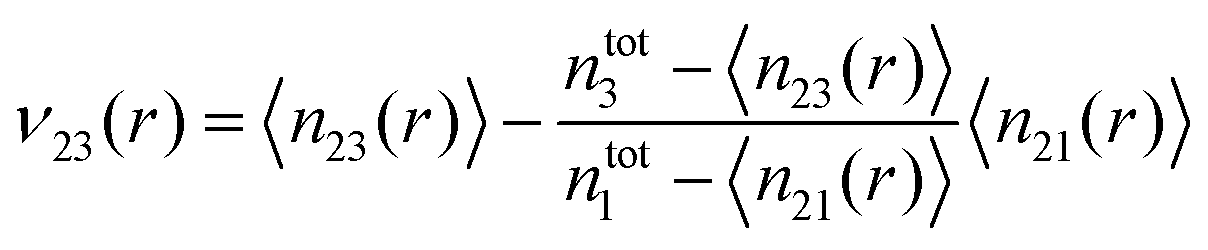
In the following, we omit the cut-off radius for reasons of clarity. The preferential binding coefficient ν23 between PNIPAM and TMAO can be obtained from the difference of the KB integrals in accordance to
where
ρ3 denotes the TMAO bulk number density. In fact, it was discussed in
ref. 70, that the preferential binding coefficient in computer simulations for distances
r ≥
rc can be also calculated by
| | 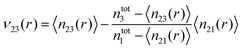 | (8) |
where 〈
n2x(
r)〉 denotes the time averaged cumulative number of molecular species (
x = 1, 3) around the solute and
ntotx the total number of molecules of species
x in the simulation box. In contrast to
eqn (7), the preferential binding coefficient
ν23 in
eqn (8) is corrected for a finite number of simulated molecules as it was discussed in
ref. 70. A preferential binding behavior can be detected for all values
ν23 > 1 whereas a preferential exclusion of species ‘3’ around solute ‘2’ is present for all values
ν23 < 1. The cumulative number of particles can be calculated by
| |  | (9) |
where
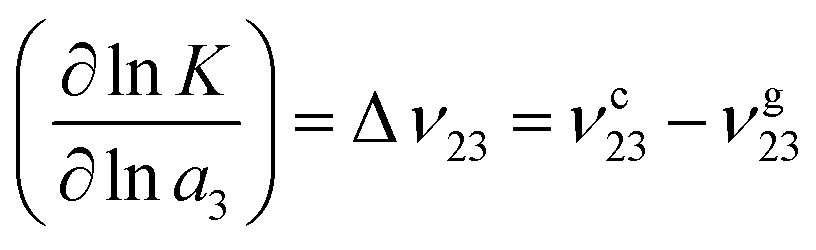
ρx represents the bulk number density of a specific species. Moreover, the chemical equilibrium constant
K can be associated with the preferential binding coefficients of TMAO to the coil and the globular PNIPAM conformation
70 (
νc23 for the coil and
νg23 for the globular conformation) in terms of
| | 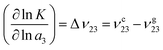 | (10) |
with the chemical activity
a3 of TMAO.
Eqn (10) can be interpreted as a shift of
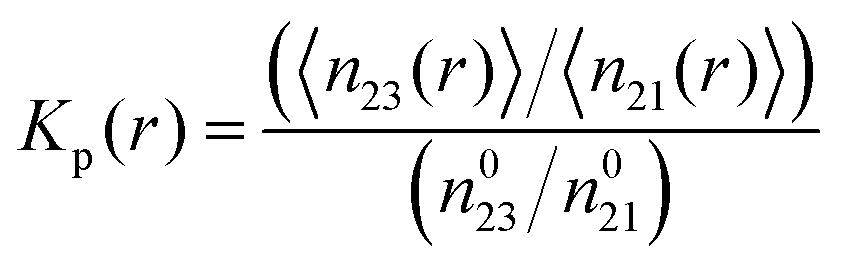
K to the conformation with a stronger osmolyte accumulation. Another robust parameter to study the osmolyte accumulation behavior is given by the local/bulk partition coefficient
15,43,74 according to
| | 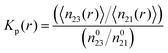 | (11) |
where the brackets denote the average number of water (1) or TMAO molecules (3) within a distance
r to PNIPAM and the superscript ‘0’ denotes the total number of TMAO or water molecules in the simulation box. Thus, a preferential exclusion behavior can be observed for
Kp(
r) < 1 in contrast to a preferential binding of the osmolyte for
Kp(
r) > 1 at short distances
r.
2.3 Dynamic light scattering
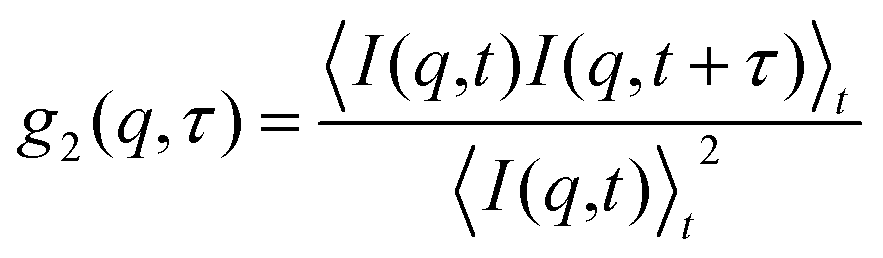
It is possible to study the dynamics of colloidal particles suspended in a solvent by dynamic light scattering (DLS).75 In a typical DLS measurement, the temporal intensity fluctuations of the scattering intensity I(q,t) from the sample illuminated by laser light are recorded yielding the normalized intensity autocorrelation function| | 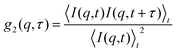 | (12) |
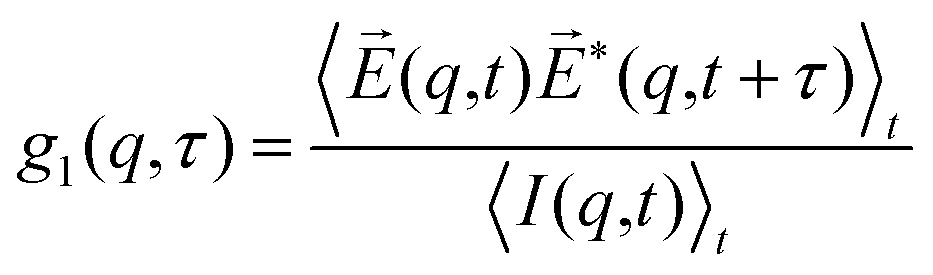
where  denotes the wave vector transfer with λ being the wavelength of the light, n the index of refraction of the solvent and Θ the scattering angle, at which the scattering signal is detected. The notation 〈…〉t indicates an average over time and τ denotes the lack time. For Gaussian statistics, the normalized intensity autocorrelation function g2(q,τ) is related to the normalized field correlation function g1(q,τ) with the electric field
 ![[E with combining right harpoon above (vector)]](https://www.rsc.org/images/entities/i_char_0045_20d1.gif) (q,t) of the scattered light
(q,t) of the scattered light| |  | (13) |
via the so-called Siegert relation| | | g2(q,τ) = 1 + β|g1(q,τ)|2 | (14) |
where β denotes the coherent contrast, which depends on the degree of coherence of the light source and the actual alignment of the experimental setup. For laser sources, it is typically close to a value of β = 1. For diluted suspension of colloidal particles underlying Brownian motion, g1(q,τ) = exp(−Γ(q)τ), and thus| | g2(q,τ) = 1 + β![[thin space (1/6-em)]](https://www.rsc.org/images/entities/char_2009.gif) exp(−2Γ(q)τ) exp(−2Γ(q)τ) | (15) |
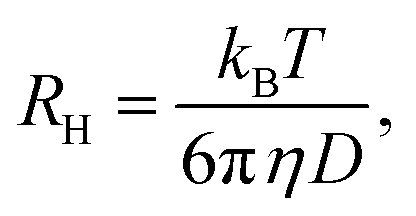
such that the relaxation rate Γ(q) is given bywith the translational diffusion constant D. In addition, the hydrodynamic radius, RH, of the colloidal particles can be estimated via the Stokes–Einstein relation| |  | (17) |
with the known viscosity η of the solvent. Thus, while performing temperature dependent DLS measurements of thermoresponsive microgel particles, it is possible to study the volume phase transition as a function of the osmolyte concentration in terms of RH.
From the recorded intensity autocorrelation functions, the relaxation rate Γ(q) at different scattering angles and temperatures was obtained using the cumulant analysis of the g2(τ) function.75 For the whole analysis, the concentration dependence of the index of refraction and the viscosity of TMAO76,77 and urea78,79 as well as the their temperature dependence80 were taken explicitly into account.
3 Materials and simulation details
3.1 Sample synthesis and preparation
PNIPAM was synthesized via a free radical emulsion polymerization process from the monomers N-isopropylacrylamide (Aldrich ≥97%) and N,N′-methylenbisacrylamid (Fluka) with a ratio of 98:2. The surfactant sodium dodecyl sulfate (Fluka, ≥96%) was added to dissolve the monomer in water. Prior of adding the initiator potassium peroxide disulfate (Merck Millipore), oxygen was removed by flowing nitrogen through the reaction mixture for an hour at a temperature of T = 60 °C. The initiator induces charged surface groups which are intended to later stabilize the PNIPAM copolymer in water. The co-polymerization has been performed for 5 hours at 60 °C. After the reaction, the synthesis product was dialyzed for two weeks against distilled water to remove residual ions. Diluted suspensions of PNIPAM microgels with TMAO (Sigma Aldrich, ≥99.0% purity) and urea (Sigma Aldrich, for molecular biology) for concentrations from 0.7–2.7 M and 1.0–4.0 M, respectively, were prepared by adding the corresponding quantities to the solution. DLS measurements were performed with a 3D LS spectrometer (LSinstruments, Fribourg, Switzerland) employing a helium–neon laser (λ = 632.8 nm). Intensity autocorrelation functions g2(τ) were recorded at several scattering angles in order to check the validity of eqn (16) for each sample and temperature and to increase the statistical accuracy. The measuring time at each angular position was 30 s. The PNIPAM suspensions with different TMAO and urea concentrations were filled in glass test tubes that were placed in a cis–trans decalin bath within the spectrometer for index-matching. The temperature of the surrounding cis–trans decalin bath was controlled with a precision of 0.1 K using a thermostat (Julabo Labortechnik GmbH, Seelback/ Germany).
3.2 Numerical details
We follow a protocol which was recently used for the study of PNIPAM and urea interactions in aqueous solution. For more details we refer the reader to ref. 15. A PNIPAM molecule with 24 monomers was studied by atomistic MD simulations with the GROMACS 4.6.2 software package.81–83 Although the number of monomers is small, it was shown in previous studies,15 that this model can be effectively used for the study of co-solute interactions. The AMBER force field parameters for PNIPAM presented in ref. 7 were used to guarantee the occurrence of the coil-to-globule transition at temperatures far below 328 K.6,7 We ensured that non-ideal solution effects can be omitted due to the simulation of low and intermediate TMAO concentrations. Furthermore, we used Generalized Amber Force Fields (GAFF)84,85 which were proven to produce reasonable results for a broad variety of small organic molecules86 and can be consistently combined with the TIP3P water87 and the PNIPAM force field. Typical swollen and collapsed PNIPAM configurations were obtained by using the original metadynamics approach88–90 as implemented within the PLUMED package.91 The details of the metadynamics simulations are presented in the ESI.† We extracted the most reasonable swollen (radius of gyration Rg = 1.4 nm) and collapsed state of PNIPAM (radius of gyration Rg = 0.8 nm) as found during the metadynamics simulation and inserted them into cubic simulation boxes to study the influence of TMAO concentrations of c = 1.26 mol L−1 and c = 2.53 mol L−1. In addition, we also performed simulations in pure water. The position of the backbone Cα carbon atoms were kept fixed by using position restraints. Restrained positions allow us to avoid sampling inaccuracies which were in more detail discussed in ref. 15. We randomly inserted the corresponding number of TMAO (130 and 260 molecules) and TIP3P water molecules87 to model the required TMAO concentrations. Electrostatic interactions for all systems were calculated by the Particle Mesh Ewald method92 and all bonds were constrained by the LINCS algorithm.93 First, we performed an energy minimization followed by a 2 ns warm-up run in a NPT ensemble at 288 K and 328 K with the Berendsen barostat and the Berendsen thermostat,94 followed by NPT simulations of 50 ns for the production run with the same approach. The average box length in the NPT simulations was l = 5.055 nm and the pressure was set to 1 bar.
4 Results and discussion
4.1 Experimental results
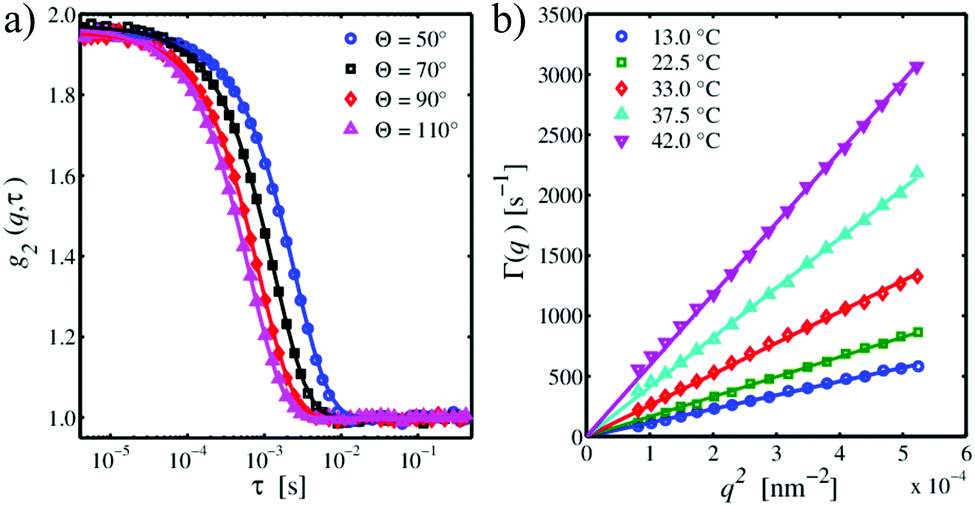
Fig. 1(a) depicts exemplary intensity autocorrelation functions for PNIPAM particles in pure aqueous suspension at T = 22.5 °C for four different scattering angles Θ. The g2(q,τ) functions exhibit the typical Θ-dependence, i.e. shifting to smaller relaxation times for increasing scattering angles. For τ → 0, the curves have an intercept close to g2(q,0) ≈ 2 indicating a coherent contrast of nearly β ≈ 1 in accordance to eqn (14). For larger lack times τ ≥ 0.1 s, all curves have the same baseline of g2(q,∞) ≈ 1. The DLS data can be refined using the cumulant expansion of eqn (15) shown by the solid lines to yield the relaxation rate Γ(q). The so obtained relaxation rates are plotted versus q2 in Fig. 1(b) for five representative temperatures. As it can be seen, the data linearly follows eqn (16) which verifies a Brownian diffusion of the microgel particles. There is a continuous increase of the slope of the curves with increasing temperature indicating a decrease of the particle size which was verified by a linear fit according to eqn (17) after inserting the values for the temperature.
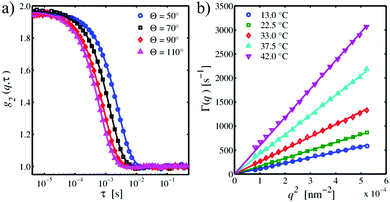 |
| | Fig. 1 (a) Typical DLS intensity autocorrelation functions g2(q,τ) of PNIPAM particles in pure aqueous suspension at T = 22.5 °C for four different scattering angles Θ. (b) Relaxation rate Γ(q) as a function of q2 for PNIPAM in pure water at different temperatures. Solid lines are linear refinements to the data. | |
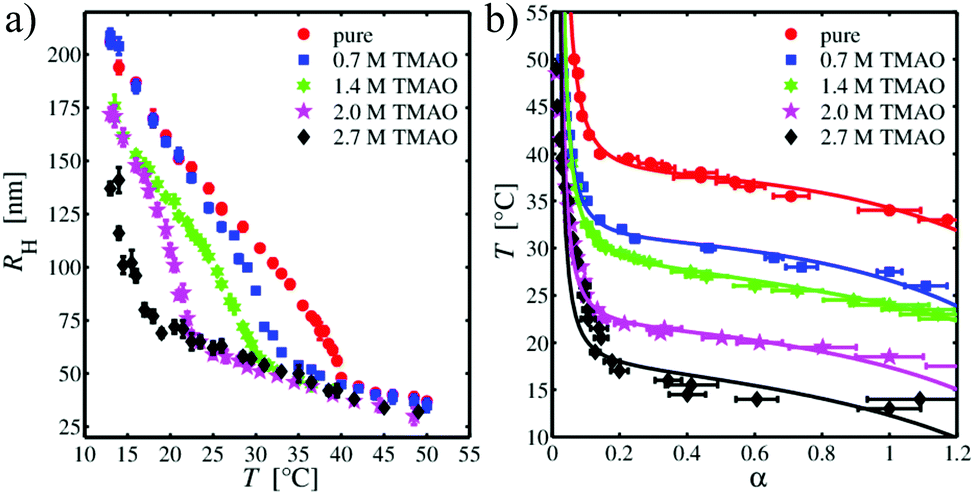
After studying the pure water behavior, we focused on the effects of osmolytes. Based on the DLS data, the temperature-dependent hydrodynamic radii for different TMAO and urea concentrations were obtained. Fig. 2(a) depicts the results for TMAO concentrations from 0 mol L−1 (PNIPAM in pure water) to 2.7 mol L−1. For PNIPAM microgel in pure aqueous solution, the temperature-dependent hydrodynamic radius decreases linearly with increasing temperature up to T = 35 °C. For higher temperatures, a continuous volume phase transition occurs which results in a rapid collapse of the microgel. The minimum of the first derivative of RH with respect to T yields the phase transition temperature with Tm = (38 ± 1) °C in pure water and in good agreement to previous results.15 For T > 40 °C, the volume phase transition is evident and the particle size only slightly shrinks with increasing temperature. In contrast, decreasing the temperature for particles which are in the globular, collapsed state, enforces the reentrance of a swelling to the original larger radii. Thus, the volume phase transition is fully reversible in pure water. Such a volume-phase transition with a linear temperature decrease is typical for microgel particles with added cross-linkers.95,96 Furthermore, the volume phase temperature Tm is higher for PNIPAM without cross-linkers (Tm = 32 °C)97 in good agreement to previous findings.98,99 In contrast, the presence of TMAO (cTMAO = 0.7 mol L−1) shifts the volume phase transition to significantly lower temperatures. This effect becomes even more pronounced for increasing TMAO concentrations. In addition, one can also recognize that the hydrodynamic radius of the PNIPAM microgel in the expanded, coil state shrinks with increasing amount of TMAO in the suspension. For a TMAO concentration of cTMAO = 2.7 mol L−1, the volume phase transition is shifted to such low temperatures that it can be only partially resolved within the studied temperature range. Notably, the hydrodynamic radii in the collapsed state are nearly identical and do not depend on the TMAO concentration. It has to be mentioned, that the volume phase transition was fully reversible for all TMAO concentrations.
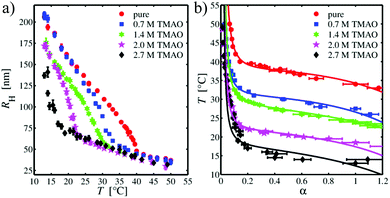 |
| | Fig. 2 (a) Hydrodynamic radius RH of the PNIPAM microgel as a function of temperature for different TMAO concentrations. (b) Temperature dependence of the swelling parameter α for different TMAO concentrations. Solid lines are refined to the data using the Flory–Rehner theory. | |
In order to quantify the effect of TMAO on the volume phase transition of the PNIPAM microgel, the Flory–Rehner theory is used to refine the DLS data. Therefore, the swelling parameter α is calculated from the hydrodynamic radii following eqn (4) for each suspension. The reference point was chosen to be the extended state close to the volume phase transition. The so-obtained temperature-swelling curves are presented in Fig. 2(b). The data were refined using eqn (3) with regard to the conditions discussed before. The resulting fits are shown as solid lines and a clear vertical shift of curves for different TMAO concentrations indicates different values for the volume phase transition temperature. The corresponding refinement parameters are presented in Table 1. Except for cTMAO = 2.7 mol L−1 for which the accuracy of the refinement is not high enough with regard to the limited range of observable hydrodynamic radii at low temperatures, all data can be fitted in reasonable agreement with the Flory–Rehner theory. In terms of the results shown in Table 1, one can observe a PNIPAM volume fraction ϕ0 between 0.40 to 0.50 for all TMAO concentrations. These values indicate that the PNIPAM microgel particles still contain a large amount of water above the volume phase transition temperature, i.e. PNIPAM molecules are still partially swollen even in the globular state.64,100 For the average number of monomers between two cross-links, Ngel, a value between 800–900 is obtained indicating that the microgel is weakly crosslinked. Both values for ϕ0 and Ngel reflect that the PNIPAM sample is very soft. The independence of these two quantities on the TMAO concentration was used as a boundary condition for the refinement by the Flory–Rehner theory. Here, it was assumed that ϕ0 and Ngel should only depend on the synthesis procedure and not on the direct presence of osmolytes. The values of χ2 for different osmolyte concentrations are less systematic and the changes are within the same range as the experimental error.
Table 1 Results of the refinement for the experimental DLS data with the Flory–Rehner theory. Here, cTMAO denotes the TMAO concentration, ϕ0 the volume fraction of the microgel in the collapsed state, Ngel the average number of monomers between two cross-links, χ2 the second coefficient in the expansion of χ, A and θm the central parameters of the Flory–Rehner theory
|
c [M] |
ϕ
0
|
N
gel
|
χ
2
|
A
|
θ
m [°C] |
| 0 |
0.45 ± 0.05 |
800 ± 115 |
0.36 ± 0.08 |
6.2 ± 0.5 |
38 ± 1 |
| 0.7 |
0.50 ± 0.05 |
900 ± 100 |
0.30 ± 0.10 |
8.0 ± 0.5 |
31 ± 3 |
| 1.4 |
0.40 ± 0.03 |
825 ± 100 |
0.10 ± 0.05 |
9.4 ± 0.5 |
29 ± 1 |
| 2.0 |
0.50 ± 0.10 |
800 ± 100 |
0.23 ± 0.10 |
10 ± 0.5 |
22 ± 1 |
| 2.7 |
0.50 ± 0.10 |
800 ± 100 |
0.11 ± 0.10 |
11 ± 1 |
18 ± 3 |
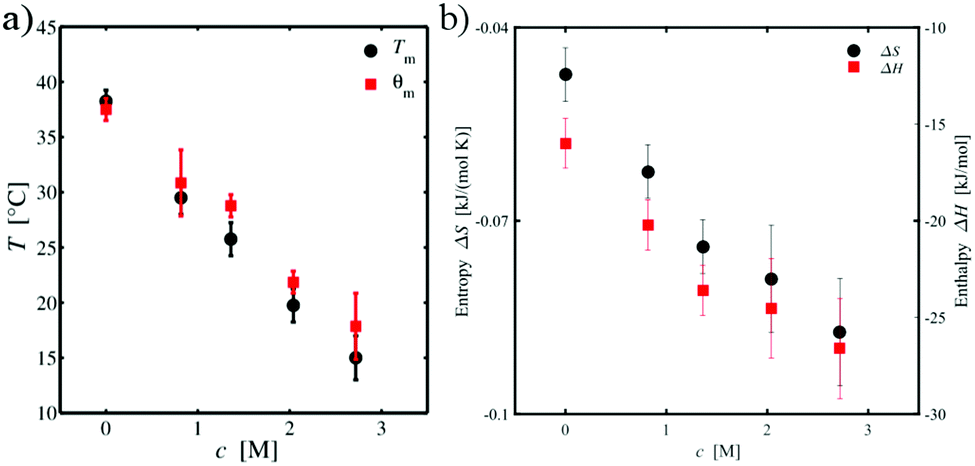
The effect of TMAO on the volume phase transition is mostly reflected by the values for A and θm. In fact, with increasing TMAO concentration, one can clearly see that the temperature θm decreases. In more detail, Fig. 3(a) shows the concentration dependence of θm on the TMAO concentration as well as the corresponding phase transition temperature Tm. The overall decreasing trend is identical for both temperatures. Slight discrepancies can be explained by the different methods the temperatures were obtained (refinement by Flory–Rehner theory or derivative of RH) and their exact definitions. Whereas θm is the θ-temperature at which the solvency parameter χ = ½, i.e. the solvent–solvent and the polymer–solvent interactions cancel each other, Tm can be obtained by the inflection point of the swelling curve. In contrast, the parameter A of the Flory–Rehner theory increases with the amount of osmolyte in the suspension (Table 1). Based on A and θm, the enthalpy change ΔH and the entropy change ΔS of the volume phase transition can be calculated by eqn (2). The corresponding values are shown in Table 2. It has to be noted that the signs of both values ΔH and ΔS have to be negative due to the onset of the volume phase transition. With regard to our definition of the swelling parameter α, positive values of A and thus also of ΔH and ΔS were obtained. In order to overcome this ambiguity, the signs of the later two quantities were reversed to fulfill the requirements for the presence of the PNIPAM microgel phase transition. Except of this difference in the definition, all further results are consistent with the general approach.
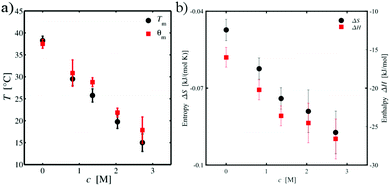 |
| | Fig. 3 (a) TMAO concentration dependence of the volume phase transition temperature Tm (black circles) and the parameter θm (red squares) of the Flory–Rehner theory. (b) TMAO concentration dependence of the enthalpy change ΔH (red squares) and the entropy change ΔS (black circles) for the volume phase transition. | |
Table 2 Change of the enthalpy, ΔH, and entropy, ΔS, in the collapsing process of PNIPAM for different TMAO concentrations
|
c
TMAO [mol L−1] |
ΔH [kJ mol−1] |
ΔS × 102 [kJ (mol K)−1] |
| 0 |
−16 ± 1 |
−4.7 ± 0.4 |
| 0.7 |
−20 ± 1 |
−6.2 ± 0.4 |
| 1.4 |
−24 ± 1 |
−7.4 ± 0.4 |
| 2.0 |
−25 ± 3 |
−7.9 ± 0.8 |
| 2.7 |
−27 ± 3 |
−8.7 ± 0.8 |
Fig. 3(b) depicts the concentration dependence of the enthalpy and entropy change with TMAO concentration. Increasing the concentration of TMAO leads to a continuous decrease of both ΔH and ΔS. The result for ΔH indicates an increased stabilization of the collapsed, globular state compared to the swollen conformation with increasing TMAO concentration. Similarly, the more negative values for the entropy change with increasing TMAO concentration indicate a more ordered globular state and its influence on the local aqueous environment. In the remainder of this article, we will show that the changes in the enthalpy and entropy upon transition between the coil and the globular state of PNIPAM can be mainly attributed to the properties of the local hydration shell and specific structural properties of PNIPAM. Thus, a larger number of hydrating water molecules and a stronger accumulation of TMAO molecules around the globular state favors the collapse of PNIPAM at higher TMAO concentrations. The enthalpy change can be therefore mainly explained by the corresponding larger number of hydrogen bonds in combination with more favorable electrostatic and dispersion interactions. Moreover, it was shown that TMAO increases the hydrogen bond strength between water molecules and proteins which might induce a further stabilization of PNIPAM47,101,102 in agreement with our simulation results. In addition, previous experimental findings103,104 revealed a restriction of internal protein motion in presence of TMAO. In combination with an increased order of the local hydration shell around PNIPAM in presence of TMAO,47,101,102 also the observed entropy change upon transition becomes reasonable. In fact, one can relate our observations to the well-known entropy–enthalpy compensation principle,105 which also becomes evident with regard to the comparable values for ΔH and TΔS as shown in Table 2. The above assumptions are verified by numerical results presented in the remainder of this article.
4.2 Comparison with urea
Additional measurements on PNIPAM suspensions with different urea concentrations were performed to study the influence of a denaturing osmolyte on the volume phase transition in comparison to TMAO. Fig. 4(a) shows the temperature dependent hydrodynamic radii for several urea concentrations. For a 0.8 molar urea concentration, there is only a slight shift of the volume phase transition to smaller temperatures as well as a slight decrease of the particle size. For a temperature of Taggr = (39 ± 1) °C, aggregation of the microgel particles sets in, leading to a strong scattering signal and deviations from eqn (16). In contrast, for increasing urea concentrations, the particle size becomes slightly smaller but remains swollen. Moreover, for a 2 molar urea concentration, the volume phase transition cannot be resolved but is obscured by the beginning of aggregation. This effect becomes stronger as the urea concentration is enhanced. For a 4 molar urea concentration, white aggregates at high temperatures can be seen with the bare eye. Noteworthy, cooling of the sample results in a disappearance of the aggregates which indicates that the aggregation mechanism is fully reversible. Fig. 4(b) shows the concentration dependence of the phase transition temperature and the aggregation temperature. It has to be noted that it cannot be finally concluded if the aggregation temperature coincides with the phase transition temperature. Furthermore, it is even not clear if there is a well-defined difference between both temperatures.
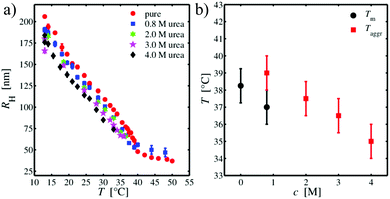 |
| | Fig. 4 (a) Hydrodynamic radius RH of the PNIPAM microgel as a function of temperature for different urea concentrations. (b) Urea concentration dependence of the volume phase transition temperature Tm and the temperature Taggr at which aggregation was observed. | |
The effect of urea on PNIPAM microgels as well as on brushes was studied previously by both experimental and computer simulation approaches.10,15,43,44 Based on these studies, in case of high concentrations, urea molecules facilitate the hydrophobic collapse of the polymer due to direct interactions. Whether enthalpic or entropic contributions dominate this process is still under debate. It has to be noted that direct binding mechanisms between PNIPAM and urea can give rise to a pronounced collapse by connecting intra-PNIPAM cross-links or different microgel particles. The latter one would result in the aggregation of the particles as it was described above.
Based on the presented DLS results and a recent simulation study,15 the effect of urea on the volume phase transition is significantly smaller compared to TMAO. Furthermore, also the observed hydrodynamic radii at different temperatures significantly differ between the osmolytes. Based on these findings, one can assume a fundamentally different interaction mechanism between PNIPAM and TMAO or urea, respectively. It can be speculated that also the role of the hydration water differs. Although the DLS data can be well understood by the phenomenological Flory–Rehner theory, a microscopic mechanism for the findings is still missing. Previous explanations12 indeed mostly rely on the analysis of experimental data. With regard to this point, we performed computer simulations of a single PNIPAM chain in aqueous TMAO solution. A comparable single chain approach was also used in ref. 15 in good agreement with experimental results.
4.3 Numerical results
In order to understand the experimental results on a more microscopic level, we followed our previously introduced approach discussed in ref. 15, where two restrained configurations, a coil and a globular PNIPAM conformation were studied. We start the presentation of the numerical results by the study of the TMAO binding behavior to PNIPAM. The preferential binding coefficients ν23 according to eqn (8) for the globular and the coil conformation of PNIPAM at different temperatures T = 288 K and T = 328 K for TMAO concentrations of c = 1.26 mol L−1 and c = 2.53 mol L−1 are presented in Fig. 5. The cumulative number of molecules 〈n2x(r)〉 between all nitrogen atoms of PNIPAM and the nitrogen atom of TMAO and the oxygen atom of water, respectively were calculated as a time average over the whole length of the production run. The results at 288 K and 328 K indicate a preferential attraction of TMAO to both PNIPAM conformations due to positive values for the preferential binding coefficient ν23 at large distances r. The binding is significantly stronger to the globular conformations for both studied temperatures. In addition, a small preferential exclusion range can be observed at r ≈ 0.2–0.4 nm due to negative values for the preferential binding coefficient. This effect is even more pronounced for higher TMAO concentrations. In the following, we are able to relate the occurrence of this effect to the presence of a thin water layer in direct contact with the PNIPAM chain.
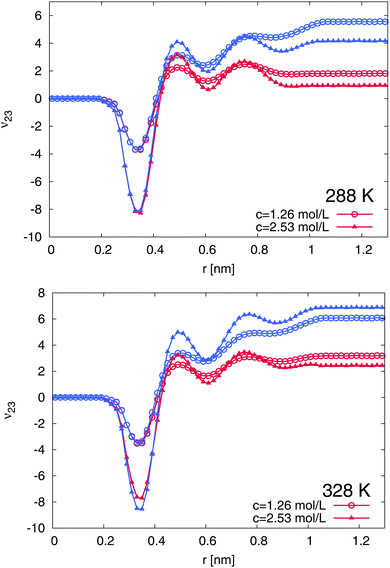 |
| | Fig. 5 Preferential binding coefficients ν23 according to eqn (8) for TMAO concentrations of c = 1.26 mol L−1 (circles) and c = 2.56 mol L−1 (triangles) to the globular (blue lines) and coil conformations (red lines) of PNIPAM at 288 K (top) and 328 K (bottom). | |
With regard to the well-converged results for ν23, one can calculate the transfer free energies which read ΔF23 = −RTν23 with the molar gas constant R15. The results for the different TMAO concentrations, temperatures and PNIPAM conformations are presented in the ESI.† In general, we found a stronger attraction of TMAO to PNIPAM at higher temperatures. The strong attraction to the globular conformation is reflected by the differences of the transfer free energies according to ΔΔF23 = ΔFc23 − ΔFg23 where the subscripts denote the transfer free energy to the coil (c) and the globular PNIPAM state (g). The results shown in the ESI† indicate a stabilization of the globular state due to positive values ΔΔF23 > 0 for all different TMAO concentrations and temperatures. These findings are in good agreement with the previously shown experimental results and with the data presented in ref. 12 where a decreasing volume phase transition temperature and a decreasing hydrodynamic radius of PNIPAM for higher TMAO concentrations was found. Therefore, based on our numerical findings, it can be stated that TMAO stabilizes the globular conformation in terms of a preferential attraction mechanism.
A preferential attraction is also validated by the local/bulk partition coefficient according to eqn (11). The results for different conformations, temperatures and TMAO concentrations are presented in the ESI† and verify the pronounced accumulation of TMAO around both PNIPAM conformations. In agreement with the previously discussed results and in terms of the TMAO properties, we found a larger local/bulk partition coefficient Kp(r) for the globular conformations.
Interestingly, one could assume that the preferential attraction of TMAO is also represented by a direct binding of TMAO to PNIPAM as it was found for urea.15 In contrast to urea, we are not able to observe relevant direct contacts between TMAO and PNIPAM in terms of specific intermolecular hydrogen bonds. The time averaged number of TMAO–PNIPAM hydrogen bonds was 〈NTMAOHB〉 < 1 for all considered concentrations and temperatures. Thus, a small fraction of below 1% of the TMAO molecules is directly interacting with PNIPAM such that a direct binding mechanism can be excluded. With regard to the cumulative number of molecules around PNIPAM, we found a substantial amount of water molecules around PNIPAM at a distance of r = 0.25 nm. Detailed results can be found in the ESI.† In contrast to water, the first TMAO accumulation shell occurs at larger distances around r ≈ 0.4 nm. Based on our findings, it becomes clear that a thin sheet of water molecules protects PNIPAM from direct TMAO interactions as it was also mentioned before and in a previous publication.45 Therefore, although a strong accumulation of TMAO around PNIPAM can be found, a preferential binding with direct interactions is absent. It can be assumed that the described effect can be directly related to the specific properties of PNIPAM–TMAO interactions and the influence of the osmolyte on the solvent shells. More results on the properties of the hydrogen-bonded water molecules, representing the thin water layer in terms of the first hydration shell around PNIPAM, are shown in the ESI.† In agreement with previous experimental results in bulk solution and around proteins,47,50,101,102,106 we found a strengthening of hydrogen bonds between water and PNIPAM at higher temperatures in presence of TMAO. Therefore, our findings of a stronger and energetically more stable hydrogen bond network with longer relaxation times in the first hydration shell around PNIPAM in presence of TMAO are in good agreement with previous experimental results.47,101,102 One can ask about the mechanism which attracts TMAO molecules to PNIPAM. A recent publication validated the importance of solute–osmolyte interactions for the distinction between preferential binding and preferential exclusion mechanisms and argues that also kosmotropic osmolytes like hydroxyectoine might favorably accumulate around specific solutes.39 In order to study the energetic contributions and the binding mechanism in more detail, we distinguished between the coil and the globular states of PNIPAM and calculated the differences in the electrostatic and the Lennard-Jones binding energies Eb between TMAO and PNIPAM according to ΔECG = Ebc − Ebg where the subscripts denote the coil (c) and the globular PNIPAM state (g). Exemplary results at T = 288 K are shown in Fig. 6. It becomes clear that the strongest difference between the binding energies to the globular and the coil state is induced by a change in the Lennard-Jones interactions. The influence of the electrostatic energy differences is less pronounced. Also for the total binding energy, the contribution of the electrostatic interactions is less important. We found roughly constant percentages of the electrostatic binding energies to the total binding energies around 12% to 18% for all systems. Noteworthy, all PNIPAM conformations reveal the presence of attractive Lennard-Jones and electrostatic interactions due to negative values for the corresponding interaction energies ECG. Based on these findings, it can be concluded that the main binding energy between TMAO and PNIPAM arises from attractive Lennard-Jones interactions in good agreement with previous results found for ionic liquids.40 This finding further confirms and explains the absence of hydrogen bonds between PNIPAM and TMAO which fundamentally rely on electrostatic interactions in MD simulations.
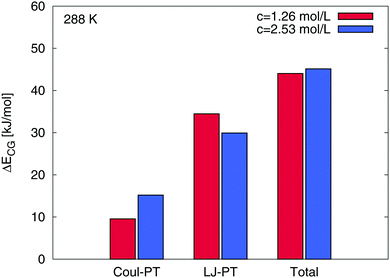 |
| | Fig. 6 Differences ΔECG in the individual electrostatic (Coul-PT) and in the Lennard-Jones (LJ-PT) energies between TMAO and the coil and the globular state of PNIPAM for different TMAO concentrations at 288 K. The differences in the total binding energy are also shown at the right. | |
For a further interpretation of the stabilization of the globular PNIPAM state, we focus on the amount of the hydrating water molecules around PNIPAM. It was discussed in a seminal paper2 that the PNIPAM coil-to-globule transition can be explained by a change of the hydration properties. With regard to the large hydrophilic solvent accessible surface area of PNIPAM, a possible further explanation for an additional stabilization mechanism of the globular state is therefore given by preferential hydration.57 In order to detect a preferential hydration mechanism, we calculated the time averaged number of hydrogen bonds between PNIPAM and water molecules. Hydrogen bonds were defined by a maximum distance criterion of 0.35 nm between acceptor and donor pairs and with a maximum angle of 35°. The results can be found in Fig. 7.
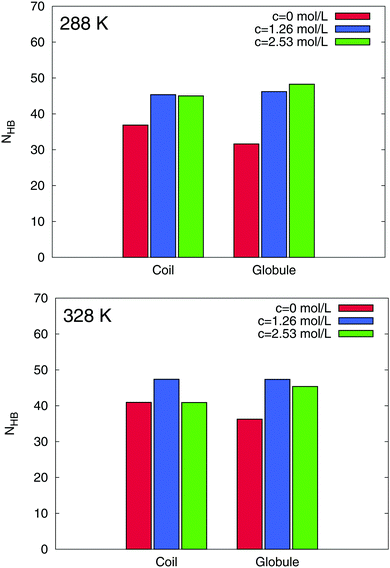 |
| | Fig. 7 Time averaged number of hydrogen bonds NHB between water molecules and PNIPAM at 288 K (top) and 328 K (bottom). The results for the different concentrations are shown as differently colored bars. The corresponding PNIPAM conformations are marked in the legend. | |
Interestingly, we found a strong increase of the average number of hydrogen bonds for increasing TMAO concentrations when compared to a pure water solution. On average for all conformations, we found more than ΔNHB ≈ 10 additional water–PNIPAM hydrogen bonds in presence of TMAO when compared to pure water. These results clearly indicate the presence of a preferential hydration mechanism for PNIPAM in presence of TMAO. When compared to the coil state, globular conformations of PNIPAM are more strongly hydrated which might also explain the stabilization of the globular state56,57 in addition to preferential attraction. Our microscopic explanation of the stabilization mechanism significantly differs from previous theories based on experimental results.12 Herewith, it was proposed that TMAO decreases the amount of hydrogen bonded water molecules with PNIPAM. Thus, our simulations allow us a more detailed picture of the underlying process. Noteworthy, we can assign the pronounced hydration behavior of PNIPAM with the hygroscopic properties of kosmotropic osmolytes like TMAO which are located in close vicinity around PNIPAM.24,45 Therefore, it can be assumed that in addition to favorable Lennard-Jones interactions between PNIPAM and solvated TMAO molecules as represented by positive preferential binding parameters, a favorable hydration of the globular state in presence of TMAO induces a shift of the lower critical solution temperature and the decrease of the hydrodynamic radius found in the experiments. These findings are also confirmed by our results for the preferential hydration parameter107,108 (data not shown), which reveal a substantial lower amount of water around the coil state when compared to the globular conformation.
5 Summary and conclusion
The effect of the biological stabilizing osmolyte TMAO on PNIPAM microgel particles was studied by dynamic light scattering and computer simulations. The experimental DLS study revealed a volume phase transition of the PNIPAM microgel. The presence of TMAO induces a reversible, continuous shift of the phase transition temperature with increasing TMAO concentration towards lower temperatures. In summary, our results are in good agreement with previous experimental findings.12 Refining the data with the phenomenological Flory–Rehner theory verified a TMAO-induced stabilization of the globular state for PNIPAM particles. Atomistic MD simulations allow us to develop a more detailed picture of the molecular mechanism. Our results indicate that the resulting preferential accumulation of TMAO is more pronounced around the globular state of PNIPAM which can be brought into agreement with a shift of the chemical equilibrium constant.15 The absence of a direct TMAO binding behavior was indicated by a negligible number of PNIPAM–TMAO hydrogen bonds. These results are in full agreement with a previous publication revealing a strong accumulation of TMAO around polystyrene.14 Furthermore, we found that water molecules form a thin sheet around PNIPAM and protect the solute from direct interactions with TMAO. The analysis of the dynamic and structural properties of the hydration layer indicated a strengthening of hydrogen bonds between water molecules and PNIPAM in presence of TMAO. We also analyzed the energetic components of the binding mechanism between PNIPAM and TMAO and observed favorable van der Waals interactions as represented by Lennard-Jones energies with the globular state. In contrast, electrostatic interactions play a minor role. These findings can be brought into agreement with recent simulation results on the stabilization of folded peptide states in presence of aqueous ionic liquids.40
In addition to the preferential accumulation behavior, we also found a strong preferential hydration of PNIPAM in presence of TMAO which additionally stabilizes the globular PNIPAM state. In fact, it was proposed that preferential hydration mainly occurs in presence of a preferential exclusion mechanism.56,57 Based on our results, we indeed found that preferential hydration can be observed in presence of TMAO when being attracted to specific macromolecular hydrophilic surfaces. Thus, we can observe a preferential hydration of the solute in presence of excluded co-solutes as proposed in ref. 56 and 57 in combination with a preferential attraction behavior of TMAO. The mechanism can be described as follows. Protectants like TMAO or hydroxyectoine are strongly hydrated and carry the hydration water in front of the solute surface when being attracted to PNIPAM, which can be regarded as the fundamental mechanism for the onset of preferential hydration. In contrast, urea directly interacts with PNIPAM and replaces hydrating water molecules as it was found in recent experimental and simulation results.15 In addition, we observed nearly no direct interactions between TMAO and PNIPAM which corresponds to the fact that TMAO prefers to remain fully hydrated.33,45 It might be therefore more reasonable to interpret the accumulation of TMAO around PNIPAM as a preferential attraction behavior in contrast to the preferential binding mechanism as it is known for urea. The difference in the mechanisms is also reflected by the experimental results for the volume phase transition temperature. Furthermore, our numerical results are also in good agreement with the enthalpic and entropic energy contributions as they were found in the experiments. The larger number of hydrating water molecules favorably interact via conservative interactions with PNIPAM, which decreases the enthalpic contributions to the energy. Closely related, more hydrating water molecules result in a stronger ordering of the solvent which is reflected by the decrease of the entropy in agreement with previous results found for DNA109 and proteins.47,101,102 In combination, also the properties of restricted motion in the configurational PNIPAM states in presence of TMAO103,104 might play a significant role. Finally, enthalpy and entropy contributions to the free energy largely balance each other by the well known entropy–enthalpy compensation principle105 as also indicated by our numerical values for ΔH and ΔS.
Moreover, our proposed mechanism for TMAO also explains some differences to the binding mechanism between urea and PNIPAM. It was discussed in ref. 15, that different concentrations of urea result in different binding behaviors. For high urea concentrations, a preferential binding of urea to PNIPAM was validated which results in a full coverage of the PNIPAM surface area as represented by an increasing number of hydrogen bonds between urea and PNIPAM. Noteworthy, in contrast to TMAO, urea replaces hydrating water molecules as it was discussed in ref. 15 whereas TMAO favors a preferential hydration. The fundamental difference between these two mechanisms is demonstrated by the strong PNIPAM aggregation effect in the experiments induced by urea. In contrast, TMAO is not able to act as a cross-linker due to its surrounding strong hydration shell.
Hence, our numerical findings allow us to interpret the experimental results and further point at a molecular stabilizing mechanism, which slightly broadens the plethora of possible explanations for the stabilization of macromolecular configurations in presence of osmolytes.
Acknowledgements
We thank Frank Uhlig, Johannes Zeman, Nico van der Vegt, Francisco Rodriguez-Ropero, Samantha Micciulla and Jan Heyda for valuable discussions. This work was funded by the two excellence clusters “The Hamburg Centre for Ultrafast Imaging – Structure, Dynamics, and Control of Matter at the Atomic Scale” and “Simulation Technology” (EXC 310) and the SFB 716 of the DFG. Financial support is gratefully acknowledged.
References
- Y. Guan and Y. Zhang, Soft Matter, 2011, 7, 6375–6384 RSC.
- S. Fujishige, K. Kubota and I. Ando, J. Phys. Chem., 1989, 93, 3311–3313 CrossRef CAS.
- G. Graziano, Int. J. Biol. Macromol., 2000, 27, 89–97 CrossRef CAS PubMed.
- Y. Zhang and P. S. Cremer, Annu. Rev. Phys. Chem., 2010, 61, 63–83 CrossRef CAS PubMed.
- S. A. Deshmukh, S. K. Sankaranarayanan, K. Suthar and D. C. Mancini, J. Phys. Chem. B, 2012, 116, 2651–2663 CrossRef CAS PubMed.
- H. Du, S. R. Wickramasinghe and X. Qian, J. Phys. Chem. B, 2013, 117, 5090–5101 CrossRef CAS PubMed.
- H. Du, R. Wickramasinghe and X. Qian, J. Phys. Chem. B, 2010, 114, 16594–16604 CrossRef CAS PubMed.
- E. I. Tiktopulo, V. N. Uversky, V. B. Lushchik, S. I. Klenin, V. E. Bychkova and O. B. Ptitsyn, Macromolecules, 1995, 28, 7519–7524 CrossRef CAS.
- Y. Fang, J.-C. Qiang, D.-D. Hu, M.-Z. Wang and Y.-L. Cui, Colloid Polym. Sci., 2001, 279, 14–21 CAS.
- L. B. Sagle, Y. Zhang, V. A. Litosh, X. Chen, Y. Cho and P. S. Cremer, J. Am. Chem. Soc., 2009, 131, 9304–9310 CrossRef CAS PubMed.
- K. Fuchise, R. Kakuchi, S.-T. Lin, R. Sakai, S.-I. Sato, T. Satoh, W.-C. Chen and T. Kakuchi, J. Polym. Sci., Part A: Polym. Chem., 2009, 47, 6259–6268 CrossRef CAS.
- P. M. Reddy, M. Taha, P. Venkatesu, A. Kumar and M.-J. Lee, J. Chem. Phys., 2012, 136, 234904 CrossRef PubMed.
- L. Liu, Y. Shi, C. Liu, T. Wang, G. Liu and G. Zhang, Soft Matter, 2014, 10, 2856–2862 RSC.
- J. Mondal, D. Halverson, I. T. Li, G. Stirnemann, G. C. Walker and B. J. Berne, Proc. Natl. Acad. Sci. U. S. A., 2015, 112, 9270–9275 CrossRef CAS PubMed.
- S. Micciulla, J. Michalowsky, M. A. Schroer, C. Holm, R. von Klitzing and J. Smiatek, Phys. Chem. Chem. Phys., 2016, 18, 5324–5335 RSC.
- P. H. Yancey, J. Exp. Biol., 2005, 208, 2819–2830 CrossRef CAS PubMed.
- P. H. Yancey, M. E. Clark, S. C. Hand, R. D. Bowlus and G. N. Somero, Science, 1982, 217, 1214–1222 CAS.
- I. Baskakov, A. Wang and D. Bolen, Biophys. J., 1998, 74, 2666–2673 CrossRef CAS PubMed.
- F. Meersman, D. Bowron, A. K. Soper and M. H. Koch, Biophys. J., 2009, 97, 2559–2566 CrossRef CAS PubMed.
- F. Meersman, D. Bowron, A. K. Soper and M. H. Koch, Phys. Chem. Chem. Phys., 2011, 13, 13765–13771 RSC.
- P. Ganguly, T. Hajari, J.-E. Shea and N. F. van der Vegt, J. Phys. Chem. Lett., 2015, 6, 581–585 CrossRef CAS PubMed.
- M. A. Schroer, M. Paulus, C. Jeworrek, C. Krywka, S. Schmacke, Y. Zhai, D. C. F. Wieland, C. J. Sahle, M. Chimenti, C. A. Royer, B. Garcia-Moreno, M. Tolan and R. Winter, Biophys. J., 2010, 99, 3430–3437 CrossRef CAS PubMed.
- M. A. Schroer, Y. Zhai, D. C. F. Wieland, C. J. Sahle, J. Nase, M. Paulus, M. Tolan and R. Winter, Angew. Chem., Int. Ed., 2011, 50, 11413–11416 CrossRef CAS PubMed.
- J. Smiatek, R. K. Harishchandra, O. Rubner, H.-J. Galla and A. Heuer, Biophys. Chem., 2012, 160, 62–68 CrossRef CAS PubMed.
- J. Smiatek, R. K. Harishchandra, H.-J. Galla and A. Heuer, Biophys. Chem., 2013, 180, 102–109 CrossRef PubMed.
- S. Pieraccinia, S. Conti, S. Chaurasia and M. Sironi, Chem. Phys. Lett., 2013, 578, 138–143 CrossRef.
- B. J. Bennion and V. Daggett, Proc. Natl. Acad. Sci. U. S. A., 2003, 100, 5142–5147 CrossRef CAS PubMed.
- R. Zangi, R. Zhou and B. Berne, J. Am. Chem. Soc., 2009, 131, 1535–1541 CrossRef CAS PubMed.
- D. A. Beck, B. J. Bennion, D. O. Alonso and V. Daggett, Methods Enzymol., 2007, 428, 373–396 CAS.
- A. M. Bhattacharyya and P. Horowitz, J. Biol. Chem., 2000, 275, 14860–14864 CrossRef CAS PubMed.
- A. K. Bhuyan, Biochemistry, 2002, 41, 13386–13394 CrossRef CAS PubMed.
- D. R. Canchi and A. E. Garcia, Annu. Rev. Phys. Chem., 2013, 64, 273–293 CrossRef CAS PubMed.
- K. D. Collins, Methods, 2004, 34, 300–311 CrossRef CAS PubMed.
- J. Heyda and J. Dzubiella, J. Phys. Chem. B, 2014, 118, 10979–10988 CrossRef CAS PubMed.
- T. Solomun, H. Sturm, R. Wellhausen and H. Seitz, Chem. Phys. Lett., 2012, 533, 92–94 CrossRef CAS.
- M. B. Hahn, T. Solomun, R. Wellhausen, S. Hermann, H. Seitz, S. Meyer, H.-J. Kunte, J. Zeman, F. Uhlig, J. Smiatek and H. Sturm, J. Phys. Chem. B, 2015, 119, 15212–15220 CrossRef CAS PubMed.
- D. Harries and J. Rösgen, Methods Cell Biol., 2008, 84, 679–735 CAS.
- R. Politi and D. Harries, Chem. Commun., 2010, 46, 6449–6451 RSC.
- J. Smiatek, J. Phys. Chem. B, 2014, 118, 771–782 CrossRef CAS PubMed.
- V. Lesch, A. Heuer, V. A. Tatsis, C. Holm and J. Smiatek, Phys. Chem. Chem. Phys., 2015, 17, 26049–26053 RSC.
- E. A. Algaer and N. F. van der Vegt, J. Phys. Chem. B, 2011, 115, 13781–13787 CrossRef CAS PubMed.
- J. Mondal, G. Stirnemann and B. Berne, J. Phys. Chem. B, 2013, 117, 8723–8732 CrossRef CAS PubMed.
- F. Rodríguez-Ropero and N. F. van der Vegt, J. Phys. Chem. B, 2014, 118, 7327–7334 CrossRef PubMed.
- F. Rodriguez-Ropero and N. F. A. van der Vegt, Phys. Chem. Chem. Phys., 2015, 17, 8491–8498 RSC.
- E. Schneck, D. Horinek and R. R. Netz, J. Phys. Chem. B, 2013, 117, 8310–8321 CrossRef CAS PubMed.
- Y. L. A. Rezus and H. J. Bakker, Phys. Rev. Lett., 2007, 99, 148301 CrossRef CAS PubMed.
- A. Panuszko, P. Bruzdziak, J. Zielkiewicz, D. Wyrzykowski and J. Stangret, J. Phys. Chem. B, 2009, 113, 14797–14809 CrossRef CAS PubMed.
- L. Larini and J.-E. Shea, J. Phys. Chem. B, 2013, 117, 13268–13277 CrossRef CAS PubMed.
- L. Knake, G. Schwaab, K. Kartaschew and M. Havenith, J. Phys. Chem. B, 2015, 119, 13842–13851 CrossRef CAS PubMed.
- C. J. Sahle, M. A. Schroer, I. Juurinen and J. Niskanen, Phys. Chem. Chem. Phys., 2016, 18, 16518–16526 RSC.
- H. G. Schild, M. Muthukumar and D. A. Tirrell, Macromolecules, 1991, 24, 948–952 CrossRef CAS.
- D. Mukherji and K. Kremer, Macromolecules, 2013, 46, 9158–9163 CrossRef CAS.
- F. Rodríguez-Ropero, T. Hajari and N. F. van der Vegt, J. Phys. Chem. B, 2015, 119, 15780–15788 CrossRef PubMed.
- L. Sapir and D. Harries, Curr. Opin. Colloid Interface Sci., 2016, 22, 80–87 CrossRef CAS.
- Y. A. Budkov, A. Kolesnikov, N. Kalikin and M. Kiselev, Eur. Phys. Lett., 2016, 114, 46004 CrossRef.
- T. Arakawa and S. Timasheff, Biophys. J., 1985, 47, 411 CrossRef CAS PubMed.
- S. N. Timasheff, Proc. Natl. Acad. Sci. U. S. A., 2002, 99, 9721–9726 CrossRef CAS PubMed.
- S. E. McLain, A. K. Soper, A. E. Terry and A. Watts, J. Phys. Chem. B, 2007, 111, 4568–4580 CrossRef CAS PubMed.
- R. Troitzsch, G. Martyna, S. McLain, A. Soper and J. Crain, J. Phys. Chem. B, 2007, 111, 8210–8222 CrossRef CAS PubMed.
- P. J. Flory and J. Rehner, J. Chem. Phys., 1943, 11, 512–520 CrossRef CAS.
- P. J. Flory and J. Rehner, J. Chem. Phys., 1943, 11, 521–526 CrossRef CAS.
- S. Hirotsu, Phase Transitions, 1994, 47, 183–240 CrossRef CAS.
- S. Hirotsu, Y. Hirowawa and T. Tanaka, J. Chem. Phys., 1987, 87, 1392–1395 CrossRef CAS.
- A. Fernandez-Barbero, A. Fernandez-Nieves, I. Grillo and E. Lopez-Cabarcos, Phys. Rev. E: Stat., Nonlinear, Soft Matter Phys., 2002, 66, 051803 CrossRef CAS PubMed.
- S. M. Hashmi and E. R. Dufresne, Soft Matter, 2009, 5, 3682–3688 RSC.
- Y. Hertle, M. Zeiser, C. Hasenoehrl, P. Busch and T. Hellweg, Colloid Polym. Sci., 2010, 288, 1047–1059 CAS.
- J. G. Kirkwood and F. P. Buff, J. Chem. Phys., 1951, 19, 774–777 CrossRef CAS.
-
A. Y. Ben-Naim, Statistical thermodynamics for chemists and biochemists, Springer, 1992 Search PubMed.
- B. M. Baynes and B. L. Trout, J. Phys. Chem. B, 2003, 107, 14058–14067 CrossRef CAS.
- V. Pierce, M. Kang, M. Aburi, S. Weerasinghe and P. E. Smith, Cell Biochem. Biophys., 2008, 50, 1–22 CrossRef CAS PubMed.
- D. Horinek and R. R. Netz, J. Phys. Chem. A, 2011, 115, 6125–6136 CrossRef CAS PubMed.
- P. E. Smith, Biophys. J., 2006, 91, 849–856 CrossRef CAS PubMed.
- P. E. Smith, J. Phys. Chem. B, 1999, 103, 525–534 CrossRef CAS.
- E. Courtenay, M. Capp, C. Anderson and M. Record, Biochemistry, 2000, 39, 4455–4471 CrossRef CAS PubMed.
-
B. J. Berne and R. Pecora, Dynamic Light Scattering: With Applications to Chemistry, Biology, and Physics, Dover Publications, 2000 Search PubMed.
-
A. Mohammad, Characterisation of the effects of cosolutes on the stability of H-bonds in proteins
by NMR spectroscopy, PhD thesis, University College London, 2010 Search PubMed.
- A. J. Wang and D. W. Bolen, Biochemistry, 1997, 36, 9101–9108 CrossRef CAS PubMed.
- J. R. Warren and J. A. Gordon, J. Biol. Chem., 1970, 245, 4097–4104 CAS.
- K. Kawahara and C. Tanford, J. Biol. Chem., 1966, 241, 3228–3232 CAS.
- A. N. Bashkatov and E. A. Genina, Proc. SPIE, 2003, 5068, 393–395 CrossRef.
- D. van der Spoel, E. Lindahl, B. Hess, G. Groenhof, A. E. Mark and H. J. C. Berendsen, J. Comput. Chem., 2005, 26, 1701–1718 CrossRef CAS PubMed.
- H. J. C. Berendsen, D. van der Spoel and R. van Drunen, Comput. Phys. Commun., 1995, 91, 43–56 CrossRef CAS.
- S. Pronk, S. Páll, R. Schulz, P. Larsson, P. Bjelkmar, R. Apostolov, M. R. Shirts, J. C. Smith, P. M. Kasson, D. van der Spoel, B. Hess and E. Lindahl, Bioinformatics, 2013, 29, 845–854 CrossRef CAS PubMed.
- J. Wang, R. M. Wolf, J. W. Caldwell, P. A. Kollman and D. A. Case, J. Comput. Chem., 2004, 25, 1157–1174 CrossRef CAS PubMed.
- J. Wang, W. Wang, P. A. Kollman and D. A. Case, J. Mol. Graphics Modell., 2006, 25, 247–260 CrossRef CAS PubMed.
- C. Caleman, P. J. van Maaren, M. Hong, J. S. Hub, L. T. Costa and D. van der Spoel, J. Chem. Theory Comput., 2011, 8, 61–74 CrossRef PubMed.
- W. L. Jorgensen, J. Chandrasekhar, J. D. Madura, R. W. Impey and M. L. Klein, J. Chem. Phys., 1983, 79, 926–935 CrossRef CAS.
- A. Laio and M. Parrinello, Proc. Natl. Acad. Sci. U. S. A., 2002, 99, 12562–12566 CrossRef CAS PubMed.
- A. Laio and F. L. Gervasio, Rep. Prog. Phys., 2008, 71, 126601 CrossRef.
- J. Smiatek and A. Heuer, J. Comput. Chem., 2011, 32, 2084–2096 CrossRef CAS PubMed.
- M. Bonomi, D. Branduardi, G. Bussi, C. Camilloni, D. Provasi, P. Raiteri, D. Donadio, F. Marinelli, F. Pietrucci and R. A. Broglia, Comput. Phys. Commun., 2009, 180, 1961–1972 CrossRef CAS.
- T. Darden, D. York and L. Pedersen, J. Chem. Phys., 1993, 98, 10089–10092 CrossRef CAS.
- B. Hess, H. Bekker, H. J. C. Berendsen and J. G. E. M. Fraaije, J. Comput. Chem., 1997, 18, 1463–1472 CrossRef CAS.
- H. J. Berendsen, J. P. M. Postma, W. F. van Gunsteren, A. DiNola and J. Haak, J. Chem. Phys., 1984, 81, 3684–3690 CrossRef CAS.
- H. Senff and W. Richtering, J. Chem. Phys., 1999, 111, 1705–1711 CrossRef CAS.
- H. Senff and W. Richtering, Colloid Polym. Sci., 2000, 278, 830–840 CAS.
- M. Das, H. Zhang and E. Kumacheva, Annu. Rev. Mater. Res., 2006, 36, 117–142 CrossRef CAS.
- B. Sierra-Martin, Y. Choi, M. S. Romero-Cano, T. Cosgrove, B. Vincent and A. Fernandez-Barbero, Macromolecules, 2005, 38, 10782–10787 CrossRef CAS.
- A. Burmistrova, M. Richter, C. Uzum and R. von Klitzing, Colloid Polym. Sci., 2011, 289, 613–624 CAS.
- R. Pelton, Adv. Colloid Interface Sci., 2000, 85, 1–33 CrossRef CAS PubMed.
- P. Bruzdziak, A. Panuszko and J. Stangret, J. Phys. Chem. B, 2013, 117, 11502–11508 CrossRef CAS PubMed.
- A. Panuszko, P. Bruździak, E. Kaczkowska and J. Stangret, J. Phys. Chem. B, 2016, 120, 11159–11169 CrossRef CAS PubMed.
- J. Ma, I. M. Pazos and F. Gai, Proc. Natl. Acad. Sci. U. S. A., 2014, 111, 8476–8481 CrossRef CAS PubMed.
- V. Doan-Nguyen and J. P. Loria, Protein Sci., 2007, 16, 20–29 CrossRef CAS PubMed.
-
A. V. Finkelstein and O. Ptitsyn, Protein physics: a course of lectures, Academic Press, 2002 Search PubMed.
- J. Hunger, K.-J. Tielrooij, R. Buchner, M. Bonn and H. J. Bakker, J. Phys. Chem. B, 2012, 116, 4783–4795 CrossRef CAS PubMed.
- S. Shimizu and D. J. Smith, J. Chem. Phys., 2004, 121, 1148–1154 CrossRef CAS PubMed.
- S. Shimizu, Proc. Natl. Acad. Sci. U. S. A., 2004, 101, 1195–1199 CrossRef CAS PubMed.
- J. Smiatek, C. Chen, D. Liu and A. Heuer, J. Phys. Chem. B, 2011, 115, 13788–13795 CrossRef CAS PubMed.
Footnotes |
| † Electronic supplementary information (ESI) available: Details of the metadynamics simulations; cumulative number of molecules around PNIPAM; transfer free energies and preferential binding parameters; local/bulk partition coefficients; differences in the transfer free energies; structural and dynamic properties of the first hydration shell around PNIPAM. See DOI: 10.1039/c6cp05991k |
| ‡ Present address: European Molecular Biology Laboratory EMBL c/o DESY, Notkestr. 85, 22607 Hamburg, Germany. |
|
| This journal is © the Owner Societies 2016 |
Click here to see how this site uses Cookies. View our privacy policy here. 
 Open Access Article
 This Open Access Article is licensed under a


 denotes the wave vector transfer with λ being the wavelength of the light, n the index of refraction of the solvent and Θ the scattering angle, at which the scattering signal is detected. The notation 〈…〉t indicates an average over time and τ denotes the lack time. For Gaussian statistics, the normalized intensity autocorrelation function g2(q,τ) is related to the normalized field correlation function g1(q,τ) with the electric field