 Open Access Article
Creative Commons Attribution 3.0 Unported Licence
Preferential solvation and ion association properties in aqueous dimethyl sulfoxide solutions†
Anand Narayanan
Krishnamoorthy
,
Johannes
Zeman
,
Christian
Holm
and
Jens
Smiatek
*
Institute for Computational Physics, University of Stuttgart, D-70569 Stuttgart, Germany. E-mail: smiatek@icp.uni-stuttgart.de; Fax: +49 711 685 63658; Tel: +49 711 63757
First published on 31st October 2016
Abstract
We study the solvation and the association properties of ion pairs in aqueous dimethyl sulfoxide (DMSO) solution by atomistic molecular dynamics (MD) simulations. The ion pair is composed of two lithium and a single sulfonated diphenyl sulfone ion whose properties are studied under the influence of different DMSO concentrations. For increasing mole fractions of DMSO, we observe a non-ideal behavior of the solution as indicated by the derivatives of the chemical activity. Our findings are complemented by dielectric spectra, which also verify a complex DMSO–water mixing behavior. In agreement with these results, further simulation outcomes reveal an aqueous homoselective solvation of the ion species which fosters the occurrence of pronounced ion association constants at higher DMSO mole fractions. The consequences of this finding are demonstrated by lower ionic conductivities for increasing concentrations of DMSO.
1 Introduction
Ion pairing is an ubiquitous effect in concentrated salt solutions1–3 which has some important consequences for complex fluids.4–11 The formation of ion aggregates significantly influences dynamic properties like ionic conductivities or diffusivities. Hence, specifically in terms of electrochemical applications, the suppression and modification of ion pair formation is highly desirable.12 In general, one can distinguish between contact and solvent-separated ion pairs,1,3,13,14 while the mechanisms leading to the formation of these aggregates are still under debate.1,14,15 Previous results demonstrated that the solvent itself as well as the solvent chemical activity1,16,17 strongly influence many effects, e.g. the formation of ion pairs,1,3 the occurrence of specific ion effects18–21 and the ion condensation behavior around macromolecules.22–30Based on these findings, one can assume that tunable mixtures provide a controllable influence on the ion pairing mechanism. In this sense, an often discussed concept for binary solutions in order to minimize the number of ion pairs is preferential solvation.31 One can distinguish between homoselective solvation, where both ion species are dissolved by the same compound of the solution, and heteroselective solvation where the solvation shells around the ions differ. A typical example for homoselective solvation is the dissolution of CaCl2 in water–methanol mixtures,32 where both ion species are preferentially solvated by water molecules. In contrast, silver nitrate in acetonitrile–water mixtures reveals a heteroselective solvation.33
A well established empirical framework to understand preferential solvation was proposed by the donor number concept.31,34 Herewith, the ability of the solvent to dissolve cations can be quantified. In more detail, solvents with a high donor number usually accumulate around cations, whereas solvents with a high acceptor number prefer the solvation of anions. Notably, the implications of the donor number concept for polyelectrolytes in water, DMSO and chloroform were recently demonstrated by experiments and simulations.35,36 The results of these studies indicated that DMSO with a high donor number (DN) fosters the occurrence of free alkali ions, and thus provides a lower association constant compared to water. Therefore, it can be assumed that the usage of binary mixtures for increasing ion dissociation behavior can be regarded as a possible option to improve the ion transport efficiency in electrochemical devices.
In this article, we study the ion pairing behavior between two lithium (Li+) and a single sulfonated diphenyl sulfone ion (SDS2−)30,36 in presence of binary DMSO–water mixtures. The corresponding chemical structure of SDS2− is depicted in Fig. 1. Polymeric forms of SDS2− and modifications thereof37–40 were discussed to be used as building materials for polymer electrolyte membranes in electrochemical applications.35,36 The presence of extremely electron-poor poly(phenylene) backbones containing sulfone-units in combination with a large number of sulfonic acid groups allows for high thermal stability and significant ion conductivities.30,35,37,38 Another advantage of these polymers is given by their high solubility in water and in a broad range of apolar solvents.36,39 In fact, the benefit of non-aqueous solvents rectifies some problems known for ordinary polymer electrolyte membranes in aqueous solution like low working temperatures or low solubility, which can be improved by adding co-solvents such as DMSO.35,41
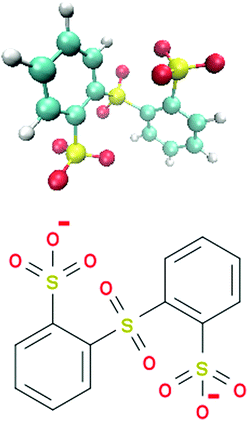 | ||
| Fig. 1 Molecular snapshot (top) and chemical structure (bottom) of the sulfonated diphenyl sulfone ion (SDS2−). | ||
In this article, we exclusively focus on the solvation of a single ion pair in DMSO–water mixtures to avoid the influence of long range electrostatic interactions and possible unwanted correlation effects between like-charged ions. The study of the binary mixture without solutes reveals a significant non-ideal behavior. Moreover, the interpretation of the dielectric spectra indicates a complex cluster formation between DMSO and water molecules in good agreement with experimental results. Further results verify the appearance of a pronounced ion pairing effect with increasing mole fractions of DMSO. Indeed, the simulation outcomes evidence a homoselective solvation of both ion species by water molecules. Our findings imply that homoselective solvation significantly influences the ion association behavior of polyelectrolytes. The presence of solvents with different donor numbers to increase ionic conductivities in terms of electrochemical applications might therefore be questionable and depends on the chosen solvents. Moreover, a previous publication42 reported a strong influence of DMSO–water mixtures on the conformational behavior of linear hydrocarbon chains. It can be therefore assumed that the complex interplay between solvents, co-solvents and solutes is more complicated than expected and far from being fully understood. As our study demonstrates, non-ideal solution effects due to interacting solvent molecules and solvent–solute interactions cannot be easily described by simple theoretical concepts. All our numerical results are in good agreement with previous experimental and simulation studies.41,43–46
The remainder of this article is organized as follows. In the next two sections we present the theoretical background and the numerical details. The simulation results are presented in the fourth section. We briefly conclude and summarize in the last section.
2 Theoretical background
Over the last centuries, several approaches were developed to study non-ideal solution effects. A standard approach to describe non-ideality is given by the chemical activity47,48| aα = exp(μα − μα*/RT) | (1) |
 | (2) |
 | (3) |
 | (4) |
 | (5) |
The presence of a preferential solvation mechanism can be detected by the calculation of the local/bulk partition coefficient54–56 which reads
 | (6) |
The occurrence of ion pairs is studied by the normalized cumulative number distribution function or distance-dependent association constant36
 | (7) |
The dielectric constant of the solution without ions can be calculated by
 | (8) |
![[M with combining right harpoon above (vector)]](https://www.rsc.org/images/entities/i_char_004d_20d1.gif) tot2〉 denotes the average of the squared net total dipole moment of molecules in the simulation box of volume V.59 In presence of charged species and periodic boundary conditions, eqn (8) is difficult to apply and one instead has to calculate the autocorrelation function of the total current or the individual currents in the system.60,61 Thus, the frequency-dependent total conductivity can be written as
tot2〉 denotes the average of the squared net total dipole moment of molecules in the simulation box of volume V.59 In presence of charged species and periodic boundary conditions, eqn (8) is difficult to apply and one instead has to calculate the autocorrelation function of the total current or the individual currents in the system.60,61 Thus, the frequency-dependent total conductivity can be written as | (9) |
![[j with combining right harpoon above (vector)]](https://www.rsc.org/images/entities/i_char_006a_20d1.gif) T for angular frequencies ω = 2πν. The brackets 〈·〉ω denote the Fourier–Laplace transformation of the autocorrelation function reading
T for angular frequencies ω = 2πν. The brackets 〈·〉ω denote the Fourier–Laplace transformation of the autocorrelation function reading | (10) |
 | (11) |
 .61 The real part of the dielectric spectra (“permittivity”) is denoted by ε′(ω) while the negative imaginary part (“loss”) is represented by ε′′(ω) such that both terms contribute to the frequency-dependent dielectric permittivity ε(ω) = ε′(ω) − iε′′(ω). Moreover, one can also determine the individual contributions or cross-correlations for the different constituents of the solution in eqn (9) by taking into account the distinct currents
 ![[j with combining right harpoon above (vector)]](https://www.rsc.org/images/entities/i_char_006a_20d1.gif) x with x ∈ {α, β, i, c}. The detailed analysis procedure for the dielectric spectra is discussed in the supplementary material. Finally, the total ionic conductivity σ = σ(ω = 0) can be calculated by
x with x ∈ {α, β, i, c}. The detailed analysis procedure for the dielectric spectra is discussed in the supplementary material. Finally, the total ionic conductivity σ = σ(ω = 0) can be calculated by | (12) |
3 Simulation details
We studied the properties of two lithium ions (Li+) and a single molecular sulfonated diphenyl sulfone ion (SDS2−) in various compositions of DMSO–water mixtures. A snapshot and the chemical structure of SDS2− are depicted in Fig. 1. Recent numerical and experimental results revealed interesting ion condensation effects for sulfonated diphenyl sulfones which motivated our choice for the study of this specific ion pair.30,36 All-atom molecular dynamics simulations were performed with the GROMACS 4.5.5 software package.64 The topologies and force fields for SDS2−, DMSO and Li+ were modeled by Generalized Amber Force Fields (GAFF)65,66 using ACPYPE67 in combination with the TIP3P water model.68 It was shown in ref. 69 and 70 that the dynamic and static properties of a broad variety of solvents, including DMSO, are well reproduced by GAFF parameters in agreement with our own consistency checks. A previous publication30 with the same force field combination for SDS2− and sodium ions in presence of TIP3P water reported reasonable results for the ion association behavior in good agreement with experimental findings. In order to check the general validity of our force field combination, we also tested different water models like the TIP4P water68 in combination with OPLS/AA,71 which gave comparable results. Two simulation sets of DMSO–water mixtures were performed. One set of simulations in presence of the SDS2− and two lithium ions and another set for the study of pure DMSO–water mixtures. For pure DMSO–water mixtures, we simulated mole fractions between xDMSO = 0.1–0.9. In contrast, preferential solvation and association properties of ion pairs were studied for mole fractions between xDMSO = 0.1–0.5.Electrostatic interactions for all systems were calculated by the Particle Mesh Ewald method72 with a Verlet cutoff scheme and a short-range radius of 1 nm. The same cutoff scheme was also used for the calculation of the Lennard-Jones interactions in combination with dispersion corrections. The Fourier grid spacing was 0.16 nm and all bonds were constrained by the LINCS algorithm.73 The time step in all simulations was 2 fs. All systems were equilibrated for 5 ns at 300 K and 1 bar pressure by using the Nose–Hoover thermostat and the Parrinello–Rahman barostat.74,75 The initial box size was (4 × 4 × 4) nm3. All pure solvent mixtures were simulated for 20 ns whereas the systems with ions were simulated for 50 ns at 300 K and 1 bar (NpT ensemble). In total, we performed more than 10.75 μs of simulation time for the calculation of the dielectric spectra, which were compared to the results of our production runs to ensure statistical accuracy (the minimum simulation time for a system was 2.14 μs). More details on the number of solvent molecules and the resulting average box lengths are presented in the supplementary material.
4 Results
4.1 Aqueous DMSO solutions without ions
We first study the properties of a binary DMSO–water mixture without ions. In fact, the properties of DMSO–water solutions were already discussed in a series of publications.42–46,76–86 As a starting point, we analyze the dynamic properties of the solvent molecules. The results for the center-of-mass diffusion coefficients are presented in Fig. 2. For pure water and pure DMSO (xDMSO = 0 and 1, respectively), we obtained diffusion coefficients of Dcm = (0.79 ± 0.01) × 10−5 cm2 s−1 (DMSO) and Dcm = (5.91 ± 0.01) × 10−5 cm2 s−1 (water) which are in reasonable agreement with previous experimental findings and simulation results (Dcm = 0.73 × 10⁻⁵ cm2 s−1 (DMSO, exp.)87 and Dcm = 5.88 × 10⁻⁵ cm2 s−1 (TIP3P, sim.)88). Minimum diffusion coefficients for both components can be found for DMSO mole fractions between xDMSO = 0.4–0.6. Thus, the diffusivity of water molecules dramatically decreases about one order whereas the effects on DMSO are less pronounced. It was already discussed in previous publications that the observed minimum diffusion coefficients indicate a non-ideal behavior of the mixture, which can be mainly attributed to the formation of pronounced DMSO–water pairs.45,46 Furthermore, the observed diffusion coefficients for all molar fractions of DMSO roughly coincide with experimental findings41 as the data in Fig. 2 suggests. Hence, also in experiments, a minimum diffusivity between xDMSO = 0.4–0.6 becomes visible.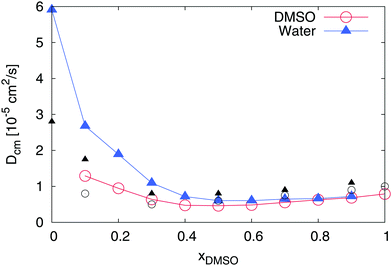 | ||
| Fig. 2 Diffusion coefficient for DMSO (blue triangles) and water molecules (red circles) in a DMSO–water mixture for different mole fractions xDMSO. All error bars are within symbol size and black symbols denote experimental results41 for DMSO (black circles) and water (black triangles) at 305 K. | ||
However, the most important indicator for a non-ideal solution behavior is demonstrated by the value of the chemical activity. Therefore, we calculated the derivative of the chemical activity aαα in accordance to eqn (4) for both individual components. As depicted in Fig. 3, water reveals a nearly ideal behavior for all mole fractions with values aαα ≈ 1. In fact, a value of aαα = 1 can be directly attributed to the equivalence of the water–water and water–DMSO Kirkwood–Buff integrals (eqn (4)). In contrast, DMSO shows a highly non-ideal behavior with the largest value aββ ≈ 13.5 at xDMSO = 0.5. The large value of aββ indicates that the value of the Kirkwood–Buff integral for DMSO–DMSO pairs is smaller than the value for the DMSO–water integral according to Gβα > Gββ. Hence, a larger excess molecule number around DMSO as defined by52
| Nxsα = ραGβα | (13) |
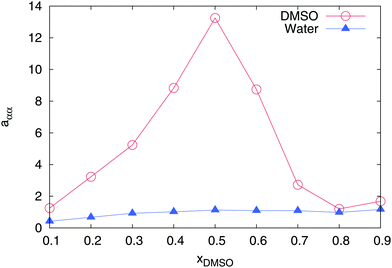 | ||
| Fig. 3 Derivative of the chemical activity aαα for DMSO (red circles) and water (blue triangles) in a DMSO–water mixture for different mole fractions xDMSO. All error bars are within symbol size. | ||
In addition to the thermodynamic properties, we also calculated the dielectric constant εr for different mole fractions xDMSO by evaluating eqn (11) in the limit of ω → 0. The corresponding results are depicted in Fig. 4. The black line corresponds to an ideal solution with  with the dielectric constants
  and
and  as found in our simulations for the pure solvents. The results for pure TIP3P water agree with previous simulations (εr = 96.9)89 whereas the dielectric constant for DMSO slightly deviates from experimental results (εr = 47.24).90 Based on our simulation outcomes, it can be concluded that a direct interaction between water and DMSO molecules due to εr < εidr is evident such that the resulting total dipole moment is significantly decreased compared with an ideal solution. Thus, all previous findings indicate a complicated interaction between DMSO and water molecules leading to highly non-ideal solution effects for intermediate DMSO mole fractions. Moreover, also experimental results44 reveal a decrease of the dielectric constant as the data in Fig. 4 indicate. Although the exact functional form differs from our findings, the range of values for the dielectric constant is roughly comparable.
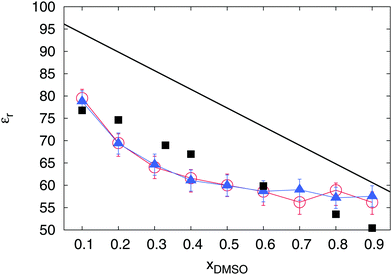 | ||
| Fig. 4 Dielectric constant εr of the solution with standard deviations for different mole fractions xDMSO as calculated by eqn (11). The black line is the theoretical result for an ideal solution. The red circles denote the results for the pure DMSO–water mixture in contrast to the blue triangles which represent the outcomes for the DMSO–water solution in presence of Li+ and SDS2− ions. Black squares denote experimental results44 at 298 K. | ||
4.2 Solvation properties of ion species
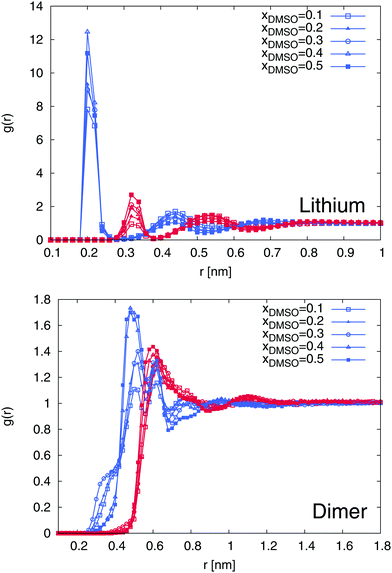
In this subsection, we focus on the solvation properties of the ions. In order to test the validity of our chosen force fields, we calculated the radial distribution function between water molecules and lithium ions in presence of the SDS2− ion and in pure water. It was discussed that specifically the hydration properties of lithium ions are of significant importance to characterize specific ion binding effects.91 The results can be found in the supplementary material. We observed a pronounced first hydration shell around Li+ within distances of 0.3 nm. The corresponding coordination number of water molecules by the integration of the radial distribution function to this distance92 yields NH2O = 4.72. The position of the first hydration shell as well as the resulting water coordination number are in good agreement with ab initio MD simulation results,93 where a coordination number NH2O ≈ 5 was reported. Therefore, we can assume that the influence of lithium ions on its local hydration shell is correctly reproduced by our chosen force field combination.In order to proceed with the solvation properties of the ions in the DMSO–water mixture, we first study the radial distribution functions (RDFs) for DMSO and water molecules around lithium ions and SDS2−. The results are shown in Fig. 5. It becomes evident that the first solvent shell around lithium ions with a maximum value at r ≈ 0.2 nm is purely composed of water molecules. With higher mole fractions of DMSO, this finding is even more pronounced with regard to slightly increasing values for the water peak. In contrast, the second solvent shell with a peak position at r ≈ 0.35 nm is formed by DMSO molecules. In total, one can observe five distinct water and DMSO solvent shells within distances r ≤ 0.9 nm. This finding can be mostly rationalized in terms of entropic effects due to the smaller size of the water molecules compared to DMSO in accordance with properties discussed for size-asymmetric ionic liquids.94,95 Noteworthy, the first solvent shell around lithium ions is always occupied by water molecules which contradicts the assumption in terms of the higher donor number for DMSO compared to water (DNDMSO = 29.8 vs. DNH2O = 18.0).34 Based on our findings, it can be concluded that molecular size effects dominate the preferential solvation of lithium ions in contrast to specific chemical details as it was discussed in a previous publication for pure solvents.36
A comparable behavior can be found for SDS2−. The first solvent shell is formed by water molecules whereas a mixed second solvent shell composed of DMSO and water molecules can be found at r ≈ 0.65 nm. Interestingly, for larger values of xDMSO, one can observe a significant increase of the first solvent shell peak value for xDMSO ≥ 0.3.
The results for the local/bulk partition coefficient in accordance to eqn (6) are shown in Fig. 6 and 7. In order to obtain reliable estimates, we only calculated the values at distances where both solvent species have a minimum coordination number of at least Nα ≥ 0.2. It can be clearly seen that the local/bulk partition DMSO coefficient around SDS2− (bottom of Fig. 6) reveals KDMSO(r) < 1 for all distances. Thus, it becomes evident that DMSO is preferentially excluded from SDS2−. This finding is also validated with regard to the strong preferential solvation of SDS2− by water molecules (bottom of Fig. 7). All values reveal KH2O(r) > 1 at short distances which even increases for higher mole fractions of DMSO. Thus, a preferential solvation of SDS2− by water molecules is indeed validated.
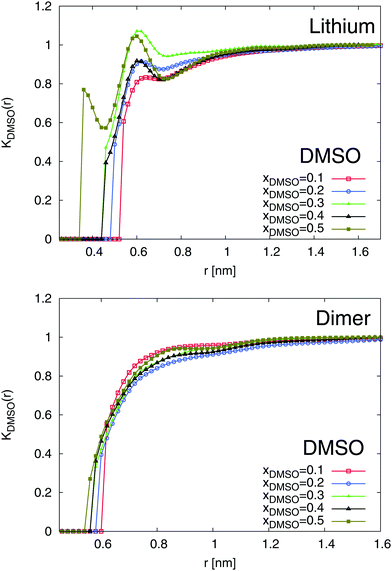 | ||
| Fig. 6 Local/bulk partition coefficient for DMSO molecules around lithium (top) and the SDS2− ion (bottom) for different DMSO mole fractions xDMSO. | ||
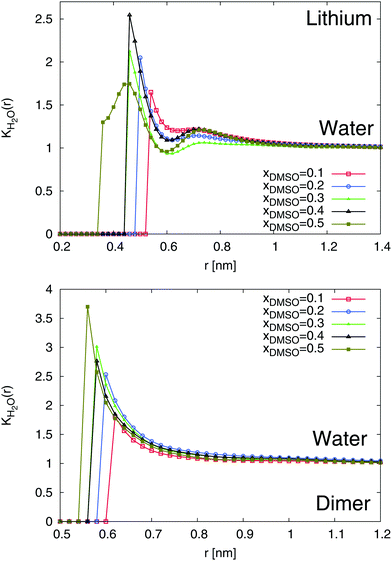 | ||
| Fig. 7 Local/bulk partition coefficient for water molecules around lithium (top) and the SDS2− ion (bottom) for different DMSO mole fractions xDMSO. | ||
In addition to SDS2−, lithium ions reveal a comparable solvation behavior (top of Fig. 6 and 7). In accordance to the radial distribution functions shown in Fig. 5, it can be clearly seen that the first solvent shell at short distances is fully occupied by water molecules due to negligible values of KDMSO(r) ≈ 0 at r ≤ 0.3 nm. The presence of distinct solvent shells remains also valid for the second pure DMSO shell at r ≈ 0.35 nm. At larger distances, a slightly preferable accumulation of DMSO molecules around Li+ in the mixed third solvent shell is indicated by KDMSO(r) ≥ 1 at distances r ≥ 0.6 and DMSO mole fractions xDMSO ≥ 0.4 (top of Fig. 6). In conjunction with this finding, large values of KH2O around lithium ions can be observed at the same distance indicating that even in the mixed third solvent shell an accumulation of water molecules is preferred (top of Fig. 7). Thus, both ion species are therefore more likely solvated by water molecules which verifies a homoselective solvation mechanism. Indeed, these results reveal the non-applicability of the donor and acceptor number concept for DMSO–water mixtures.
4.3 Dielectric spectra of aqueous DMSO solutions in presence of ions
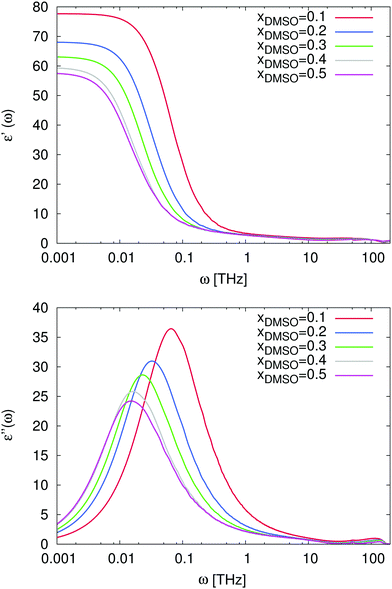
For the study of the dynamic properties of the solution, we calculated the real ε′(ω) and the negative imaginary part ε′′(ω) of the frequency-dependent dielectric permittivity according to eqn (11). The corresponding procedure for the data analysis is discussed in detail in the supplementary material whereas the results are presented in Fig. 8. The noisy data were slightly smoothed to point out the main properties and the raw data can be found in the supplementary material. As we have already mentioned before, the static dielectric permittivity ε′(ω) can be estimated for ω → 0. One can clearly observe in Fig. 8, that the resulting values decrease for increasing mole fractions of DMSO in agreement with Fig. 4.In more detail, the imaginary part of the dielectric spectrum which is shown in the bottom of Fig. 8 reveals some interesting properties as one would expect for non-ideal solutions. Main absorption peaks can be observed between ω = 0.1 THz and ω = 0.01 THz for DMSO mole fractions ranging from xDMSO = 0.1 to xDMSO = 0.5. A similar trend for increasing mole fractions with a shift of the absorption peak was also experimentally observed.44 The corresponding relaxation times are τ ≈ 63 ps (ω = 0.1 THz for xDMSO = 0.1) and τ ≈ 630 ps (ω = 0.01 THz for xDMSO = 0.5) in comparison to experimental data44 at 298 K between 22.54 ps (xDMSO = 0.1) and 53.94 ps (xDMSO = 0.4). Moreover, one can also observe a small peak at ω ≈ 100 THz which can be related to pure water modes as discussed in ref. 62 and 96. The absence of this peak for higher DMSO mole fractions complements this assumption and can be explained by librational modes of water which are suppressed with increasing DMSO fractions. In addition, also the far-infrared peak at ω = 0.1 THz belongs to the hydrogen bond network of water molecules due to the presence of a varying number of hydrogen-bonded neighbors which individually contribute to the low frequency spectrum.96 Thus it follows, that for DMSO concentrations between xDMSO = 0.1–0.5, the number of hydrogen-bonded water neighbors decreases with increasing DMSO concentration and the relaxation time increases in agreement with the observed shift to lower frequencies.
Also the non-ideal behavior of the solution is reflected by the data. In fact, the frequency of the absorption peak at ω ≈ 0.01 THz remains constant for DMSO mole fractions xDMSO = 0.4 and xDMSO = 0.5 as it was also experimentally found44 while for lower DMSO mole fractions a shift of the main peak to higher frequencies can be observed. As it was discussed in the previous subsections, it can be therefore concluded that the minimum frequency associated with the corresponding peak position can be brought into agreement with the non-ideal behavior of the solution. These results are also in reasonable agreement with our findings for the diffusion coefficient in Fig. 2 and with previous experimental results discussing the occurrence of pronounced DMSO–water interactions.44,45 It can be expected that cross-correlation contributions between water and DMSO molecules might significantly contribute to this observation.
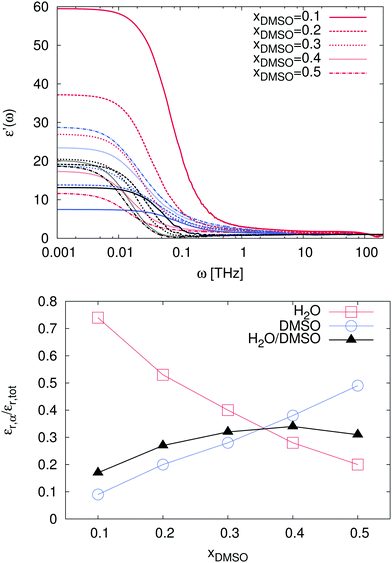
In order to study these effects in more detail, we also calculated the individual as well as the cross-correlation contributions of the species in the solution. The corresponding results are presented in Fig. 9. As a first remark, it has to be noted that ionic contributions to the dielectric spectra and their cross-correlations with other compounds are negligible and therefore not shown. For the individual solvent contributions, one can clearly see that the static dielectric permittivity εr = ε′(ω = 0) for mole fractions xDMSO ≤ 0.3 is mostly dominated by water molecules. Thus, the corresponding values for water are located in the range between εr = 11.7 (xDMSO = 0.5) and εr = 59.5 (xDMSO = 0.1) as shown in Table 1. In addition, the individual contributions to the dielectric constant are presented in the bottom of Fig. 9. It can be clearly seen that the contributions of water and DMSO to the dielectric constant decrease or increase, respectively nearly linearly with the DMSO mole fraction. Hence, the contributions of pure water and DMSO to the dielectric constant behave in good agreement with an ideal solution. The non-linear behavior mainly arises from cross-correlations between DMSO and water molecules. The main peak value is located at xDMSO = 0.4 indicating the highest amount of DMSO–water correlation effects. In addition, one can recognize that for a DMSO mole fraction between xDMSO = 0.3–0.4 all contributions are nearly comparable. Indeed, the crucial interplay between the molecules can be related to the high non-ideality of the solution at these DMSO mole fractions.
| x DMSO | 0.1 | 0.2 | 0.3 | 0.4 | 0.5 |
|---|---|---|---|---|---|
| ε H2O | 59.5 | 37.2 | 26.7 | 17.4 | 11.7 |
| ε DMSO | 7.5 | 13.8 | 18.7 | 23.5 | 28.8 |
| ε H2O/DMSO | 13.2 | 19.2 | 20.6 | 20.2 | 18.8 |
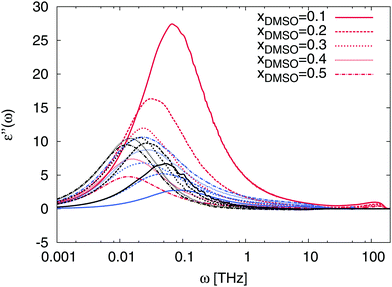
The non-ideality is also reflected by the absorption behavior of the solution in terms of the dielectric loss shown in Fig. 10. In comparison to the spectra shown in Fig. 9, also the absorption peaks of ε′′(ω) are strongly dominated by water contributions for low DMSO fractions. Interestingly, we observe a shift of the main peak to lower frequencies for both solvents with increasing DMSO fraction. Therefore, it can be concluded that the interaction between DMSO and water molecules directly affect the resulting dynamic properties of water molecules. Moreover, pronounced correlation effects between DMSO and water molecules due to peaks at frequencies between ω = 0.05–0.01 THz corresponding to molecular relaxation times between τ = 125 ps and τ = 630 ps become visible. For mole fractions between xDMSO = 0.3–0.5 representing a non-ideal solution, main absorption peaks between ω = 0.01–0.03 THz can be found which indicates that correlation effects between DMSO and water occur on characteristic time scales between τ = 200–600 ps. Therefore, it can be concluded that DMSO–water interactions result in stable complexes which reorganize at the sub-nanosecond time scale. Compared to pure water, where characteristic time scales occur on picoseconds,97 it can be stated that DMSO–water complexes show roughly two orders longer reorganization times. These findings verify the complicated interaction behavior between DMSO and water molecules which directly affect the non-ideality of the solution at specific DMSO mole fractions. A molecular picture of this effect can be established by the analysis of the intermolecular hydrogen bonds. The corresponding hydrogen bond analysis shown in the supplementary material reveals an increasing fraction of water–DMSO hydrogen bonds for higher DMSO mole fractions. A previous publication43 discussed this finding as the main reason for the non-ideality of the solution.
4.4 Ion pairing and ion conductivity
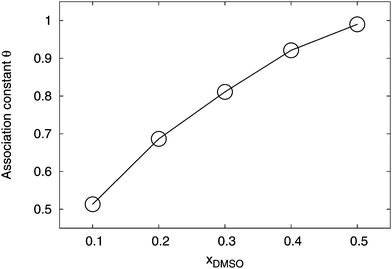
Finally, we study the formation of ions pairs in aqueous DMSO solutions. Several theories were proposed to describe the amount of ion pairing in aqueous systems (for an overview we refer the reader to ref. 1 and 3). We distinguished between bound pairs and free ions by the introduction of a cutoff radius R = 1.4 nm. Hence, if lithium ions are located within this distance around the charged –SO3− group, we considered them as condensed. Although this distance is quite large, it allows us to point out qualitative trends in the ion pairing process. The value for the cutoff distance can be rationalized with regard to Fig. 6 and 7, where bulk solution behavior for distances r ≥ 1.4 nm around both ion species can be found. A systematic estimate of the association constant at the Bjerrum length is inapplicable due inhomogeneous solvation shells around the ions which induce a locally varying dielectric constant. The corresponding results for R = 1.4 nm are presented in Fig. 11.Indeed, one can see that the association constant θ, according to eqn (7) which represents the fraction of bound lithium ions, grows non-linearly with the mole fraction of DMSO. This finding remains also valid for variations of the cutoff distances R. In more detail, the results for the radial distribution function between the SDS2− and the lithium ions (data not shown) indicated that the ion association behavior is mostly represented by direct contact pairs1 at distances r ≈ 0.2 nm. We compared the results for the association constant to standard theoretical predictions.1,98–100 A satisfying agreement with these theories could not be achieved. This might be either due to our limited set of data, inaccuracies of the chosen force fields or the influence of specific solution properties. In more detail, it was discussed in ref. 28 and 58 that specific ion effects as well as locally varying dielectric constants prohibit the usage of standard theories like the Eigen–Fuoss equation1,98 or modifications of the Manning–Oosawa counterion condensation theory by a Poisson–Boltzmann cell model approach.99–101 All these theories rely on the absence of finite-size effects and the presence of homogeneous continuum solution properties for the dielectric constant. With regard to Fig. 5, it becomes obvious that our system significantly deviates from these assumptions and reveals pronounced non-idealities, which results in an inapplicability of standard theoretical approaches.28 Hence, novel theories have to be developed, e.g. as they were discussed in ref. 19 and 28 in order to establish a reliable prediction of the counterion condensation behavior. More detailed studies in the future will help to shed light at this point. Nevertheless, our results indicate that a significant ion pair formation occurs for higher mole fractions of DMSO which complements the findings for the homoselective solvation behavior.
Furthermore, the ionic conductivity σ according to eqn (12) reveals a non-linear decrease for increasing DMSO fractions. The results are presented in Fig. 12. We obtained values between σ = 0.31 mS cm−1 for xDMSO = 0.1 and σ = 0.03 mS cm−1 for xDMSO = 0.5 with a steep decrease for mole fractions between xDMSO = 0.1–0.3. Noteworthy, a comparable decrease of σ for a polymeric form of SDS2− was also recently observed.41 Thus, the ionic conductivity decreases by roughly one order for increasing DMSO fractions. Therefore, it can be concluded that large association constants are accompanied by low ionic conductivities. Based on our findings, it becomes evident that a significant fraction of ion pairs decrease the ionic conductivity which is disadvantageous for optimizing ion conductivities in electrochemical applications.
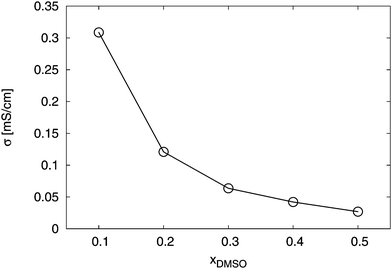 | ||
| Fig. 12 Total conductivity σ for the solution in presence of the ions for different DMSO mole fractions xDMSO. The solid line is only a guide for the eye. | ||
5 Summary and conclusion
We studied the properties of ion pairs in binary solvent mixtures of DMSO and water by molecular dynamics simulations. Our results for the derivative of the chemical activity indicate a strong non-ideal behavior of the pure solution without ions for mole fractions between xDMSO = 0.3–0.5. These findings are complemented and supported by the analysis of the dielectric spectra. All our results verify a strong water–DMSO interaction for moderate DMSO mole fractions resulting in stable complexes. The presence of these complexes as well as their binding properties significantly influence the dynamic and the static properties of the solution resulting in the strong non-ideal behavior. Moreover, the absence of a preferential heteroselective solvation behavior for the ions is evident. In fact, the first solvation shell around both constituents is purely formed by water molecules. Vice versa, we observed a preferential exclusion of DMSO around both ion species. Hence, with regard to the functionality of DMSO molecules in the mixture and on their action on the solutes, it can be speculated that DMSO reveals similar properties like osmolytes known as protein protectants, e.g. trimethylamine-N-oxide (TMAO), ectoine or hydroxyectoine.97 Specifically for these molecules, a preferential exclusion around differently charged solutes was observed. Thus, the strong interaction with the local solvent shell favors their occurrence in bulk solution which agrees with the observed behavior for DMSO. In summary, one can assume that heteroselective solvation is mostly influenced by the solvent composition, the specific molecular details of both solvent molecules and their preference to interact with the solute.In summary, our study indicates that preferential heteroselective solvation of different solutes with regard to varying values for the donor and acceptor numbers fails for aqueous DMSO solutions. Competing effects like preferential exclusion in aqueous solution might dominate, which verifies the complicated interplay between the components of the mixture. A strong indicator is given by the non-ideality of the solution which demonstrates that both solvent molecules strongly interact. Our study presents a first step towards a deeper understanding of the underlying effects. More effort has to be spent for a full understanding of these interesting solution properties.
Acknowledgements
We thank Andreas Wohlfarth, Klaus-Dieter Kreuer and Frank Uhlig for valuable discussions. Financial funding is gratefully acknowledged from the Deutsche Forschungsgemeinschaft through the SFB 716 and the cluster of excellence “Simulation Technology” (EXC 310).References
- Y. Marcus and G. Hefter, Chem. Rev., 2006, 106, 4585–4621 CrossRef CAS PubMed.
- A. Ciferri and A. Perico, Ionic interactions in natural and synthetic macromolecules, Wiley Online Library, 2012 Search PubMed.
- N. F. A. van der Vegt, K. Haldrup, S. Roke, J. Zheng, M. Lund and H. J. Bakker, Chem. Rev., 2016, 116, 7626–7641 CrossRef CAS PubMed.
- T. Köddermann, C. Wertz, A. Heintz and R. Ludwig, ChemPhysChem, 2006, 7, 1944–1949 CrossRef PubMed.
- H. Weingärtner, Angew. Chem., Int. Ed., 2008, 47, 654–670 CrossRef PubMed.
- R. G. Winkler, M. Gold and P. Reineker, Phys. Rev. Lett., 1998, 80, 3731 CrossRef CAS.
- A. Naji, S. Jungblut, A. G. Moreira and R. R. Netz, Physica A, 2005, 352, 131–170 CrossRef.
- H. Boroudjerdi, Y.-W. Kim, A. Naji, R. R. Netz, X. Schlagberger and A. Serr, Phys. Rep., 2005, 416, 129–199 CrossRef CAS.
- T. Farhat, G. Yassin, S. T. Dubas and J. B. Schlenoff, Langmuir, 1999, 15, 6621–6623 CrossRef CAS.
- B. Qiao, J. J. Cerdà and C. Holm, Macromolecules, 2010, 43, 7828–7838 CrossRef CAS.
- M. Vögele, C. Holm and J. Smiatek, J. Chem. Phys., 2015, 143, 243151 CrossRef PubMed.
- K.-D. Kreuer, Chem. Mater., 2013, 26, 361–380 CrossRef.
- G. Ciccotti, M. Ferrario, J. T. Hynes and R. Kapral, Chem. Phys., 1989, 129, 241–251 CrossRef CAS.
- P. Ganguly, P. Schravendijk, B. Hess and N. F. van der Vegt, J. Phys. Chem. B, 2011, 115, 3734–3739 CrossRef CAS PubMed.
- T. Hajari, P. Ganguly and N. F. van der Vegt, J. Chem. Theory Comput., 2012, 8, 3804–3809 CrossRef CAS PubMed.
- J. Rösgen, B. M. Pettitt, J. Perkyns and D. W. Bolen, J. Phys. Chem. B, 2004, 108, 2048–2055 CrossRef.
- J. Rösgen, B. M. Pettitt and D. W. Bolen, Biochemistry, 2004, 43, 14472–14484 CrossRef PubMed.
- Y. Marcus, Chem. Rev., 2009, 109, 1346–1370 CrossRef CAS PubMed.
- W. Kunz, Specific ion effects, World Scientific, 2010 Search PubMed.
- P. Lo Nostro and B. W. Ninham, Chem. Rev., 2012, 112, 2286–2322 CrossRef CAS PubMed.
- P. Jungwirth and P. S. Cremer, Nat. Chem., 2014, 6, 261–263 CrossRef CAS PubMed.
- Y. Zhang and P. S. Cremer, Curr. Opin. Chem. Biol., 2006, 10, 658–663 CrossRef CAS PubMed.
- B. Jagoda-Cwiklik, R. Vácha, M. Lund, M. Srebro and P. Jungwirth, J. Phys. Chem. B, 2007, 111, 14077–14079 CrossRef CAS PubMed.
- M. Lund, R. Vácha and P. Jungwirth, Langmuir, 2008, 24, 3387–3391 CrossRef CAS PubMed.
- B. Hess and N. F. van der Vegt, Proc. Natl. Acad. Sci. U. S. A., 2009, 106, 13296–13300 CrossRef CAS PubMed.
- N. Vlachy, B. Jagoda-Cwiklik, R. Vácha, D. Touraud, P. Jungwirth and W. Kunz, Adv. Colloid Interface Sci., 2009, 146, 42–47 CrossRef CAS PubMed.
- E. A. Algaer and N. F. van der Vegt, J. Phys. Chem. B, 2011, 115, 13781–13787 CrossRef CAS PubMed.
- J. Heyda and J. Dzubiella, Soft Matter, 2012, 8, 9338–9344 RSC.
- J. Paterová, K. B. Rembert, J. Heyda, Y. A. Kurra, H. I. Okur, W. R. Liu, C. Hilty, P. S. Cremer and P. Jungwirth, J. Phys. Chem. B, 2013, 117, 8150–8158 CrossRef PubMed.
- A. Wohlfarth, J. Smiatek, K.-D. Kreuer, S. Takamuku, P. Jannasch and J. Meier, Macromolecules, 2015, 48, 1134–1143 CrossRef CAS.
- C. Reichardt and T. Welton, Solvents and solvent effects in organic chemistry, John Wiley & Sons, 2011 Search PubMed.
- H. Schneider and H. Strehlow, Z. Elektrochem., 1962, 66, 309–312 CAS.
- Y. Marcus, J. Chem. Soc., Dalton Trans., 1991, 2265–2268 RSC.
- V. Gutmann, Electrochim. Acta, 1976, 21, 661–670 CrossRef CAS.
- K.-D. Kreuer, A. Wohlfarth, C. C. de Araujo, A. Fuchs and J. Maier, ChemPhysChem, 2011, 12, 2558–2560 CrossRef CAS PubMed.
- J. Smiatek, A. Wohlfarth and C. Holm, New J. Phys., 2014, 16, 025001 CrossRef.
- M. Schuster, K.-D. Kreuer, H. T. Andersen and J. Maier, Macromolecules, 2007, 40, 598–607 CrossRef CAS.
- M. Schuster, C. C. de Araujo, V. Atanasov, H. T. Andersen, K.-D. Kreuer and J. Maier, Macromolecules, 2009, 42, 3129–3137 CrossRef CAS.
- G. Titvinidze, K.-D. Kreuer, M. Schuster, C. C. de Araujo, J. P. Melchior and W. H. Meyer, Adv. Funct. Mater., 2012, 22, 4456–4470 CrossRef CAS.
- C. Wang and S. J. Paddison, J. Phys. Chem. A, 2013, 117, 650–660 CrossRef CAS PubMed.
- A. Wohlfarth, Charge carrier formation, mobility and microstructure of sulfonated polyelectrolytes for electrochemical applications, PhD thesis, University of Stuttgart, Germany, 2015, http://dx.doi.org/10.18419/opus-6877 Search PubMed.
- R. Ghosh, S. Banerjee, S. Chakrabarty and B. Bagchi, J. Phys. Chem. B, 2011, 115, 7612–7620 CrossRef CAS PubMed.
- A. Luzar and D. Chandler, J. Chem. Phys., 1993, 98, 8160–8173 CrossRef CAS.
- Z. Lu, E. Manias, D. D. Macdonald and M. Lanagan, J. Phys. Chem. A, 2009, 113, 12207–12214 CrossRef CAS PubMed.
- Z. Lu, E. Manias, M. Lanagan and D. Macdonald, ECS Trans., 2010, 28, 11–21 CAS.
- N. Zhang, W. Li, C. Chen and J. Zuo, Comput. Theor. Chem., 2013, 1017, 126–135 CrossRef CAS.
- P. W. Atkins and J. de Paula, Physical Chemistry, OUP, Oxford, 2010 Search PubMed.
- M. J. Blandamer, J. B. Engberts, P. T. Gleeson and J. C. R. Reis, Chem. Soc. Rev., 2005, 34, 440–458 RSC.
- J. G. Kirkwood and F. P. Buff, J. Chem. Phys., 1951, 19, 774–777 CrossRef CAS.
- A. Ben-Naim, Statistical thermodynamics for chemists and biochemists, Springer Science & Business Media, 2013 Search PubMed.
- P. E. Smith, Biophys. J., 2006, 91, 849–856 CrossRef CAS PubMed.
- V. Pierce, M. Kang, M. Aburi, S. Weerasinghe and P. E. Smith, Cell Biochem. Biophys., 2008, 50, 1–22 CrossRef CAS PubMed.
- P. E. Smith, J. Phys. Chem. B, 2004, 108, 18716–18724 CrossRef CAS.
- E. Courtenay, M. Capp, C. Anderson and M. Record, Biochemistry, 2000, 39, 4455–4471 CrossRef CAS PubMed.
- F. Rodríguez-Ropero and N. F. van der Vegt, J. Phys. Chem. B, 2014, 118, 7327–7334 CrossRef PubMed.
- S. Micciulla, J. Michalowsky, M. A. Schroer, C. Holm, R. von Klitzing and J. Smiatek, Phys. Chem. Chem. Phys., 2016, 18, 5324–5335 RSC.
- W. B. Russel, D. A. Saville and W. R. Schowalter, Colloidal dispersions, Cambridge University Press, 1989 Search PubMed.
- F. Fahrenberger, O. A. Hickey, J. Smiatek and C. Holm, Phys. Rev. Lett., 2015, 115, 118301 CrossRef PubMed.
- M. Neumann, Mol. Phys., 1983, 50, 841–858 CrossRef CAS.
- J. Caillol, D. Levesque and J. Weis, J. Chem. Phys., 1986, 85, 6645–6657 CrossRef CAS.
- C. Schröder and O. Steinhauser, J. Chem. Phys., 2009, 131, 114504 CrossRef PubMed.
- M. Sega, S. Kantorovich, C. Holm and A. Arnold, J. Chem. Phys., 2014, 140, 211101 CrossRef CAS PubMed.
- F. Dommert, J. Schmidt, B. Qiao, Y. Zhao, C. Krekeler, L. Delle Site, R. Berger and C. Holm, J. Chem. Phys., 2008, 129, 224501 CrossRef PubMed.
- S. Pronk, S. Páll, R. Schulz, P. Larsson, P. Bjelkmar, R. Apostolov, M. R. Shirts, J. C. Smith, P. M. Kasson, D. van der Spoel, B. Hess and E. Lindahl, Bioinformatics, 2013, 29, 845–854 CrossRef CAS PubMed.
- J. Wang, R. M. Wolf, J. W. Caldwell, P. A. Kollman and D. A. Case, J. Comput. Chem., 2004, 25, 1157–1174 CrossRef CAS PubMed.
- J. Wang, W. Wang, P. A. Kollman and D. A. Case, J. Mol. Graphics Modell., 2006, 25, 247–260 CrossRef CAS PubMed.
- A. W. S. da Silva and W. F. Vranken, BMC Res. Notes, 2012, 5, 367 CrossRef PubMed.
- W. L. Jorgensen, J. Chandrasekhar, J. D. Madura, R. W. Impey and M. L. Klein, J. Chem. Phys., 1983, 79, 926–935 CrossRef CAS.
- J. Wang and T. Hou, J. Comput. Chem., 2011, 32, 3505–3519 CrossRef CAS PubMed.
- C. Caleman, P. J. van Maaren, M. Hong, J. S. Hub, L. T. Costa and D. van der Spoel, J. Chem. Theory Comput., 2011, 8, 61–74 CrossRef PubMed.
- W. L. Jorgensen, D. S. Maxwell and J. Tirado-Rives, J. Am. Chem. Soc., 1996, 118, 11225–11236 CrossRef CAS.
- T. Darden, D. York and L. Pedersen, J. Chem. Phys., 1993, 98, 10089–10092 CrossRef CAS.
- B. Hess, H. Bekker, H. J. C. Berendsen and J. G. E. M. Fraaije, J. Comput. Chem., 1997, 18, 1463–1472 CrossRef CAS.
- D. Frenkel and B. Smit, Understanding molecular simulation: from algorithms to applications, Academic press, 2001 Search PubMed.
- M. Parrinello and A. Rahman, J. Appl. Phys., 1981, 52, 7182–7190 CrossRef CAS.
- H. L. Clever and S. P. Pigott, J. Chem. Thermodyn., 1971, 3, 221–225 CrossRef CAS.
- S. Lam and R. Benoit, Can. J. Chem., 1974, 52, 718–722 CrossRef CAS.
- P. Fiordiponti, F. Rallo and F. Rodante, Z. Phys. Chem., 1974, 88, 149–159 CrossRef CAS.
- T. Chan and W. A. van Hook, J. Solution Chem., 1976, 5, 107–123 CrossRef CAS.
- T. J. Day and G. Patey, J. Chem. Phys., 1999, 110, 10937–10944 CrossRef CAS.
- I. I. Vaisman and M. L. Berkowitz, J. Am. Chem. Soc., 1992, 114, 7889–7896 CrossRef CAS.
- I. A. Borin and M. S. Skaf, J. Chem. Phys., 1999, 110, 6412–6420 CrossRef CAS.
- A. Vishnyakov, A. P. Lyubartsev and A. Laaksonen, J. Phys. Chem. A, 2001, 105, 1702–1710 CrossRef CAS.
- M. L. Strader and S. E. Feller, J. Phys. Chem. A, 2002, 106, 1074–1080 CrossRef CAS.
- S. J. Bachmann and W. F. van Gunsteren, J. Phys. Chem. B, 2014, 118, 10175–10186 CrossRef CAS PubMed.
- A. Perera and R. Mazighi, J. Chem. Phys., 2015, 143, 154502 CrossRef PubMed.
- M. Holz, S. R. Heil and A. Sacco, Phys. Chem. Chem. Phys., 2000, 2, 4740–4742 RSC.
- P. Mark and L. Nilsson, J. Phys. Chem. A, 2001, 105, 9954–9960 CrossRef CAS.
- P. Hochtl, S. Boresch, W. Bitomsky and O. Steinhauser, et al. , J. Chem. Phys., 1998, 109, 4927–4937 CrossRef CAS.
- W. M. Haynes, CRC Handbook of Chemistry and Physics, CRC press, 2014 Search PubMed.
- K. D. Collins, Methods, 2004, 34, 300–311 CrossRef CAS PubMed.
- V. Lesch, A. Heuer, B. R. Rad, M. Winter and J. Smiatek, Phys. Chem. Chem. Phys., 2016, 18, 28403–28408 RSC.
- A. Tongraar, K. R. Liedl and B. M. Rode, Chem. Phys. Lett., 1998, 286, 56–64 CrossRef CAS.
- V. Lesch, A. Heuer, C. Holm and J. Smiatek, ChemPhysChem, 2016, 17, 387–394 CrossRef CAS PubMed.
- V. Lesch, A. Heuer, C. Holm and J. Smiatek, Phys. Chem. Chem. Phys., 2015, 17, 8480–8490 RSC.
- M. Sega and C. Schröder, J. Phys. Chem. A, 2014, 119, 1539–1547 CrossRef PubMed.
- J. Smiatek, J. Phys. Chem. B, 2014, 118, 771–782 CrossRef CAS PubMed.
- R. M. Fuoss, J. Am. Chem. Soc., 1958, 80, 5059–5061 CrossRef CAS.
- G. Manning, J. Chem. Phys., 1969, 51, 924–933 CrossRef CAS.
- F. Oosawa, Polyelectrolytes, Marcel Dekker, New York, 1971 Search PubMed.
- M. Deserno, C. Holm and S. May, Macromolecules, 2000, 33, 199–206 CrossRef CAS.
Footnote |
| † Electronic supplementary information (ESI) available. See DOI: 10.1039/c6cp05909k |
| This journal is © the Owner Societies 2016 |

