 Open Access Article
Shedding light on the mechanism of asymmetric track etching: an interplay between latent track structure, etchant diffusion and osmotic flow†
Pavel Y.
Apel
 *ab,
Valery V.
Bashevoy
a,
Irina V.
Blonskaya
a,
Nikolay E.
Lizunov
a,
Oleg L.
Orelovitch
a and
Christina
Trautmann
cd
aJoint Institute for Nuclear Research, Joliot-Curie Street 6, 141980 Dubna, Russian Federation. E-mail: apel@jinr.ru
bDubna State University, Universitetskaya Street 19, 141980 Dubna, Russian Federation
cGSI Helmholtzzentrum für Schwerionenforschung, Planckstraße 1, 64291 Darmstadt, Germany
dMaterialwissenschaft, Technische Universität Darmstadt, Alarich-Weiss-Straße 2, 64287 Darmstadt, Germany
First published on 26th August 2016
Abstract
The method of producing single track-etched conical nanopores has received considerable attention and found many applications in diverse fields such as biosensing, nanofluidics, information processing and others. The performance of an asymmetric nanopore is largely determined by its geometry, especially by the size and shape of its tip. In this paper we reconstruct the profiles of so-called conical pores fabricated by asymmetric chemical etching of ion tracks in polymer foil. Conductometric measurements during etching and field emission scanning electron microscopy examinations of the resulting pores were employed in order to determine the pore geometry. We demonstrate that the pore constriction geometry evolves through a variety of configurations with advancing time after breakthrough. While immediately after breakthrough the pore tips are trumpet-shaped, further etching is strongly affected by osmotic effects which eventually lead to bullet-shaped pore tips. We evidence that the osmotic flow appearing during asymmetric track etching has a determinative effect on pore formation. A convection–diffusion model is presented that semi-quantitatively explains the effect of osmotic processes under asymmetric track etching conditions. In addition, a phenomenon of reagent contaminant precipitation in nanopores is reported and discussed.
1 Introduction
Present-day nanotechnology is an extensive field of basic and application-oriented research that comprises a wide variety of approaches utilizing various physical and chemical principles and tools. Accelerated heavy ion beams are one of the tools used to modify materials on the nanometer scale and create novel nano-structured materials.1–3 The irradiation with high-energy heavy ions produces so-called ion tracks, very narrow cylindrical regions of modified materials. Track formation occurs mainly in insulators and is due to the energy transfer of the energetic projectile to the electrons of the target material. In various insulators, tracks can be etched out and transformed into uniform micro- and nano-sized pores. Their diameter, shape, orientation and number density can be varied in a controllable manner so that a membrane with the required structure and transport characteristics can be produced.4–6 The ability to create either a single pore in a sample or a multitude of pores (within a range of ten orders of magnitude) is a unique property of the ion track technology.In the past two decades a great deal of work has been devoted to the development of nanopore-based devices, primarily for single-molecule detection, manipulation and characterization.7–11 Track-etched nanopores have found their niche in this broad field of research and development with artificial nanometer-sized pores mainly in polymers. In particular, asymmetric single-ion track pores, exhibiting diode-like behavior in electrolyte solutions,12,13 have attracted special interest. Due to this unusual property, asymmetric track-etched nanopores have great potential in many analytical applications.14–26 They have become the subject of extensive studies, from both theoretical and experimental viewpoints, with the goals of better understanding the transport of electrolytes in confined geometry and developing new nanofluidic devices.27–40
Best known and most widely applied asymmetric track-etched nanopores are the so-called conical pores. The fabrication includes the irradiation of a polymer foil with heavy ions of MeV–GeV kinetic energy. Each ion produces a track that can be converted into an open channel by chemical etching. Conical pores are produced by one-sided chemical etching. The irradiated foil separates the two compartment of an electrolytical cell where one side contains the alkaline etchant and the other side a stopping solution.12Via two chemically inert metal electrodes a bias voltage can be applied to the system. When the etchant breaks through to the other side of the foil, it is neutralized by the stopping solution. In the case of single-pore membranes, the breakthrough is instantly detected as an ionic current of 0.1–1 nA between the electrodes. The electric field appearing in the pore at breakthrough is assumed to remove the hydroxide ions from the newborn pore towards the positive electrode, thus preventing further enlargement of the pore. As a result, an asymmetric pore is obtained exhibiting a large opening of the order of hundreds of nanometers and a small opening of the order of several nanometers in diameter. Such approximately conical pores possess ionic selectivity and exhibit ionic current rectification effects. A series of theoretical and experimental studies27–38 have focused on the mechanism of current rectification. It has been shown that the pore shape and the distribution of the electrical charge along the pore are key factors affecting the diode-like behavior. In ref. 34, three main geometries of pore tip were introduced: conical, trumpet-like and bullet-like. These different shapes were ascribed to channels that widens with increasing distance from the film surface at a constant, an increasing and a decreasing rate, respectively. It was stressed that “the degree of rectification is very sensitive to the situation of the region near the nanopore tip”28 and “therefore, small changes in the size and shape of this region result in significant changes in the ionic transport properties of the nanopore”.34
However, an accurate characterization of the narrow orifice of conical nanopores remains very difficult. A common approach to determine the pore geometry is Field Emission Scanning Electron Microscopy (FESEM) observation of metal replicas.15,17–19,37,41–43 However, even in the case of high-quality replicas the FESEM images provide only limited information and are not suitable to expose details of the very tip of the pore, whose radius is as small as several nanometers. At the same time it is very important to reveal the configuration of this small tip region because its radius is smaller than the track radius created when the energetic ion passes through the polymer. In polyethylene terephthalate (PET), as well as in some other polymers, the track has a complex damage structure.44 The core of the track with a radius of several nanometers consists of severely damaged material including broken bonds and loss of volatile degradation fragments. Track etching of this region occurs at high speed. The evolution of a nanopore in the longitudinal direction is determined by the rapid propagation of the etching front along the track core. The track core is surrounded by a halo where the etching rate decreases down to a value below the etching rate of the undamaged polymer. The minimum etching rate is observed at radii of 5–10 nm from the actual track center, depending on the energy loss of the passing particle,44 and presumably corresponds to the highest concentration of radiation-induced cross-links between macromolecules. As a result, the radial growth of a nanopore occurs at a speed that passes through a minimum and gradually approaches the typical value of the pristine polymer. The radius of the halo is as large as 50–100 nm, i.e. much larger than the typical tip radius of conical nanopores. Based on these facts, it was concluded that such pores are conical only on the micrometer scale while on the nanometer scale they are rather trumpet-shaped.5
Recently a method to quantitatively estimate the effect of the track structure on the shape of “conical” nanopores was suggested.45a The method is based on conductometric monitoring of symmetrical etching, i.e., etching with the same etchant on both sides of the foil. In this case the profile of the quasi-double-conical pore can be reconstructed from the time dependence of pore conductance. In the case where the pore is etched symmetrically with respect to the center plane of the foil, its evolution can be relatively accurately pictured as the movement of two pore halves towards each other at a constant speed. The minimal pore radius is formed at the point where the two advancing pore front halves meet. Its size as a function of time r(t) is calculated not directly from the pore conductance but from the first derivative of the pore resistance. This approach does not imply that the pore shape is conical; the calculation method is valid both for concave and for convex longitudinal pore profiles. The same model of pore growth as the movement of two mirror halves was used to obtain the longitudinal profile of the asymmetric pore from the r(t) function. One half of a symmetrically etched pore represents the geometry of an asymmetrically etched pore at the moment of breakthrough. Experiments with tracks produced by different heavy ions showed that the narrow region of the asymmetrically etched pores is not conical but of trumpet-like shape and the degree of deviation from conical shape depends on the atomic number of the track-forming ion. It was shown that application of the cone model underestimates the tip diameter and overestimates the tapering angle in the tip region. Correspondingly, the ion current rectification properties were shown to significantly depend on the actual shape of the pore tip.45b This approach represented an important step towards the accurate description of track-etched asymmetric nanopores. Nevertheless, further improvement is needed in order to take into account other factors that may affect the pore geometry. Under asymmetric etching, the stopping solution may diffuse into the unetched track and alter the etching conditions when the pore tip is developed.24 Moreover, asymmetric etching may continue after breakthrough and, thus, it is unclear what happens to the narrowest pore region where the etchant and the stopping solution interact. In the present work we focus on the reconstruction of pore profiles obtained under asymmetric etching conditions both at and after breakthrough. The experimental data allows us to disentangle the specific roles of different components in the stopping medium.
2 Experimental
2.1 Ion irradiation
Polyethylene terephthalate (PET) biaxially oriented films (12 μm-thick Hostaphan RN, Kalle, Germany) were irradiated with single 2 GeV Au ions at the UNILAC accelerator of GSI (Darmstadt). In addition, reference samples were irradiated at a nominal fluence of 107 cm−2 under identical conditions. The actual track densities were determined using FESEM showing values between 1.2 × 10⁷ and 1.5 × 107 cm−2. Given by the large range of the Au ions (>130 μm),46 we irradiated stacks of 7 foils (total thickness 84 μm). The specific energy loss of the ions when passing through the foil stack varied only by about 10% (18–20 MeV μm−1![[thin space (1/6-em)]](https://www.rsc.org/images/entities/char_2009.gif) 46), therefore, the radii of the unetched tracks in the different PET layers can be regarded as almost constant.44a
46), therefore, the radii of the unetched tracks in the different PET layers can be regarded as almost constant.44a
2.2 Etching and electrical measurement conditions
Etching of single- and multi-track samples was performed in two-compartment electrolytic cells, providing identical treatment conditions. Before etching, all samples were exposed 60 min to soft ultraviolet (UV) radiation (wavelength >315 nm, with pristine 12 μm thick PET foil used as filter) to stabilize the track-to-bulk etch ratio. The intensity of UV radiation reaching the surface of the sample was ∼2.5 W m−2 (measured by a UV radiometer TKA-PKM, model 12, Russia). Depending on the goal of each particular experiment, two different etching procedures were employed. The first was a two-step etching procedure that included asymmetric etching of single-track samples until breakthrough (step I) and symmetric etching after breakthrough (step II). In step I, one compartment of the cell was filled with 9 M NaOH and the other compartment contained a mixture of 2 M KCl and 2 M HCOOH (50![[thin space (1/6-em)]](https://www.rsc.org/images/entities/char_2009.gif) :
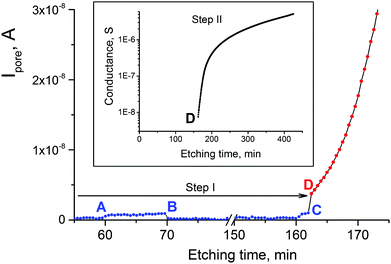
:![[thin space (1/6-em)]](https://www.rsc.org/images/entities/char_2009.gif) 50, v/v). This stopping solution recipe is referred to as 1 M KCl/1 M HCOOH throughout the paper. In some experiments solutions of single reagents (1 M KCl or 1 M HCOOH) were employed. Conductometric monitoring of the etching process for single-track samples was performed in AC or DC mode using a PC-controlled LCR-meter (HiTESTER 3522-50, HIOKI E. E. Corporation, Japan). In AC mode, the electrical resistance was measured by applying a sinusoidal voltage with an amplitude of 0.5 V and a frequency of 1333 Hz to the gold electrodes (1 cm2 surface area). In DC mode, a bias voltage of 0.5–1 V was applied to the electrodes, always with the positive sign on the alkali side. To avoid overflow of the measuring device in the beginning of the process, a calibrated resistor was connected in parallel with the cell. The respective conductance was subtracted from the measured values to obtain the conductance G of the pore itself. Pore breakthrough was identified by a sharp onset of the electrical current. Immediately after detection of a through pore, the stopping solution was removed from the compartment and replaced with 9 M NaOH. The compartment had a special tilted channel through which a jet of alkaline solution, using a syringe, was directed to the sample surface to ensure fast wetting of the sample by the etchant. From this moment on, step II started and symmetric etching was monitored conductometrically in AC mode. Switching to AC mode was dictated by the necessity to avoid polarization of electrodes when monitoring the electrical current up to 10−5–10−4 A.45b
50, v/v). This stopping solution recipe is referred to as 1 M KCl/1 M HCOOH throughout the paper. In some experiments solutions of single reagents (1 M KCl or 1 M HCOOH) were employed. Conductometric monitoring of the etching process for single-track samples was performed in AC or DC mode using a PC-controlled LCR-meter (HiTESTER 3522-50, HIOKI E. E. Corporation, Japan). In AC mode, the electrical resistance was measured by applying a sinusoidal voltage with an amplitude of 0.5 V and a frequency of 1333 Hz to the gold electrodes (1 cm2 surface area). In DC mode, a bias voltage of 0.5–1 V was applied to the electrodes, always with the positive sign on the alkali side. To avoid overflow of the measuring device in the beginning of the process, a calibrated resistor was connected in parallel with the cell. The respective conductance was subtracted from the measured values to obtain the conductance G of the pore itself. Pore breakthrough was identified by a sharp onset of the electrical current. Immediately after detection of a through pore, the stopping solution was removed from the compartment and replaced with 9 M NaOH. The compartment had a special tilted channel through which a jet of alkaline solution, using a syringe, was directed to the sample surface to ensure fast wetting of the sample by the etchant. From this moment on, step II started and symmetric etching was monitored conductometrically in AC mode. Switching to AC mode was dictated by the necessity to avoid polarization of electrodes when monitoring the electrical current up to 10−5–10−4 A.45b
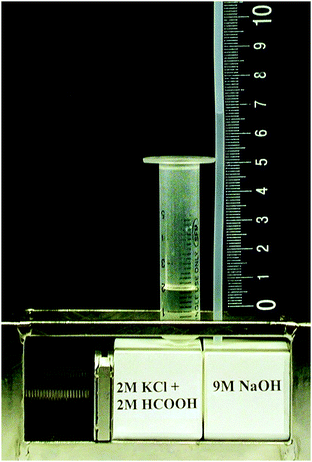
The second procedure included observation and measurement of osmotic flow through newborn pores during asymmetric etching. The cell used for this purpose had a larger etched surface area (about 2.8 cm2) and was equipped with a capillary, made of fluoropolymer, with a 2 mm inner diameter, inserted into the compartment with the alkaline solution (9 M NaOH) (see Fig. 1). The inner volume of each compartment of the cell was 3 cm3. All etching experiments were performed at ambient temperature of 22.0 ± 0.5 °C. The temperature inside the cell was measured to check if the heat of neutralization and the heat of hydration caused elevated temperature in the vicinity of the polymer foil. The maximum rise did not exceed 1.5°.
Ultra-pure water, 18.2 MΩ cm, from Arium (Vladisart) and reagent grade chemicals from Sigma Aldrich were used for solutions preparation.
2.3 Electron microscopy and element analysis
After the etching process was stopped, the samples were carefully rinsed with deionized water and air-dried. Electron microscopy investigations were performed on multi-track samples using an FESEM instrument (Hitachi SU8020, Japan) equipped with an energy dispersive X-rays microanalysis system. The surface of the samples was sputtered with a 10 nm-thick chromium layer. Surfaces with the smallest pores (≤20 nm) were observed using the deceleration voltage mode. In order to avoid modification of the true surface structure no conductive layer was sputtered on these specimens.The pore profiles were determined via imaging of fractured samples. A special technique was used to render the polymer brittle and avoid residual strain in the fractured specimens. The technique entails the controlled photo-oxidation of the membrane matrix under exposure to soft UV light. The UV exposure was chosen such that the specimen easily broke when touched with tweezers. Pores that cleaved exactly along their longitudinal axis were selected for imaging. Details of sample preparation, including special precautions taken to exclude the possibility of distorting the membrane structure near the pore tip, were reported previously.39
Energy-dispersive X-ray element analysis of nanoparticles on sample surfaces was carried out with the Thermo Scientific™ NORAN™ System 7.
3 Results and discussion
3.1 Pore shape at and immediately after breakthrough
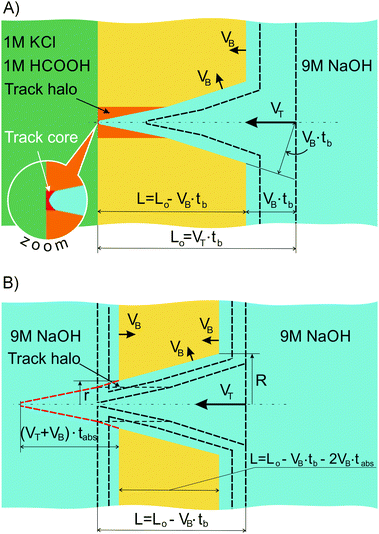
Let us consider a situation where we rapidly replace at tb the stopping solution with 9 M NaOH, i.e. with a solution identical to that in the right-hand compartment. At that point, a second etching stage commences and from this moment on the asymmetric pore grows as shown in Fig. 2(B). The pore profile continues to travel from left to right at constant speed VT. The foil is getting thinner, i.e. both flat surfaces move towards each other at speed VB. The respective decrease of the foil thickness is equal to 2VB·tabs, where tabs is the time of etching under symmetric conditions after breakthrough. The electrical resistance of the electrolyte in the pore changes in time due to alterations in the pore geometry at both ends of the pore. The main part of the pore moves as a whole and thus has a constant electrical resistance. Within a small increment of time dt the narrow side of the pore (left side in Fig. 2(B)) becomes shorter by (VT + VB)dt. The relevant decrease of the electrical resistance is
 | (1) |
 | (2) |
 | (3) |
 | (4) |
The desired longitudinal pore profile rx(x) is found from r(t), based on the fact that the time dependence and the distance dependence are linked to each other via the parameter VT + VB, i.e. the speed of the virtual movement of the trumpet-like channel relative to the left-hand surface of the foil in Fig. 2(B). The rx(x) function is given by a pair of parametric equations with parameter tabs:
| rx(tabs) = r(tabs) | (5) |
| x(tabs) = (VT + VB)tabs | (6) |
 | (7) |
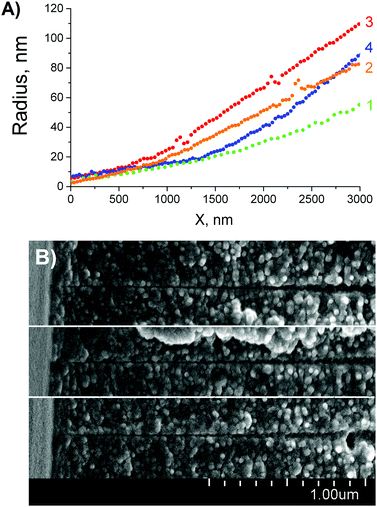 | ||
| Fig. 5 (A) Reconstructed tip profiles of four asymmetric pores (for details see Table 1). Radii at x = 0 are pore tip radii, rt. (B) FESEM images of three pore tips found in a multi-pore sample. The width of the images is 2 μm. | ||
| Pore | Stopping voltage, V | Conductance at point D, GD, nS | Base radius, R, nm | Tip radiusb, rt, nm | Cone tip radius, rc, nm |
|---|---|---|---|---|---|
| a This pore was etched at 19 °C. Therefore, values of VB and k corrected to this temperature were used in calculations. b The errors in determination of rt and rc values were ±8 and ±11%, respectively. For detailed error analysis see ESI. | |||||
| #1 | 0 | 2.6 | 180 | 3.4 | 1.9 |
| #2a | 0 | 2.2 | 249 | 2.4 | 1.4 |
| #3 | 0.5 | 7.0 | 324 | 5.6 | 3.1 |
| #4 | 1.0 | 6.2 | 367 | 7.1 | 2.3 |
The calculated radii of tips of the quasi conical pores were found to be equal to 1.9, 1.4, 3.1 and 2.3 nm (see the last column I Table 1). These values are systematically smaller than the tip radii rt resulted from the pore profile reconstruction. This fact is a direct consequence of the difference in “effective length” of the nanopore constriction over which the majority of the electrical resistance is focused.17,45a Pores with trumpet-shaped tips possess much longer effective length compared to conical ones and, therefore, have a larger constriction radius. Therefore, the radii calculated in the framework of the cone approximation are underestimated due to an error associated with the model used.
The above four experiments were performed under slightly different conditions. Sinusoidal voltage of 0.5 V was applied to pores #1 and #2 during the one-sided etching. In contrast, a stopping bias voltage of 0.5 V and 1 V was applied to pores #3 and #4, respectively. Regardless of electrical bias the tips of the forming pores deviate significantly from a strictly conical geometry. Because of large variations between individual pores our results did not show a clear relationship between the stopping voltage and the pore profile. Much larger statistics and, probably, higher voltages, are needed to make a clear conclusion on the effect of electrical bias on the tip shape.
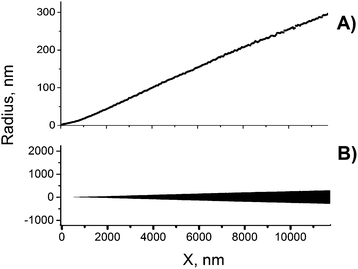
The full profiles of asymmetric pores possess a feature that has not been reported before but however, seems to be significant because it is repeatedly observed in our single-pore experiments. As seen in Fig. 4(A), there is an inflection region at pore radii of about 150–250 nm. This transition from concave to slightly convex shape (here we define concave function as increasing at an increasing rate) is difficult to see on replicas or cross-sections of pores with narrow cone angle. Similarly, this feature is not seen by the naked eye on the pore profile in true proportion in Fig. 4(B). However, a closer look at fractures of doubly-conical pores with a wider cone angle (see, for instance, ref. 45b) suggests that such deviation from strict cone geometry really exists. This inflection region is probably associated with the transition of etching from the halo to the bulk material. In fact, the etch rate at the border of the halo is slightly higher than the bulk etch rate. Hypothetically, this small difference in etch rates can be caused by mechanical strain that builds up due to cross-linking in the halo. The cross-linking should lead to compaction of the polymer molecules and a corresponding rarification in the immediate vicinity of the cross-linked area and, thus, to mechanical tension in the region between the halo and the undamaged polymer matrix outside the ion track.
3.2 Pore shape after breakthrough. General considerations
In the case where the pore is kept under asymmetric etching conditions for a longer time after breakthrough, the reconstruction procedure described in Section 2.1 is not applicable because the composition and concentration of the solution in the pore, especially in the tip region, inevitably changes. The alkali concentration field in the pore is not uniform any more. As a result, the pore profile changes not only in accordance with the spatial distribution of chain scissions and cross-linking events in the track but also depending on the local concentration of the etchant. If such a distorted pore is etched symmetrically and, thus, the uniform etchant concentration field within the channel is restored, the evolution of its geometry does not constitute the virtual movement of an object of fixed shape which we have described for the etching process at step II. This fact makes the use of eqn (1)–(4) impossible. Therefore, alternative methods should be employed in order to understand the evolution of a pore being etched from one side rather long after breakthrough while the other side stays in contact with the stopping solution. The asymmetric etching after breakthrough includes several processes that should be taken into account. First of all, the etchant components (sodium cations and hydroxide anions) diffuse through the pore tip into the stopping solution. Secondly, the components of the stopping solution – water, potassium cations, chlorine anions and formic acid molecules – diffuse through the tip into the pore and slow down the etching in this region. Consequently, the constriction at the pore tip is expected to be accentuated if asymmetric etching continues after breakthrough.45a In the following we experimentally confirm this hypothesis.3.3 Role of osmotic flow
If the electrolyte concentrations on the two sides of the asymmetrically etched foil are significantly different, there should be a gradient of the chemical potential of water across the foil and the osmotic pressures of the etching and stopping solutions are important parameters which should be considered. According to the van't Hoff equation47 the osmotic pressure difference ΔΠ is| ΔΠ = ΔckBT | (8) |
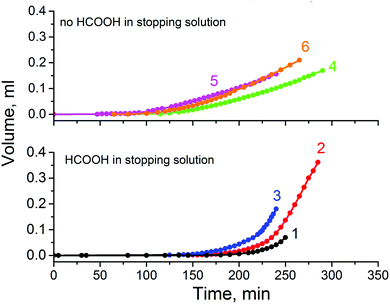
In etching experiments with single Au tracks we found that at a temperature of 22 °C the breakthrough events occur in the range between 110 and 200 min. The average breakthrough time in 15 repeated measurements was 162 min. Therefore we expected to register osmotic flow within this time interval. Fig. 6 shows the solution build-up in the capillary as a function of the etching time. The array of 1.4 × 10⁷ Au ion tracks show a well-pronounced osmotic flow that started at 150–170 min for stopping solutions containing formic acid. Assuming that all tracks were etched through by the time of 200 min, a flux Q = 1 × 10⁻¹² cm3 s−1 per single pore is deduced from curve 2 (Fig. 6), increasing to a value of 7 × 10⁻¹² cm3 s−1 by t = 250 min. This is clear evidence that among all diffusion-driven fluxes through the newborn pores, the transport of water into the strong alkali solution dominates.
Of course, the diffusion of OH− and Na+ ions into the stopping solution must also take place. K+ and Cl− ions and formic acid molecules diffuse in the opposite direction. However, all these fluxes are of minor importance compared to the osmotic flux of water. Obviously, the observed process can be categorized as osmotic flow through leaky porous membranes.47–49 Although the osmotic transport is originally a diffusion-driven process, the diffusive transfer and viscous flow are closely interconnected in real porous systems. Thus, as a simple approximation, we treat the observed mass transport in terms of pressure-driven viscous flow through a pore of conical shape. A modification of the Poiseuille formula for conical track-etched channels was suggested in ref. 50. The volume flux Q generated by a differential pressure ΔP across a conical tube is
 | (9) |
3.4 FESEM observation of pores etched under asymmetric conditions after breakthrough
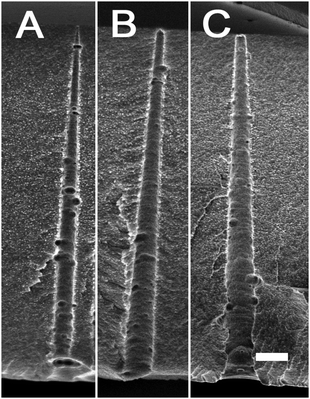
Asymmetric etching with monitoring of osmotic flow was stopped at different stages of the process, i.e. when the osmotic flux just started or reached a constant rate (see Fig. 6). The samples were rinsed, dried and examined using FESEM. Images of channel cross sections that correspond to different times of asymmetric etching after breakthrough, taba, are shown in Fig. 7. Image A represents a pore with a tip that has already reached the upper foil surface and acquired a bullet-like, though yet quite sharp, shape. Images B and C show pores after longer dwell times under asymmetric conditions. The pore tip gradually gets rounded with increasing taba. The conical part of the pores widens uniformly so that the double cone angle 2α yields 3.0–4.5°, with a slight tendency of increasing with increasing etching time. The value of 3° exactly corresponds to the track to bulk etch rate ratio VT/VB (VT = 75 nm min−1; VB = 2.0 nm min−1; VT/VB ≈ 38; α = arcsin(VB/VT)) and to the reconstructed pore profile shown in Fig. 4(B). Such evolution of the pore shape unambiguously indicates that the etchant concentration in the pore is almost constant along its length and dramatically drops down in a very short tip region. Therefore, the asymmetric etching of a track pore can be illustrated by the sketch shown in Fig. 8.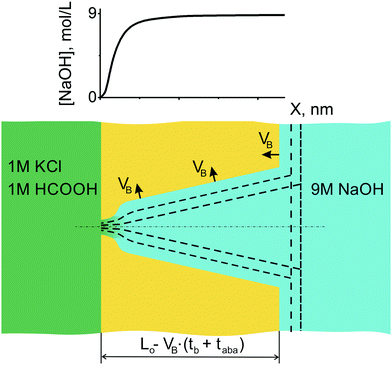 | ||
| Fig. 8 Asymmetric etching continues after breakthrough. Accentuation of pore tip increases with increasing etching time. The alkali concentration profile anticipated from the pore shape is shown on top. The sigmoidal shape of the concentration profile reflects the tip shape observed experimentally (Fig. 9(A and B)). | ||
3.5 Roles of formic acid and potassium chloride in stopping solution
In the absence of formic acid in the stopping solution the osmotic flow started markedly sooner, at 90–110 min, and occurred at a lower speed (see upper part of Fig. 6). Corresponding electrical measurements on single tracks showed shorter breakthrough times when only 1 M KCl at neutral pH was used as a stopping solution. The double cone angle 2α of fractured pores was found close to 2° (see ESI† for further details). Evidently, soaking the latent (i.e. unetched) track in an acidic agent (formic acid) significantly alters its etching rate.24b Indeed, the latent track core consists of carbon-enriched polymer debris with large free volume and with a high concentration of carboxylic groups. The carboxylic groups can be either ionized or protonated depending on pH, which has an influence on transport of ions and water into the track core.52,53 At neutral pH the negatively charged moieties ∼COO− may serve as active sites that provide the ion-hopping mechanism for electrolyte penetration. In contrast, at low pH the carboxylic groups are protonated which, in addition, makes the track core less hydrophilic and less permeable for water.In spite of faster etching along the track core, the development of osmotic flux in time occurs at a lower rate with a neutral stopping solution (see Fig. 6). At a glance, these observations appear to be inconsistent. We have conducted a thorough examination with FESEM to resolve the contradiction between the fast track etching and the weaker osmotic effect. Electron microscopy images of pore tips obtained with the use of neutral and acidic stopping solutions are shown in Fig. 9. The etching continued long after breakthrough so that the width of the pore channel at a depth of 300–500 nm is as large as 450–550 nm. However, the very tips of the pores in Fig. 9(A) and (C) are invisible because, firstly, the tip radii are very small and, secondly, the tips are plugged by nanoparticles of a precipitate. We can identify precipitate particles outside the pore tip in Fig. 9(A) and inside the tip in Fig. 9(C) (pointed by white arrows). Fig. 10 shows the gradual development of crystals at the pore entrances as asymmetric etching proceeds. X-ray element analysis has revealed that the crystals contain magnesium. All other detected chemical elements were the same as in the pure membrane (see ESI†).
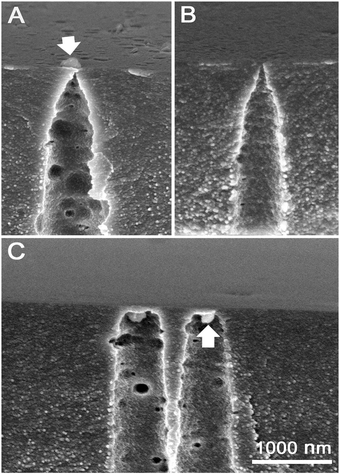 | ||
| Fig. 9 (A and B) Pore tips of asymmetric pores obtained using neutral stopping solution, 1 M KCl. (C) Pore tips obtained using acidic stopping solution, 1 M KCl/1 M HCOOH. The membranes shown correspond to curves 4 and 2 in Fig. 6 and were etched for 290 and 285 minutes, respectively. Arrows point to particles of precipitate that plug the pore tips. In the case of image B the precipitate was washed out using nitric acid. | ||
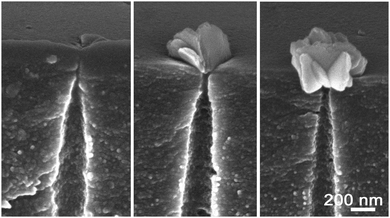 | ||
| Fig. 10 Accumulation of magnesium hydroxide precipitations in the pore lumens showing gradual development of “sand rose” morphology.54 Stopping solution: 1 M KCl, pH ≈ 6. | ||
To explain the formation of insoluble magnesium compounds at the pore entrance and on the membrane surface one has to take into account that osmosis is always accompanied by concentration polarization. The layer of the stopping solution adjacent to the pore entrance is depleted of water. As a result, the concentrations of all dissolved substances, including impurities, increase. The potassium chloride used in our experiments was of “molecular biology” grade. Obviously, it was not free of divalent cations such as Ca2+ and Mg2+. Therefore, the origin of the observed magnesium-containing crystals is most probably the following. Hydroxide ions diffuse through the pore tip to the stopping solution and react with osmotically pre-concentrated magnesium ions. The solubility product of magnesium hydroxide, [Mg2+][OH−]2, is very low (∼10−11). In contrast, calcium hydroxide is a soluble compound and therefore Ca2+ ions do not contribute to the precipitate formation. According to calculation, hydroxide ions of a concentration of ∼0.002 mol L−1 will induce Mg(OH)2 crystal nucleation if the magnesium concentration in the source reagent (KCl) is as small as ∼0.0001%. Thus, the solubility limit is readily reached and Mg(OH)2 precipitates in the form of platelets or “sand rose” nanocrystals (see Fig. 10), a typical morphology of this substance.54 Apart from the platelet-like particles, we observed also rod-like nanocrystals that can be identified as basic magnesium carbonates.55 Since carbonate ions are always present in alkaline solutions in contact with ambient air, the formation of basic magnesium carbonates seems very plausible. It should be noted that the precipitation may result in electrical current fluctuations and spikes when a bias voltage is applied across the pore.56 Thus, the addition of KCl, chosen to impart a certain standard specific conductivity to the stopping solution (which helps to electrically detect the formation of single pores12), plays a negative role because it provokes side chemical reactions in the narrowest region of the pore and interferes with etching and monitoring processes.
In the case where the stopping solution contains formic acid the precipitation process is suppressed, though not completely. The synthesis of nanocrystals is limited to the interior of the pore tips, as seen in Fig. 9(C), i.e. in the region of high pH. Outside the pore the solution is acidic and therefore prevents the formation of insoluble hydroxides and carbonates. Nevertheless, at long exposures the pH increases in the adjacent stopping solution layer and the crystal nucleation process were seen to occur at adequate contaminant concentrations (relevant images are not shown here).
Surprisingly, the plugging of the pore tips is not the reason for the slow osmotic flow from the 1 M KCl solution. This is evidenced from the osmotic flux measured with deionized water as a stopping solution. It is also markedly lower (curve 6 in Fig. 6) compared to that observed for the acidic stopping solutions. Consequently, the difference in flow rate must be due to another acid-related mechanism. We will return to this question in Section 3.6.
Observation of nanoparticles of precipitate in the pore tips raised several questions to be addressed in future experimental studies. It would be interesting to find out how fast the processes of crystal nucleation and growth are. If the crystals form within several minutes after breakthrough, the “conical” pores fabricated in a conventional manner may have magnesium hydroxide particles fixed inside or at the entrance of the tip. It is also important to understand if such nanoparticles can affect the I–V-characteristics of the pores. In particular, it needs to be clarified if the earlier observed phenomena such as spontaneous fluctuations and voltage gating13,20 can be caused by the nanoinclusions in the pore channels.
3.6 Diffusion–convection model
Solute transport governed by diffusion and convection, has been studied in the literature for the case of cylindrical capillaries.47–49 The transcapillary solute exchange has been described by the global convection–diffusion equation from which a dimensionless criterion λJv has been deduced, where λ depends on the pore permeability Pp and reflection coefficient σ, λ = (1 − σ)/Pp, and Jv is the volume flow (cm s−1).48 Here the term “volume” is used to distinguish convection mechanism from diffusion. Depending on the value of this criterion, either diffusion or volume flow dominates, and the concentration profile acquires different shapes. In the particular case of λJv = 0, the osmotic flow does not play any role and the solute concentration gradient along the pore is constant. In the case of asymmetric track-etched pores, our experiments clearly show that the alkali concentration gradient is essentially non-linear, namely the concentration is almost constant along the wide part of the pore and dramatically decreases in the pore tip region. This is the reason why the narrow trumpet-shaped (“quasi-conical”) pore is transformed into the wide conical pore with bullet-like tip as the asymmetric etching proceeds. Therefore, in order to explain the process of pore growth we have to apply the diffusion–convection model to the newborn “quasi-conical” pore.In contrast to cylindrical pores, the volume flow in asymmetric pores strongly depends on the local position x. Fig. 11(A) shows the cross-sectional area Sp(x) of pore #3 from Table 1 and the volume flow Jv as functions of x. The value of Jv(x) was calculated by dividing the osmotic flux Q = 10−12 cm3 s−1 by the cross-section area (i.e. it is assumed to be radially uniform). Depending on the position inside the asymmetric pore, Jv(x) changes by three orders of magnitude and, therefore, the balance between diffusional transport and convective transport of alkali is significantly different in different pore regions. In the pore lumen, where Jv reaches a value of ∼1 cm s−1, the convective transport is expected to dominate. Compared to convection and diffusion, the etching process at room temperature is quite slow, which allows us to use the stationary diffusion–convection equation for the asymmetric pore at a certain instant of time:
 | (10) |
![[thin space (1/6-em)]](https://www.rsc.org/images/entities/char_2009.gif) 676 nm, meaning that the radius changes along the pore as r + bx and, accordingly, Sp(x) = π(r + bx)2 with b = 0.0275. In spite of the apparent simplicity of eqn (10), its analytical solution is a very complicated function of the model's parameters. Instead, the expression for dc/dx is simple and can be used to interpret the main features of the pore evolution:
676 nm, meaning that the radius changes along the pore as r + bx and, accordingly, Sp(x) = π(r + bx)2 with b = 0.0275. In spite of the apparent simplicity of eqn (10), its analytical solution is a very complicated function of the model's parameters. Instead, the expression for dc/dx is simple and can be used to interpret the main features of the pore evolution: | (11) |
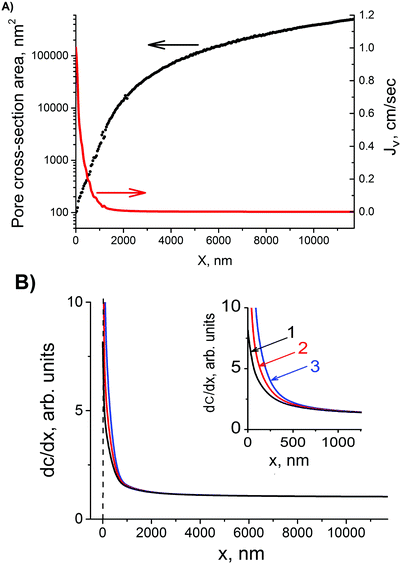 | ||
| Fig. 11 (A) Pore cross-section area and volume flow rate, Jv, as functions of coordinate x along the pore axis for pore #3 from Table 1. (B) profile of dc/dx inside the pore calculated using eqn (11). Curve 1: b = 0.015; curve 2: b = 0.020; curve 3: b = 0.0275. All other parameters are the same for all three curves: Q = 10−12 cm3 s−1, r = 3 nm and D = 10−5 cm2 s−1. | ||
Here A is a constant. The profiles of dc/dx shown in Fig. 11(B) are calculated for three pores having different cone angles. The b values of 0.015, 0.020 and 0.0275 are taken to model the channels with cone angle 2α of 1.7, 2.3 and 3.2°, respectively. All three curves are normalized to their values at x = L. Curve 3 can be considered as a simulation of alkali distribution in pore #3 from Table 1 under the simplifying assumption that the newborn pore is conical. The tip region, x < 500 nm, is characterized by a dramatic rise of alkali concentration with increasing x. In the wide part of the pore, 500 nm < x < 11![[thin space (1/6-em)]](https://www.rsc.org/images/entities/char_2009.gif) 676 nm, the alkali concentration changes only slightly along the pore axis. Thus, the short pore tip is practically free of etchant molecules and does not widen for a rather long time after breakthrough. This is a direct consequence of osmotically driven water flow into the pore. In contrast, the wide part of the pore continues to grow. This leads to further accentuation of the pore tip and redistribution of Jv along the pore. For a time taba as long as 50–100 min, the tip remains very narrow but its length gradually decreases, as seen in Fig. 7. As the pore region between x ≈ 500 nm and x = L widens radially, the relative contribution of the convective component becomes even larger locally in the tip, leading eventually to well-pronounced “bullet-like” pore ends. The pores of this shape are typical of multi-track samples etched under asymmetric conditions. Metal replicas confirming this pore configuration are presented, for instance, in ref. 58.
676 nm, the alkali concentration changes only slightly along the pore axis. Thus, the short pore tip is practically free of etchant molecules and does not widen for a rather long time after breakthrough. This is a direct consequence of osmotically driven water flow into the pore. In contrast, the wide part of the pore continues to grow. This leads to further accentuation of the pore tip and redistribution of Jv along the pore. For a time taba as long as 50–100 min, the tip remains very narrow but its length gradually decreases, as seen in Fig. 7. As the pore region between x ≈ 500 nm and x = L widens radially, the relative contribution of the convective component becomes even larger locally in the tip, leading eventually to well-pronounced “bullet-like” pore ends. The pores of this shape are typical of multi-track samples etched under asymmetric conditions. Metal replicas confirming this pore configuration are presented, for instance, in ref. 58.
Curves 1–3 in Fig. 11(B) demonstrate that the alkali concentration profile is very sensitive to the degree of conicity. In pores with a larger parameter b and, thus, with a larger cone angle, the alkali gradient is much steeper in the tip region which means that further pore evolution results in a configuration with a more accentuated, and eventually shorter, tip. As this is a flowrate-limiting pore section, the resulting channel has a lower hydraulic resistance. This may explain why the osmotic flux is lower with acid-free stopping solutions (1 M KCl or pure water).
To confirm the phenomenon of the “osmotic” conservation of the pore narrow region we applied FESEM to examine the sample fabricated using the system of 9 M NaOH–1 M HCOOH (curve 1 in Fig. 6). No KCl was added to prevent blocking of the pore entrances by nanoprecipitation. The sample surface was not coated with a conductive layer and the electron energy was as low as 500 eV. We observed faint dark spots, the surface density of which approximately coincided with the track density, i.e. ∼107 cm−2. Typical images are shown in Fig. 12. The average radius of the pores was not larger than 10 nm. The estimated time after breakthrough taba was ∼90 min yielding an upper limit of the radial etch rate for the tip of (10–3) nm/90 min ≈ 0.08 nm min−1. This value is ∼25 times smaller than the bulk etch rate and, obviously, reflects the reduction in the concentration of alkali in the pore lumen. A similar experiment with the system of 9 M NaOH–water (curve 6 in Fig. 6) showed that ∼160 minutes after the estimated breakthrough time the pores remained as small as 20–30 nm in radius. Therefore it should be pointed out that osmotic flow plays a decisive role in the conservation of the tip radius at a level of several nanometers after the etching and stopping solutions meet each other. Of course, the neutralization reaction also occurs but has a minor effect because alkali and acid are present in non-equivalent concentrations. This conclusion extends to the fabrication of asymmetric track-etched pores in polycarbonate59 and polyimide.60 Etching solutions were 70% 9 M NaOH + 30% CH3OH and 4.5 M NaOCl in these two cases, while stopping solutions contained only 1 mol L−1 of active agent. Therefore, complete neutralization was not possible but the difference in solute concentration was large enough to induce osmotic flow through the nanopores.
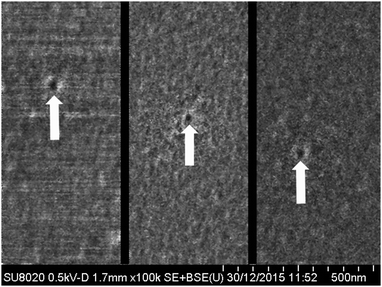 | ||
| Fig. 12 FESEM images taken from different local regions of a sample etched asymmetrically using 1 M HCOOH as stopping solution (curve 1 in Fig. 6). Etching time 250 min. The small dark spots (marked with arrows) are candidates of small pores at the pore-tip surface. | ||
3.7 Role of the bias voltage
It has been shown previously that the bias voltage has an influence on the pore formation.12,43 The most pronounced effect of the voltage applied across the membrane is the deformation of the wide part of the pore.43 Little is known about its influence on the geometrical parameters of the tip region. A detailed discussion of this topic is beyond the scope of this paper.3.8 Applicability of the cone approximation
The cone approximation is a common approach to calculating the tip radius from the electrical conductance using formula (7). Based on the results reported above we can estimate the breadth of applicability of this approach. For a newly-formed asymmetric pore, i.e. just after breakthrough, the cone approximation yields a significant, typically twofold, underestimation of the tip radius. This stems from the trumpet-like pore shape caused by the latent track structure. Of course, the use of formula (7) is attractive for its simplicity but the result may turn out to be far from reality. However, a correction can be made for the actual tip geometry to more reliably determine the nanopore characteristics.61Provided the pore is enlarged using additional symmetric etching, as it has been suggested in,19 the pore geometry approaches a cone. As soon as the track halo is removed, the channel acquires the shape of a cone (see Fig. 2(B)). Tracks of heavy ions, such as Au, Pb or U leave a vast halo so that the elongated tip of the pore disappears when the radius rt attains a value of 15–20 nm.
In the case where the pore is etched asymmetrically after breakthrough, its tip geometry rapidly changes. The cone geometry is a short transient phase after which the pore acquires a “bullet-like” shape. With increasing etching time this shape is getting more and more pronounced (see Fig. 9 and 10) and, inevitably, formula (7) results in a severe overestimation of the tip radius.
The knowledge of actual shape of asymmetrical pores produced by one-sided track etching should be taken into account in studies where parameters such as the electrical field, dwell time, and ionic selectivity critically depend on the pore constriction geometry. The two-step etching procedure suggested by us can help to improve experiments with quasi conical pores. After the first etching step the pore can be subject to various manipulations such as passage of molecules, measurements of rectification ratio, study of gating properties, and others. Upon completing the manipulations, the pore can be etched symmetrically including monitoring the conductance in AC mode (step II of the procedure). Its reconstructed geometry can be related to the properties measured after the first etching.
4 Conclusions
The evolution of track-etch pores in PET foils was analysed for asymmetric etching that is either stopped right after breakthrough or continued to obtain larger pores. To reconstruct the longitudinal profile of the pore channel, a two-step etching method is suggested. We show that the asymmetric pores at the moment of breakthrough are trumpet-like in shape. The deviation from a pure cone shape is well-pronounced in the tip region within a length of 1000–1500 nm. These findings confirm earlier predictions based on experiments with symmetric track etching.45 Our results also show that, during one-sided etching, contacting the opposite surface of the foil with a neutralizing solution before breakthrough has a certain effect on track etching. However, it does not alter the main features of the pore profile.The asymmetric pore with a trumpet-shaped tip is transformed into a conical channel if subject to additional etching under symmetric conditions. On the contrary, continuation of asymmetric etching after breakthrough results in a rapid transformation of the pore tip shape from trumpet-like to bullet-like, while the wide part of the pore remains conical. This dramatic change of the pore geometry is caused by the osmotic flow which has a great effect on the pore evolution. This factor has been completely overlooked since the method of asymmetric etching of ion tracks was originally published. The osmotically driven flow of water into the pore is responsible for the conservation of small dimensions of the pore tip long after the initial perforation. The osmotic flow effect is so strong that applying a stopping voltage or adding an acid to the neutralizing solution are not necessary in order to obtain highly asymmetric channels with nanometer-sized tips. We present a convection–diffusion model that explains semi-quantitatively the most important experimental findings concerning the evolution of the asymmetrically etched ion track.
In summary, it is evident that asymmetric track etching is established as a powerful method for the fabrication of nanopores with useful properties for versatile applications. Unravelling the basic mechanisms underlying the formation of asymmetric nanopores will help to better control the etching process and fabricate single and multiple nanochannels with pre-determined shape and dimensions. The measurement of osmotic flow can be considered as a useful complementary tool for elucidating the mechanisms governing the transformation of latent tracks into open pores.
Acknowledgements
The authors are grateful to O. A. Polezhaeva for assistance in experiments and to Yu. P. Apel for help with data processing. P. Yu. A. thanks V. Vutsadakis for helpful remarks and discussions.Notes and references
- R. Spohr, Ion Tracks and Mirotechnology, Principles and Applications, Springer Verlag, Braunschweig, 1990 Search PubMed.
- M. Toulemonde, C. Trautmann, E. Balanzat, K. Hjort and A. Weidinger, Nucl. Instrum. Methods Phys. Res., Sect. B, 2004, 216, 1–8 CrossRef CAS.
- R. Neumann, Nucl. Instrum. Methods Phys. Res., Sect. B, 2013, 314, 4 CrossRef CAS.
- R. L. Fleischer, P. B. Price and R. M. Walker, Nuclear Tracks in Solids, University of California Press, Berkeley, CA, 1975 Search PubMed.
- P. Apel, Radiat. Meas., 2001, 34, 559–566 CrossRef CAS.
- H. Hanot and E. Ferain, Nucl. Instrum. Methods Phys. Res., Sect. B, 2009, 267, 1019 CrossRef CAS.
- H. Bayley and C. R. Martin, Chem. Rev., 2000, 100, 2575 CrossRef CAS PubMed.
- P. Ramirez, M. Aguilella-Arzo, A. Alcaraz, J. Cervera and V. M. Aguilella, Cell Biochem. Biophys., 2006, 44, 287–312 CrossRef CAS PubMed.
- C. Dekker, Nat. Nanotechnol., 2007, 2, 209 CrossRef CAS PubMed.
- S. Howorka and Z. Siwy, Chem. Soc. Rev., 2009, 38, 2360 RSC.
- N. Modi, M. Winterhalter and U. Kleinkatoefer, Nanoscale, 2012, 4, 6166–6180 RSC.
- P. Y. Apel, Y. E. Korchev, Z. Siwy, R. Spohr and M. Yoshida, Nucl. Instrum. Methods Phys. Res., Sect. B, 2001, 184, 337 CrossRef CAS.
- Z. Siwy, Y. Gu, H. Spohr, D. Baur, A. Wolf-Reber, R. Spohr, P. Apel and Y. Korchev, Europhys. Lett., 2002, 60, 349 CrossRef CAS.
- A. Mara, Z. Siwy, C. Trautmann, J. Wan and F. Kamme, Nano Lett., 2004, 4, 497 CrossRef CAS.
- R. Spohr, Radiat. Meas., 2005, 40, 191 CrossRef CAS.
- Z. S. Siwy, M. R. Powell, A. Petrov, E. Kalman, C. Trautmann and R. S. Eisenberg, Nano Lett., 2006, 6, 1729 CrossRef CAS PubMed.
- Y. Choi, L. A. Baker, H. Hillebrenner and C. R. Martin, Phys. Chem. Chem. Phys., 2006, 8, 4976 RSC.
- C. C. Harrell, Y. Choi, L. P. Horne, L. A. Baker, Z. S. Siwy and C. R. Martin, Langmuir, 2006, 22, 10837 CrossRef CAS PubMed.
- J. E. Wharton, P. Jin, L. T. Sexton, L. P. Horne, S. A. Sherrill, W. K. Mino and C. R. Martin, Small, 2007, 2, 1424 CrossRef PubMed.
- M. Ali, V. Bayer, B. Schiedt, R. Neumann and W. Ensinger, Nanotechnology, 2008, 19, 485711 CrossRef PubMed.
- E. B. Kalman, O. Sudre, I. Vlassiouk and Z. S. Siwy, Anal. Bioanal. Chem., 2009, 394, 413 CrossRef CAS PubMed.
- M. Ali, P. Ramirez, S. Mafe, R. Neumann and W. Ensinger, ACS Nano, 2009, 3, 603 CrossRef CAS PubMed.
- L. T. Sexton, H. Mukaibo, P. Katira, H. Hess, S. A. Sherrill, L. P. Horne and C. R. Martin, J. Am. Chem. Soc., 2010, 132, 6755 CrossRef CAS PubMed.
- (a) D. Fink, A. Petrov, M. Mueller, T. Asmus, V. Hnatowicz, J. Vacik and J. Cervena, Surf. Coat. Technol., 2002, 158–159, 228–233 CrossRef CAS; (b) D. Fink, J. Vacik, V. Hnatowicz, G. N. Mufloz, L. Alfonta and I. Klinkovich, Radiat. Eff. Defects Solids, 2010, 165, 343 CrossRef CAS.
- J. Cervera, P. Ramirez, S. Mafe and P. Stroeve, Electrochim. Acta, 2011, 56, 4504 CrossRef CAS.
- H. Zhang, Y. Tian and L. Jiang, Chem. Commun., 2013, 49, 10048 RSC.
- J. Cervera, B. Schiedt, R. Neumann, S. Mafe and P. Ramirez, J. Chem. Phys., 2006, 124, 104706 CrossRef PubMed.
- X. Wang, J. Xue, L. Wang, W. Guo, W. Zhang, Y. Wang, Q. Liu, H. Ji and Q. Quyang, J. Phys. D: Appl. Phys., 2007, 40, 7077 CrossRef CAS.
- Q. Liu, Y. Wang, W. Guo, H. Ji, J. Xue and Q. Quyang, Phys. Rev. E: Stat., Nonlinear, Soft Matter Phys., 2007, 75, 051201 CrossRef PubMed.
- D. Constantin and Z. Siwy, Phys. Rev. E: Stat., Nonlinear, Soft Matter Phys., 2007, 76, 041202 CrossRef PubMed.
- I. Vlassiouk, S. Smirnov and Z. S. Siwy, ACS Nano, 2008, 2, 1589 CrossRef CAS PubMed.
- W. Guo, J. M. Xue, W. M. Zhang, X. Q. Zou and Y. G. Wang, Radiat. Meas., 2008, 43, S623 CrossRef CAS.
- I. D. Kosinska, I. Goychuk, M. Kostur, G. Schmid and P. Hänggi, Phys. Rev. E: Stat., Nonlinear, Soft Matter Phys., 2008, 77, 03113 CrossRef PubMed.
- P. Ramirez, P. Yu. Apel, J. Cervera and S. Mafe, Nanotechnology, 2008, 19, 315707 CrossRef PubMed.
- M. L. Kovarik, K. Zhou and S. C. Jacobson, J. Phys. Chem. B, 2009, 113, 15960 CrossRef CAS PubMed.
- I. Vlassiouk, T. R. Kozel and Z. S. Siwy, J. Am. Chem. Soc., 2009, 131, 8211 CrossRef CAS PubMed.
- H. Mukaibo, L. P. Horne, D. Park and C. R. Martin, Small, 2009, 5, 2474 CrossRef CAS PubMed.
- C. Kubeil and A. Bund, J. Phys. Chem. C, 2011, 115, 7866 CAS.
- P. Yu. Apel, I. V. Blonskaya, O. L. Orelovitch, P. Ramirez and B. A. Sartowska, Nanotechnology, 2011, 22, 175302 CrossRef PubMed.
- J.-F. Pietschman, M.-T. Wolfram, M. Burger, C. Trautmann, M. Pevarnik, V. Bayer and Z. Siwy, Phys. Chem. Chem. Phys., 2013, 15, 16917 RSC.
- I. Enculescu, Z. Siwy, D. Dobrev, C. Trautmann, M. E. Toimil Molares, R. Neumann, K. Hjort, L. Westerberg and R. Spohr, Appl. Phys. A: Mater. Sci. Process., 2003, 77, 751–755 CrossRef CAS.
- P. Scopece, L. A. Baker, P. Ugo and C. R. Martin, Nanotechnology, 2006, 17, 3951–3956 CrossRef CAS.
- C. C. Harrell, Z. S. Siwy and C. R. Martin, Small, 2006, 2, 194–198 CrossRef CAS PubMed.
- (a) P. Apel, R. Spohr, C. Trautmann and V. Vutsadakis, Radiat. Meas., 1999, 31, 51–56 CrossRef CAS; (b) P. Apel, I. V. Blonskaya, V. R. Oganessian, O. L. Orelovitch and C. Trautmann, Nucl. Instrum. Methods Phys. Res., Sect. B, 2001, 185, 216–221 CrossRef CAS.
- (a) P. Yu. Apel, I. V. Blonskaya, O. L. Orelovitch, B. A. Sartowska and R. Spohr, Nanotechnology, 2012, 23, 225503 CrossRef PubMed; (b) P. Y. Apel, P. Ramirez, I. V. Blonskaya, O. L. Orelovitch and B. A. Sartowska, Phys. Chem. Chem. Phys., 2014, 16, 15214–15223 RSC.
- J. F. Ziegler, J. P. Biersack and U. Littmark, The Stopping and Range of Ions in Solids, Pergamon, New York, 1985. Free SRIM software is available from the website, http://www.srim.org Search PubMed.
- C. Lee, C. Cottin-Bizonne, A.-L. Biance, P. Joseph, L. Bocquet and C. Ybert, Phys. Rev. Lett., 2014, 112, 244501 CrossRef CAS PubMed.
- S. R. Thomas and D. C. Mikulecky, Microvasc. Res., 1978, 15, 207–220 CrossRef CAS PubMed.
- A. E. Hill, Proc. R. Soc. London, Ser. B, 1989, 237, 369–377 CrossRef CAS.
- G. M. Gusinskii, E. B. Kremer, M. I. Kremer and B. V. Mchedlishvili, J. Eng. Phys., 1979, 37, 1493–1496 CrossRef.
- W. R. Bousfield and T. M. Lowry, Phil. Trans., 1905, A204, 253 CrossRef.
- V. V. Berezkin, A. N. Nechaev, S. V. Fomichev, B. V. Mchedlishvili and N. I. Zhitariuk, Colloid J., 1991, 53, 292–295 Search PubMed.
- Q. Wen, D. Yan, M. Wang, Y. Ling, P. Wang, P. Kluth, D. Schauris, C. Trautmann, P. Apel, W. Guo, G. Xiao, J. Liu, J. Xue and Y. Wang, Adv. Funct. Mater., 2016, 26, 5796–5803 CrossRef CAS.
- C. Henrist, J.-P. Mathieu, C. Vogels, A. Rulmont and R. Cloots, J. Cryst. Growth, 2003, 249, 321–330 CrossRef CAS.
- Z. Hao and F. Du, J. Phys. Chem. Solids, 2009, 70, 401–404 CrossRef CAS.
- G. Muñoz Hernandez, S. A. Cruz, R. Quintero, H. García Arellano, D. Fink, L. Alfonta, Y. Mandabi, A. Kiv and J. Vacik, Radiat. Eff. Defects Solids, 2013, 168, 675–695 CrossRef.
- J. D'Ans and E. Lax, Taschenbuch für Chemiker und Physiker, Springer-Verlag, Berlin Heidelberg, 1943, p. S.1115 Search PubMed.
- G. Perez-Mitta, L. Burr, J. S. Tuninetti, C. Trautmann, M. E. Toimil-Molares and O. Azzaroni, Nanoscale, 2016, 8, 1470–1478 RSC.
- N. Chtanko, M. E. Toimil Molares, T. Cornelius, D. Dobrev and R. Neumann, J. Phys. Chem. B, 2004, 108, 9950–9954 CrossRef CAS.
- Z. Siwy, D. Dobrev, R. Neumann, C. Trautmann and K. Voss, Appl. Phys. A: Mater. Sci. Process., 2003, 76, 781–785 CrossRef CAS.
- S. Nasir, P. Ramirez, M. Ali, I. Ahmed, L. Fruk, S. Mafe and W. Ensinger, J. Chem. Phys., 2013, 138, 034709 CrossRef PubMed.
Footnote |
| † Electronic supplementary information (ESI) available. See DOI: 10.1039/c6cp05465j |
| This journal is © the Owner Societies 2016 |

