Pseudocontact shifts from mobile spin labels†
Received
5th August 2016
, Accepted 23rd August 2016
First published on 19th September 2016
Abstract
This paper presents a detailed analysis of the pseudocontact shift (PCS) field induced by a mobile spin label that is viewed as a probability density distribution with an associated effective magnetic susceptibility anisotropy. It is demonstrated that non-spherically symmetric density can lead to significant deviations from the commonly used point dipole approximation for the PCS. Analytical and numerical solutions are presented for the general partial differential equation that describes the non-point case. It is also demonstrated that it is possible, with some reasonable approximations, to reconstruct paramagnetic centre probability distributions from the experimental PCS data.
1. Introduction
Pseudocontact shift (PCS) is an additional contribution to the nuclear chemical shift caused by the presence of a paramagnetic centre in close proximity to the nucleus in question.1,2 PCS is very well researched and is widely used as a source of structural restraints for paramagnetic metalloproteins.3–7 Even when a protein is not naturally paramagnetic, the commonly occurring calcium, magnesium and zinc binding sites would usually coordinate a lanthanide well.8 In combination with artificially introduced lanthanide-containing tags, PCS is also used to determine relative orientations of protein domains.9 In magnetic resonance imaging it is useful as a reporter for local pH and oxidation potential.10,11
General equations describing chemical shielding, obtained by an assiduously systematic application of perturbation theory, are due to Ramsey.12,13 The first paper dealing with a point dipole approximation for chemical shift was published by McConnell14 in 1957 – he noted that shielding by sufficiently distant electrons could be expressed via an effective magnetic susceptibility tensor; for paramagnetic molecules this tensor is a function of the spin Hamiltonian parameters of the paramagnetic centre.15 Analytical treatments for specific classes of d- and f-transition metal complexes using ligand field theory have been reported by Bleaney,16 Golding,17 and Stiles.18–21
Modern quantum chemistry defines the paramagnetic shift as the Frobenius inner product between the nuclear hyperfine coupling tensor and the magnetic susceptibility tensor.22,23 Both parameters are difficult to compute because they have contributions from spin–orbit coupling and often require non-perturbative treatment of relativistic effects within multi-configurational ab initio methods,24,25 as well as conformational averaging. Accurate quantum chemical calculations are therefore limited to a few dozen atoms.
Structural biologists couldn't care less – most nuclei in macromolecules are far enough away from the paramagnetic centre for McConnell's approximation to be accurate2,26 and the resulting formula for the pseudocontact shift produced by a point source with a given magnetic susceptibility anisotropy has been of great service to protein structure and dynamics research over the last 30 years.8,27 Excellent software packages exist that make PCS analysis in proteins and nucleic acids straightforward and informative.5,28
There remains one important unsolved problem: pseudocontact shift prediction and analysis in large systems that feature fast conformational mobility of the paramagnetic centre. For such systems the point dipole approximation is no longer valid at short distances, and quantum chemical calculations are prohibitively expensive. For this reason, PCS measurements in close proximity to the tag are often excluded from the analysis because they are not expected to fit the point dipole formula.29
In this paper, we introduce an analytical approach based on the recently published partial differential equation for PCS30 that views the paramagnetic centre as a probability density distribution in three dimensions. This approach clarifies the key features of that density that affect PCS. It may also be used to recover the distribution itself from the experimental PCS data.
2. Pseudocontact shift from a point paramagnetic centre
The point source formula for PCS is best derived using a classical physics argument. Placed in an external magnetic field B0, a paramagnetic centre would acquire the following magnetic dipole moment:where μ0 is the vacuum permeability and χ is the magnetic susceptibility tensor.26 This linear response assumption is valid for an ensemble of non-interacting paramagnetic centres when |μTe·B0| ≪ kT – true for most metal–organic systems at room temperature. For a point centre, the induced dipole creates the following magnetic field at the relative position r:| |  | (2) |
where the dipolar matrix is:| | 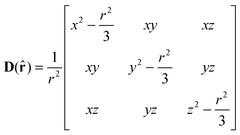 | (3) |
It is easy to demonstrate that the dipolar matrix only depends on the direction of the position vector ![[r with combining circumflex]](https://www.rsc.org/images/entities/b_char_0072_0302.gif) = {θ,φ} and does not depend on its length r = |r|. This provides a clean separation of coordinates that will be useful below.
= {θ,φ} and does not depend on its length r = |r|. This provides a clean separation of coordinates that will be useful below.
The change in the energy of a nuclear magnetic moment μn produced by placing it at the position r relative to the paramagnetic centre would be
The associated chemical shift tensor is the second derivative of Δ
E with respect to
μn and
B0:
12,31| |  | (5) |
The isotropic average of this tensor is the familiar point dipole expression for the pseudocontact shift:
14,26| |  | (6) |
that may also be written
via second-rank spherical harmonics:
| |  | (7) |
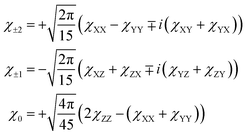
where
χm are the irreducible spherical components of
χ:
| |  | (8) |
It is important to note that the isotropic part and the first spherical rank component of the magnetic susceptibility tensor do not enter the equation for PCS. The five irreducible spherical tensor parameters in
eqn (8) may also be expressed as axiality and rhombicity, along with the three parameters (
e.g. Euler angles) specifying the orientation of the principal axis frame.
3. Pseudocontact shift from a distributed paramagnetic centre
A less well explored situation is when the paramagnetic centre is distributed with some probability density ρ(re) within the molecular structure. In such a situation, the magnetic susceptibility tensor would also in general be position-dependent. The integration of the point PCS expression in eqn (5) over the probability density produces the following expression for the dipolar shift tensor at position r:| |  | (9) |
This integral is a convolution of the dipolar matrix D divided by the cube of the distance with the product of susceptibility tensor and probability density:| |  | (10) |
The simplest way to proceed is to use the Fourier transform because convolution is equivalent to multiplication in the k-space, and the Fourier transform of the dipolar matrix is very simple:| |  | (11) |
where ![[k with combining circumflex]](https://www.rsc.org/images/entities/b_char_006b_0302.gif) is the angular part of the k-space vector k. Another useful property of the dipolar matrix is that the inverse Fourier transform of its product with a function in k-space can be expressed as an action of the differential operator in real space:
is the angular part of the k-space vector k. Another useful property of the dipolar matrix is that the inverse Fourier transform of its product with a function in k-space can be expressed as an action of the differential operator in real space:| | σ(r) = −FT−[D(![[k with combining circumflex]](https://www.rsc.org/images/entities/b_char_006b_0302.gif) )ĝ(k)] = −Sg(r) )ĝ(k)] = −Sg(r) | (12) |
where ĝ(k) is the Fourier transform of g(r) = χ(r)ρ(r) and the differential operator S has the following form:| | 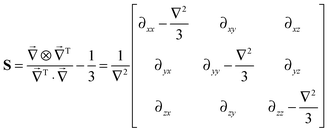 | (13) |
This is a reciprocal equation to eqn (3) – multiplication by a vector in Fourier space is equivalent to taking a gradient in real space and division by r2 in real space is equivalent to the inverse Laplacian in k-space.
In the case where both the probability density and the magnetic susceptibility tensor are position-dependent, this operator acts on their product and the following general expression is obtained for the matrix elements of the paramagnetic shift tensor:
| |  | (14) |
The second term on the right hand side effectively subtracts the Fermi contact part of the full paramagnetic shift, ensuring that PCS does not depend on Tr(
χ) in the same way as it happens in the point model.
Eqn (14) simplifies significantly under the assumption that the susceptibility tensor is the same at all locations. After the isotropic average is taken, the result is:
| |  | (15) |
In the Fourier space this equation can be written as
| |  | (16) |
where
![[small rho, Greek, circumflex]](https://www.rsc.org/images/entities/i_char_e0b7.gif)
(
k) is the Fourier transform of
ρ(
r) and
![[small sigma, Greek, circumflex]](https://www.rsc.org/images/entities/i_char_e111.gif)
(
k) is the Fourier transform of
σ(
r).
In the derivation presented above, ρ(r) is the statistical probability density of the paramagnetic centre, but one can make an approximate parallel here with the quantum mechanical spin density. The dipolar part of the hyperfine coupling at the nuclear position r for a given spin density ρspin(re) is
| |  | (17) |
and the PCS computed
ab initio leads to the same equation but with the spin density
| |  | (18) |
meaning that the dipolar hyperfine coupling tensor field, viewed as an integral over the spin density, can also be expressed using the differential operator from
eqn (13):
| | | Adip(r) = −ℏμ0γeγnSρspin(r). | (19) |
It must be noted that
eqn (18) only accounts for the dipolar part of the hyperfine coupling and does not include the orbital contribution, which is important in the immediate vicinity of heavy ions.
32,33
4. Analytical solution to the direct problem
The “direct” problem will be defined here as the task of calculating the PCS from a given magnetic susceptibility tensor and a given probability distribution of the paramagnetic centre at the specified nuclear coordinates. The general case with a position-dependent magnetic susceptibility tensor is described by eqn (14). It is clear from the form of eqn (14) that, in order to disentangle the effects of the two spatial functions (density and susceptibility), we need to know a priori at least one of them. Below we analyse the special case where the magnetic susceptibility tensor is the same at every point of the probability density in eqn (15). This approximation is reasonable for modelling the mobility of lanthanide tags; this was recently demonstrated by Shishmarev and Otting for the “two-hinged” approximation, where the orientation of the susceptibility tensor is the same for each rotamer.29
4.1 General solution
The most straightforward way to solve eqn (15) analytically is to expand the probability density in spherical harmonics:| |  | (20) |
where αml(r) are radial functions serving as expansion coefficients in this angular function series:| |  | (21) |
For a spherically isotropic probability density distribution, the sum in eqn (20) only has one term with l = 0 and m = 0; for a spherically anisotropic density, higher rank terms would also be present.
The Fourier transform of the density in eqn (20) leaves the angular part the same but the radial part is integrated with spherical Bessel functions of the first kind:
| |  | (22) |
We shall substitute this expression into
eqn (16) and expand the products of spherical harmonics using Clebsch–Gordan coefficients. The result has three terms when
l ≥ 2 and two when
l < 2:
| |  | (23) |
With this substitution in place,
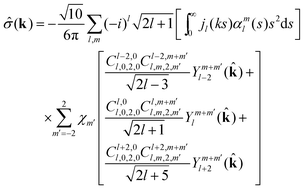
eqn (16) acquires the following form:
| |  | (24) |
To obtain the final answer, we must take the inverse Fourier transform of
eqn (24). The spherical harmonics again remain the same, and the radial part is integrated with spherical Bessel functions. The double integrals that make an appearance are all straightforward. Changing the order of integration and integrating the product of two spherical Bessel functions with respect to
k yields:
| |  | (25) |
| |  | (26) |
| |  | (27) |
Taking everything together we obtain the general analytical solution for
eqn (15):
| |  | (28) |
There are three physically different contributions associated with the three integrals of the radial probability density functions in
eqn (25)–(27). The first one corresponds to the integral of the density weighted with a monotonically decreasing function over the region outside the sphere of radius
r:
| |  | (29) |
For any nucleus positioned outside the bounding sphere of the paramagnetic centre probability density this contribution is zero. The second contribution is proportional to the probability density at the nucleus itself:
| |  | (30) |
We are in practice unlikely to be able to measure chemical shifts of the nuclei that are directly underneath the spin density due to their fast relaxation. We are thus left with the third and the most important contribution that is associated with the part of the density that is inside the sphere of radius
r:
| |  | (31) |
If we assume that there is no paramagnetic centre density outside that sphere, this would allow us to extend the upper integration limit to infinity and the integrals then correspond to the multipole moments of the probability density of the paramagnetic centre:
| |  | (32) |
A schematic diagram of the entire argument is given in
Fig. 1. Outside the bounding sphere, the final expression for the PCS is:
| |  | (33) |
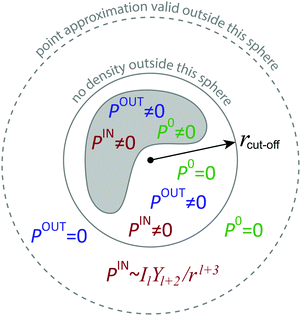 |
| | Fig. 1 A schematic representation of the paramagnetic centre probability density (grey shaded area) and regions where different terms in eqn (28) contribute to the resulting pseudocontact shift. Outside the bounding sphere (grey solid line) only PIN is non-zero; inside the bounding sphere an additional term POUT becomes important; P0 contributes only inside the density. At a sufficient distance from the bounding sphere (grey dashed line) the point paramagnetic centre approximation becomes valid. | |
This solution tells us that the PCS is sensitive to the multipole moments of the paramagnetic centre probability density. In the case of isotropic distribution, the PCS is the same as from the point source – this follows from eqn (33) when we put l to zero; it simplifies into eqn (7). Therefore, only the anisotropy of the density makes a difference in the PCS compared to the point source. We shall therefore proceed to explore some simple anisotropic probability densities.
A more detailed derivation of eqn (28) and (33) is provided in the ESI.†
4.2 PCS from a Gaussian paramagnetic centre distribution
This section contains an analysis of the consequences of simple deviations from the point paramagnetic centre approximation. To get a quantitative idea about how far the point dipole approximation can in practice be stretched, we shall consider a family of Gaussian paramagnetic centre distributions.
It follows from the treatment above that the PCS field outside any isotropic paramagnetic centre distribution is identical to the PCS field generated by a point centre. The difference from the point PCS appears only inside the density. For example, in the case of an isotropic Gaussian, where the sum in eqn (20) has only one element with l = 0 and m = 0, we have
| |  | (34) |
and the exact PCS is:
| |  | (35) |
where
a is the standard deviation of the Gaussian.
Fig. 2 demonstrates that a significant difference between the point and the isotropic Gaussian case appears only for
r < 3
a, which is not particularly interesting or dangerous because nuclei at such short distances from the paramagnetic centre are not normally visible in PCS experiments due to their rapid transverse relaxation.
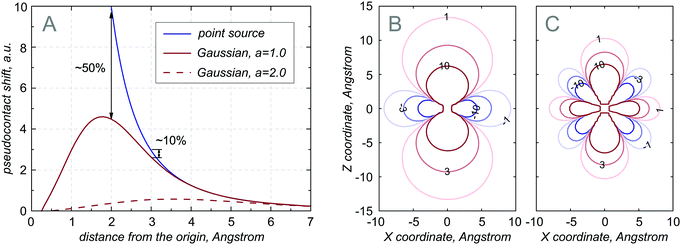 |
| | Fig. 2 (A) Amplitude of the radial part of the pseudocontact shift field as a function of distance from a point source (blue line) and from isotropic Gaussian sources with standard deviations of 1 Å (solid red line) and 2 Å (dashed red line). (B and C) PCS isolines in ppm from a prolate Gaussian source with a = 1 Å, c = 3 Å and χ = diag([−0.01, −0.02, 0.03]) Å3. The Z axis of the Gaussian is parallel to the Z axis of the susceptibility tensor eigenframe. The contribution to the PCS from the isotropic part of the density is on the left and the contribution arising from the anisotropic part is on the right. | |
A rather more worrying situation emerges when we consider a realistically anisotropic Gaussian distribution of the paramagnetic centre:
| |  | (36) |
The case with
a >
c corresponds to an oblate ellipsoid and the case with
a <
c to a prolate one. The anisotropy results in the emergence of the next multipole in
eqn (32):
| |  | (37) |
with the amplitude that depends on the difference in the squares of axial and equatorial sizes of the Gaussian. The resulting correction to the PCS
| |  | (38) |
involves fourth rank spherical harmonics and the fifth power of the distance. This is illustrated graphically in
Fig. 2 – it is clear that the correction to the point dipole solution is larger than 1 ppm up to 10 Å away from the spin label location.
The magnitudes and the asymptotic behaviour of the three contributions to the PCS in eqn (28) can be summarised by the following rules:
(1) For any nucleus located outside the sphere that is three times the radius of the bounding sphere of the paramagnetic centre probability density, the point paramagnetic centre approximation is valid.
(2) For any nucleus located in the immediate vicinity of the bounding sphere, extra multipoles would appear in the PCS, and eqn (33) must be used.
(3) For any nucleus located inside the bounding sphere, no simplifications are available, and the full analytical solution in eqn (28) must be used.
5. Analytical solution to the inverse problem
Eqn (33) is linear with respect to the components of the susceptibility tensor and the multipole moments of the probability density. Both sets of parameters are therefore easy to extract by fitting a sufficiently large dataset comprising nuclear coordinates and pseudocontact shifts. However, because experimental PCS measurements inside the bounding sphere of the paramagnetic centre density are not usually realistic, only the multipole moments (rather than the density itself) may be extracted in a well-defined way.
An illustration for 300 nuclei randomly placed around a lump of paramagnetic centre probability density is given in Fig. 3: the density was formed by four isotropic Gaussians with a standard deviation of 0.5 Å placed randomly within a 3 × 3 × 3 Å cube; nuclei were scattered within a 1 Å thick spherical layer at varying distances from the origin; the axiality and the rhombicity of the susceptibility tensor were chosen randomly from the typical range reported in the literature:34χax = −0.45 Å3 and χrh = −0.1 Å3. PCS amplitudes in this system range from ±90 ppm (at 5 Å distance) to ±1 ppm (at 20 Å distance).
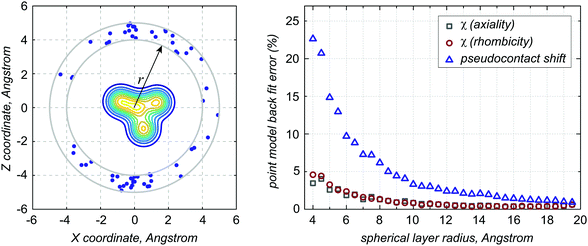 |
| | Fig. 3 Left panel: a schematic of the model system used to analyse the behaviour of the multipole terms in eqn (33) – the 2D slice in the XZ plane shows the contour lines of the paramagnetic centre distribution formed by four isotropic Gaussians with a standard deviation of 0.5 Å scattered randomly within a 3 × 3 × 3 Å cube; 300 nuclei (blue dots) are scattered randomly within a 1 Å layer at varying distances from the origin. Right panel: point model fractional back fit error in the pseudocontact shifts and the susceptibility tensor as a function of the radius of the spherical layer in which the nuclei are scattered. | |
Pseudocontact shifts in this model system were calculated exactly and then an attempt was made to back-fit eqn (33) truncated at different spherical ranks. The results were averaged over 50 instances of random nuclear position sets. As expected, the point model does not perform well below 10 Å from the bounding sphere (Fig. 3, right panel). Still, even though the PCS values are badly reproduced, the susceptibility tensor is quite resilient – even at the distance of 4 Å it is recovered to within ∼5% accuracy.
It is clear from Fig. 3 that, at distances comparable to the size of the paramagnetic centre probability distribution, the point model breaks down and further terms are required in eqn (33). Their beneficial effect is illustrated in Fig. 4 – adding terms of higher spherical rank to the expansion dramatically reduces the PCS back-fit error in the vicinity of the bounding sphere.
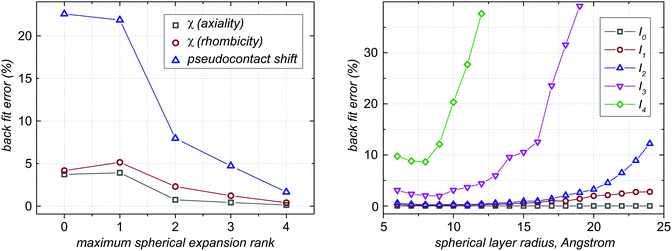 |
| | Fig. 4 Left panel: spherical rank dependence of the fractional back fit error produced by eqn (33) in the case when the nuclei are scattered in the spherical layer between 4 Å and 5 Å away from the origin (a schematic is given in Fig. 3). Right panel: fractional back fit error in the multipole moments of the paramagnetic centre probability density distribution in eqn (33) as a function of the radius of the spherical layer containing the nuclei (a schematic is given in Fig. 3). | |
Due to the steep distance dependence and the wobbly angle dependence of the higher multipole terms in eqn (33), the accuracy with which these terms may be extracted also falls steeply as the nuclei are moved further away from the bounding sphere of the paramagnetic centre probability density. This is illustrated in Fig. 4 – it is clear that multipole moments of spherical rank higher than 4 cannot be reliably extracted no matter how close the nuclei are to the bounding sphere. We would not therefore recommend taking eqn (33) beyond the fourth spherical rank.
6. Numerical solution to the direct problem
If the probability density of the paramagnetic centre is discretised on a finite three-dimensional grid, two general numerical avenues become available for the solution of eqn (15) – the finite-difference method and the Fourier transform method. The latter has the advantage of being fast, but the disadvantage of requiring periodic boundary conditions. This section explores both methods and comments on their relative merits.
6.1 Finite difference methods
A general algorithm for the generation of elementary finite difference operators of a given derivative and accuracy order on a given finite grid has been published by Fornberg.35 For a rectangular grid with N points in the X direction, M points in the Y direction and K points in the Z direction, finite difference matrix representations of the relevant derivative operators acting on the vectorisation of the density cube are:| |  | (39) |
and similarly for the other first and second derivatives. In these expressions, D(k)N is a matrix representation of the k-th derivative operator on a grid with N points, and 1M is a unit matrix of dimension M. The dimension of the matrices in eqn (39) is NMK. For a typical grid with 256 points in each dimension this is a large number, but because finite difference operators are local, the matrices produced by eqn (39) are very sparse.
The matrices required for the solution of eqn (15) are  and
and  . In terms of these matrices, the solution may be written as
where
ρ is the vectorization of the probability density cube on the chosen grid and
σ is the vectorisation of the pseudocontact shift field on the same grid; here and below we take only the traceless part of the
χ tensor. The final step is to project out the PCS values on the nuclei, for which the interpolation matrix
PN, also published by Fornberg in the same paper,
35 may be used. The final expression is
where the action by the very sparse inverse Laplacian matrix on the
Kρ vector is best computed using an iterative solver, such as GMRES.
36 Here and below the
L−1 symbol should be understood in that sense – the inverse Laplacian is never computed explicitly.
This method is very easy to set up – see, for example, the kpcs.m function supplied with Spinach library.37 Its downside is unfavourable scaling: the dimension of the finite difference matrices involved is KMN and the scaling of sparse solvers is approximately quadratic in the matrix dimension, meaning that the numerical complexity of this method scales approximately as the sixth power of the grid size. On a contemporary computer, a solution for a 256 × 256 × 256 point grid takes about an hour.
6.2 Fourier transform methods
An alternative method for solving eqn (15) takes advantage of the k-space expression in eqn (16), where the Fourier transform can be taken numerically using the fast Fourier transform (FFT) algorithm.38 Using the same interpolation operator as in eqn (41), we get| |  | (42) |
where χ stands for the traceless part of the magnetic susceptibility tensor. This method is about the same as the finite difference method in terms of the implementation complexity, but it is much faster – the complexity scaling of the three-dimensional fast Fourier transform is NMK![[thin space (1/6-em)]](https://www.rsc.org/images/entities/char_2009.gif) log(N)log(M)log(K), which is close to cubic scaling with respect to the grid size. This takes the simulation time into the region of seconds. This method is particularly fast on modern computing hardware because fast Fourier transform routines are available for GPGPU coprocessor cards (NVidia Tesla K40 cards were used in this work). The performance gain is shown in the left panel of Fig. 5.
log(N)log(M)log(K), which is close to cubic scaling with respect to the grid size. This takes the simulation time into the region of seconds. This method is particularly fast on modern computing hardware because fast Fourier transform routines are available for GPGPU coprocessor cards (NVidia Tesla K40 cards were used in this work). The performance gain is shown in the left panel of Fig. 5.
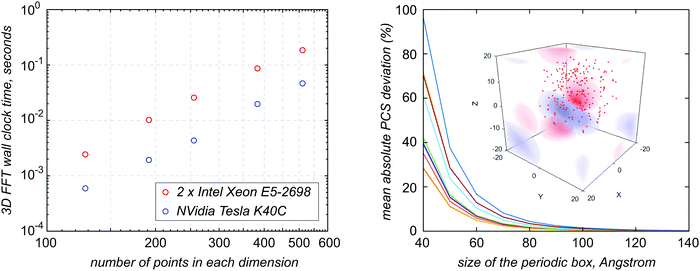 |
| | Fig. 5 Left panel: 3D FFT wall clock time as a function of the grid size for the calculation performed on the CPU vs. a dedicated coprocessor card. Right panel: PCS error due to the periodic boundary conditions in the FFT method as a function of the periodic box size. The nuclei (red points in the inset) are placed randomly in the 20 Å box in a positive octant; the paramagnetic centre has an isotropic Gaussian distribution centred at [−10, −10, −10] Å with a standard deviation of 1.0 Å. | |
The only significant problem with the FFT method is the periodic boundary condition – care must be taken to ensure that the images do not contribute significantly to the solution. Thankfully, the PCS decays cubically with distance; it is sufficient for the distance from the paramagnetic centre to the cube boundary and the distance from the nucleus to the cube boundary to be about three times larger than the distance from the paramagnetic centre to the nucleus – a numerical example is given in Fig. 5.
7. Numerical solution to the inverse problem
The “inverse problem” refers to the task of reconstructing the paramagnetic centre probability density from the experimental values of pseudocontact shifts and atomic coordinates. The task may be formulated as finding the probability density ρ(r) that minimises the following functional:| | | Ω[ρ(r)] = E[ρ(r)] + T[ρ(r)], | (43) |
where the least squares error is| | | E[ρ(r)] = ∥PNL−1Kρ(r) − σexpt∥2 | (44) |
and the standard Tikhonov regularisation term emphasizing smooth solutions is39where λ is a user-specified regularisation parameter. Regularisation is only needed when the inverse problem is ill-posed, i.e. the number of points in the probability density grid exceeds the number of experimental PCS points and/or all experimental points are outside the bounding sphere of the density. In that case the recovered density is only an approximation that agrees with the experimental data and has the required smoothness at the same time – this point is discussed further in Section 8.
7.1 Finite difference method
In order to proceed with minimising Ω[ρ(r)] with respect to ρ(r), the state-of-the-art Newton–Raphson minimisers require analytical expressions for their first and second variation.40 In a matrix representation on a discrete grid, these variations become the gradient vector and the Hessian matrix. The following vector relations are useful as a starting point.| |  | (46) |
If we use ρ to denote the vectorised form of a discrete representation of ρ(r) on a finite three-dimensional grid, the expressions for the gradient and the Hessian of the least squares error part of eqn (43) are:| | 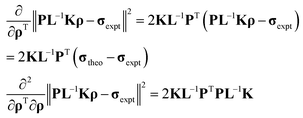 | (47) |
where advantage was taken of the fact that L and K are symmetric matrices and that σtheo = PL−1Kρ would normally already be computed and stored in memory by the time the derivatives are requested. Although the Hessian in eqn (47) is formally a matrix of a very large dimension, in practice only the result of its multiplication by a vector is required by the modern Newton–Raphson optimisers because they employ iterative sparse linear solvers for the inverse-Hessian-times-gradient operation.41,42
Similarly, the gradient and the Hessian for the Tikhonov regularisation term are:
| |  | (48) |
It is in practice unnecessary to consider every point of the grid to be a variable. The location of the paramagnetic centre is usually known approximately, and it is sufficient to only consider the points in the immediate vicinity – typically a 20 × 20 × 20 Å cube around the expected location.
7.2 Fourier transform method
About a factor of a hundred in performance may be gained (at the cost of worrying about the periodic boundary as described in Section 6.2) by using the Fourier solution in eqn (42). The overall error functional is still the same as in eqn (43), but the terms for the least squares error and the Tikhonov regularisation now involve three-dimensional fast Fourier transforms:| | E[ρ(r)] = ∥σtheo − σexpt∥2, T[ρ(r)] = λ![[thin space (1/6-em)]](https://www.rsc.org/images/entities/char_2009.gif) Re[FFT−{k·kTFFT+{ρ(r)}}]2 Re[FFT−{k·kTFFT+{ρ(r)}}]2 | (49) |
The first variation and the action by the second variation of E[ρ(r)] on a probe function η(r) are:| |  | (50) |
The corresponding variations for the Tikhonov regularisation functional are:| |  | (51) |
A numerical technicality in eqn (49) and (50) concerns the behaviour of the kT·χ·k/kT·k term around the origin of the k-space. It is easy to demonstrate that the limit value| |  | (52) |
corresponds to the integral of the solution in the real space. In the case of the pseudocontact shift this integral is known to be zero; this resolves the ambiguity.
7.3 Regularisation parameters
The standard way of choosing the Tikhonov regularisation parameter is the L-curve method:43,44 the error functional minimisation is repeated with different values of λ and the value is picked that corresponds to the maximum curvature κ(λ) of the following curve| |  | (53) |
In practice, a discrete point set {Eλk,Tλk} for different regularisation parameter values λk is interpolated by a fifth order spline and then differentiated numerically. The standard third order spline is not sufficient here because second derivatives are involved in the definition of the curvature that later needs to be differentiated again to find a maximum. The derivatives of the spline are fed into the expression for the curvature and the maximum is found with respect to λ using standard optimisation techniques.
8. Probability density reconstruction examples
Paramagnetic centre probability density reconstruction and its interpretation for real-life paramagnetic protein systems is a very large block of work that has been submitted for publication as a separate paper. This paper deals with the technical side of the matter; here we shall therefore only look at two basic example cases and make some general cautionary comments.
An example, shown in Fig. 6, deals with the paramagnetic centre density distribution in the well characterized calbindin D9K in which one or both of the two calcium ions have been replaced by a thulium ion.45 Detailed coordinate and PCS data for this protein are available in the ESI of the paper by the Florence group.34 The point paramagnetic centre model produces a rather unsatisfactory fit in the vicinity of the metal (Fig. 6, right panel). A reasonable explanation (proposed to the authors by Gottfried Otting and Thomas Huber) would be that fast exchange between metal binding sites could be present. We can now confirm that there is indeed an elongated distribution in the metal position (Fig. 6, left panel).
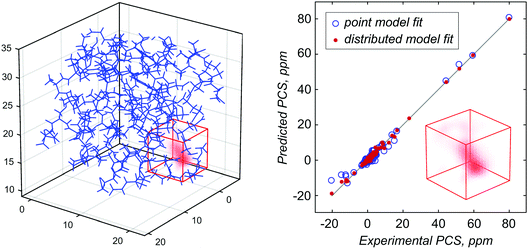 |
| | Fig. 6 Paramagnetic centre probability density reconstruction for Tm3+ labelled calbindin D9K (PDB code: 1IGV),34,45 for which the point approximation is known to produce a poor fit (right panel, blue circles). Numerical reconstruction (left panel) reveals that the thulium ion probability density has an elongated shape, likely as a consequence of local conformational mobility or multiple competing oxygen coordination sites. The red cube is the volume in which the probability density is allowed to vary during the Tikhonov regularised reconstruction process. | |
Simple and intuitive though the reconstructions of the kind shown in Fig. 6 might appear, a few words of caution are in order. An important consequence of the asymptotic behaviour of the three components of the exact solution in eqn (28) is that the fine internal details of the paramagnetic centre probability density distribution are expected to be lost if the PCS data are measured for the nuclei that are positioned outside the bounding sphere of the density. In practice this means that the shape of the bounding surface of the probability distribution is well reproduced by the reconstruction, but its internal details are not.
The consequences are illustrated in Fig. 7. The left diagram shows a simple test density composed of three Gaussian functions. The middle diagram shows the reconstruction performed using PCS data from the nuclei that are distributed randomly within a 10 Å cube around the origin, including inside the density. The right diagram shows the reconstruction performed using PCS data from the nuclei that are placed outside the 5 Å sphere around the density. The latter case is what typically happens in paramagnetic NMR; it is clear that a reasonable likeness of the true probability density is recovered, but the internal details of the distribution are lost because PCS values at those points are not sensitive to the radial functions in the probability density expansion in eqn (20). This is both the consequence of the structure of the multipolar expansion and the price to pay for a Tikhonov solution to what is in general an ill-posed problem.
 |
| | Fig. 7 Left panel: A trimodal paramagnetic centre probability density distribution composed of three isotropic Gaussians with a standard deviation of 1 Å placed at [2, 0, 0], [0, 2, 0] and [0, 0, 2] Angstroms. Middle panel: probability density reconstruction from the PCS values computed at 100 nuclei placed randomly throughout a 10 × 10 × 10 Å cube centred at the origin. Right panel: Probability density reconstruction from the PCS computed at 500 nuclei placed inside the same 10 × 10 × 10 Å cube, but outside the 5 Å sphere centred at density. | |
9. Conclusions
Delocalisation of the paramagnetic centre creates deviations from the point dipole model for the pseudocontact shift. The analytical solution to the partial differential equation for PCS indicates that the key factor in such deviations is the angular anisotropy in the probability density – the PCS from spherical paramagnetic centre distributions is identical to the point dipole PCS outside the bounding sphere of the density.
Multipoles with spherical rank l in the paramagnetic centre distribution create rank l + 2 multipoles in the resulting PCS field that decay with the distance as 1/rl+3 outside the bounding sphere of the density. Due to fast decay of these higher rank components, only terms up to spherical rank four can in practice be extracted by fitting experimental data. The behaviour of the PCS field inside the bounding sphere is more complicated and may be analysed numerically; however, experimental measurements in such close proximity to the paramagnetic centre are rarely possible.
Discretising the paramagnetic centre probability density and the PCS field on finite grids makes it possible to solve the partial differential equation for PCS numerically, using either finite difference operators or fast Fourier transforms. The ill-posed inverse problem of reconstructing the probability density from experimental PCS data can then be solved using Tikhonov regularisation under the assumption that the paramagnetic centre has the same effective magnetic susceptibility anisotropy at every point in the distribution.
The methods described in this paper are implemented in versions 1.8 and later of the Spinach library.37
Acknowledgements
This work was made possible by a grant from EPSRC (EP/N006895/1). Stimulating discussions with Thomas Huber, Alexander Karabanov, Claudio Luchinat, Gottfried Otting and David Parker are gratefully acknowledged.
References
-
G. N. L. Mar, W. D. Horrocks and R. H. Holm, NMR of Paramagnetic Molecules: Principles and Applications, Elsevier Science, 1973 Search PubMed.
-
I. Bertini, C. Luchinat and G. Parigi, Solution NMR of Paramagnetic Molecules: Applications to Metallobiomolecules and Models, Elsevier Science, 2001 Search PubMed.
- L. Banci, I. Bertini, G. G. Savellini, A. Romagnoli, P. Turano, M. A. Cremonini, C. Luchinat and H. B. Gray, Proteins, 1997, 29, 68 CrossRef CAS.
- L. Banci, I. Bertini, L. K. Bren, A. M. Cremonini, B. H. Gray, C. Luchinat and P. Turano, JBIC, J. Biol. Inorg. Chem., 1996, 1, 117 CrossRef CAS.
- L. Banci, I. Bertini, M. A. Cremonini, G. Gori-Savellini, C. Luchinat, K. Wüthrich and P. Güntert, J. Biomol. NMR, 1998, 12, 553 CrossRef CAS PubMed.
-
I. Bertini, C. Luchinat and G. Parigi, NMR of Biomolecules: Towards Mechanistic Systems Biology, 2012, p. 154 Search PubMed.
- M. A. S. Hass and M. Ubbink, Curr. Opin. Struct. Biol., 2014, 24, 45 CrossRef CAS PubMed.
- G. Otting, Annu. Rev. Biophys., 2010, 39, 387 CrossRef CAS PubMed.
- I. Bertini, Y. K. Gupta, C. Luchinat, G. Parigi, M. Peana, L. Sgheri and J. Yuan, J. Am. Chem. Soc., 2007, 129, 12786 CrossRef CAS PubMed.
- A. M. Kenwright, I. Kuprov, E. De Luca, D. Parker, S. U. Pandya, P. K. Senanayake and D. G. Smith, Chem. Commun., 2008, 2514 RSC.
- P. Harvey, K. H. Chalmers, E. De Luca, A. Mishra and D. Parker, Chem. – Eur. J., 2012, 18, 8748 CrossRef CAS PubMed.
- N. F. Ramsey, Phys. Rev., 1950, 78, 699 CrossRef CAS.
- N. F. Ramsey, Phys. Rev., 1952, 86, 243 CrossRef CAS.
- H. M. McConnell, J. Chem. Phys., 1957, 27, 226 CrossRef CAS.
- H. M. McConnell and R. E. Robertson, J. Chem. Phys., 1958, 29, 1361 CrossRef CAS.
- B. Bleaney, J. Magn. Reson., 1972, 8, 91 CAS.
- R. M. Golding, R. O. Pascual and L. C. Stubbs, Mol. Phys., 1976, 31, 1933 CrossRef CAS.
- P. J. Stiles, Mol. Phys., 1974, 27, 501 CrossRef CAS.
- P. T. Stiles and R. M. Wing, J. Magn. Reson., 1974, 15, 510 CAS.
- P. J. Stiles, Proc. R. Soc. London, Ser. A, 1975, 346, 209 CrossRef CAS.
- P. J. Stiles, Chem. Phys. Lett., 1975, 30, 259 CrossRef CAS.
- F. Gendron, K. Sharkas and J. Autschbach, J. Phys. Chem. Lett., 2015, 6, 2183 CrossRef CAS PubMed.
-
M. Kaupp, M. Bühl and V. G. Malkin, Calculation of NMR and EPR Parameters: Theory and Applications, Wiley, 2004 Search PubMed.
- L. F. Chibotaru and L. Ungur, J. Chem. Phys., 2012, 137, 064112 CrossRef CAS PubMed.
- D. Ganyushin and F. Neese, J. Chem. Phys., 2013, 138, 104113 CrossRef PubMed.
- I. Bertini, C. Luchinat and G. Parigi, Prog. Nucl. Magn. Reson. Spectrosc., 2002, 40, 249 CrossRef CAS.
- I. Bertini, P. Turano and A. J. Vila, Chem. Rev., 1993, 93, 2833 CrossRef CAS.
- C. Schmitz, R. Vernon, G. Otting, D. Baker and T. Huber, J. Mol. Biol., 2012, 416, 668 CrossRef CAS PubMed.
- D. Shishmarev and G. Otting, J. Biomol. NMR, 2013, 56, 203 CrossRef CAS PubMed.
- G. T. P. Charnock and I. Kuprov, Phys. Chem. Chem. Phys., 2014, 16, 20184 RSC.
- W. Van den Heuvel and A. Soncini, J. Chem. Phys., 2013, 138, 054113 CrossRef PubMed.
- K. Sharkas, B. Pritchard and J. Autschbach, J. Chem. Theory Comput., 2015, 11, 538 CrossRef CAS PubMed.
- T. O. Pennanen and J. Vaara, J. Chem. Phys., 2005, 123, 174102 CrossRef PubMed.
- I. Bertini, M. B. L. Janik, Y.-M. Lee, C. Luchinat and A. Rosato, J. Am. Chem. Soc., 2001, 123, 4181 CrossRef CAS PubMed.
- B. Fornberg, Math. Comput., 1988, 51, 699 CrossRef.
- Y. Saad and M. H. Schultz, SIAM J. Sci. Stat. Comput., 1986, 7, 856 CrossRef.
- H. J. Hogben, M. Krzystyniak, G. T. P. Charnock, P. J. Hore and I. Kuprov, J. Magn. Reson., 2011, 208, 179 CrossRef CAS PubMed.
- J. W. Cooley and J. W. Tukey, Math. Comput., 1965, 19, 297 CrossRef.
-
A. N. Tikhonov, A. Goncharsky, V. V. Stepanov and A. G. Yagola, Numerical Methods for the Solution of Ill-Posed Problems, Springer, Netherlands, 1995 Search PubMed.
-
J. Nocedal and S. Wright, Numerical optimization, Springer Science & Business Media, 2006 Search PubMed.
- T. F. Coleman and Y. Li, Math. Program., 1994, 67, 189 CrossRef.
- T. F. Coleman and Y. Li, SIAM J. Optimiz., 1996, 6, 418 CrossRef.
- P. C. Hansen, SIAM Rev., 1992, 34, 561 CrossRef.
- P. C. Hansen and D. P. O'Leary, SIAM J Sci. Comput., 1993, 14, 1487 CrossRef.
- S. Balayssac, B. Jiménez and M. Piccioli, J. Biomol. NMR, 2006, 34, 63 CrossRef CAS PubMed.
Footnote |
| † Electronic supplementary information (ESI) available. See DOI: 10.1039/c6cp05437d |
|
| This journal is © the Owner Societies 2016 |
Click here to see how this site uses Cookies. View our privacy policy here.  Open Access Article

![[r with combining circumflex]](https://www.rsc.org/images/entities/b_char_0072_0302.gif) = {θ,φ} and does not depend on its length r = |r|. This provides a clean separation of coordinates that will be useful below.
= {θ,φ} and does not depend on its length r = |r|. This provides a clean separation of coordinates that will be useful below.


![[k with combining circumflex]](https://www.rsc.org/images/entities/b_char_006b_0302.gif) is the angular part of the k-space vector k. Another useful property of the dipolar matrix is that the inverse Fourier transform of its product with a function in k-space can be expressed as an action of the differential operator in real space:
is the angular part of the k-space vector k. Another useful property of the dipolar matrix is that the inverse Fourier transform of its product with a function in k-space can be expressed as an action of the differential operator in real space:![[k with combining circumflex]](https://www.rsc.org/images/entities/b_char_006b_0302.gif) )ĝ(k)] = −Sg(r)
)ĝ(k)] = −Sg(r)


![[small rho, Greek, circumflex]](https://www.rsc.org/images/entities/i_char_e0b7.gif) (k) is the Fourier transform of ρ(r) and
(k) is the Fourier transform of ρ(r) and ![[small sigma, Greek, circumflex]](https://www.rsc.org/images/entities/i_char_e111.gif) (k) is the Fourier transform of σ(r).
(k) is the Fourier transform of σ(r).


 and
and  . In terms of these matrices, the solution may be written as
![[thin space (1/6-em)]](https://www.rsc.org/images/entities/char_2009.gif) log(N)log(M)log(K), which is close to cubic scaling with respect to the grid size. This takes the simulation time into the region of seconds. This method is particularly fast on modern computing hardware because fast Fourier transform routines are available for GPGPU coprocessor cards (NVidia Tesla K40 cards were used in this work). The performance gain is shown in the left panel of Fig. 5.
log(N)log(M)log(K), which is close to cubic scaling with respect to the grid size. This takes the simulation time into the region of seconds. This method is particularly fast on modern computing hardware because fast Fourier transform routines are available for GPGPU coprocessor cards (NVidia Tesla K40 cards were used in this work). The performance gain is shown in the left panel of Fig. 5.


![[thin space (1/6-em)]](https://www.rsc.org/images/entities/char_2009.gif) Re[FFT−{k·kTFFT+{ρ(r)}}]2
Re[FFT−{k·kTFFT+{ρ(r)}}]2


