
 Open Access Article
 This Open Access Article is licensed under a
 Creative Commons Attribution 3.0 Unported Licence
Water adsorption and O-defect formation on Fe2O3(0001) surfaces†
Roman
Ovcharenko
,
Elena
Voloshina
 * and
Joachim
Sauer
* and
Joachim
Sauer
Humboldt-Universität zu Berlin, Institut für Chemie, 10099 Berlin, Germany. E-mail: elena.voloshina@hu-berlin.de; Fax: +49 30 20937136; Tel: +49 30 20935576
First published on 31st August 2016
Abstract
The stability and reactivity of the hematite, Fe2O3(0001) surface are studied by density functional theory including an on-site Coulomb term (DFT+U). Even under oxygen rich conditions, the metal-terminated surface is shown to be stable. On this surface termination, the isolated water molecule forms a heterolytically dissociated structure with the OH− group attached to a surface Fe3+ ion and the proton to a surface O2− ion. Dissociative adsorption is strongly enhanced at oxygen vacancy sites. Here, the OH− group fills the oxygen vacancy site. Dehydrogenation accompanied by defect healing is favoured compared to water desorption (178 kJ mol−1 compared to 236 kJ mol−1). The water adsorption energies (at 0 K) for the clean and defective surfaces are 100 kJ mol−1 and 288 kJ mol−1, respectively.
1 Introduction
Iron oxides are abundant minerals on earth1 and play an important role in a variety of applications2–4 ranging from geochemistry, weathering, corrosion science, biomedicine, magnetic devices to heterogeneous catalysis and photocatalysis. The surface chemistry of these oxides is dominated by interactions with water and solvated ions. Thus, a detailed understanding of the interaction between metal oxides and water, which determines oxide formation and dissolution, is indispensable. This study is devoted to one of the most common and stable iron oxide phases, hematite (α-Fe2O3), in particular to the adsorption of an isolated water molecule on the pristine and defective α-Fe2O3(0001) surfaces.Hematite has the corundum crystal structure, with layers of distorted hexagonally close-packed oxygen ions separated by an iron double layer with Fe3+ occupying two-thirds of the octahedral sites with a – (Fe–O3–Fe) – stacking sequence along the c axis.1 Due to this layered structure different surface terminations are, in principle, possible (Fig. 1a–d). They fall into two classes: oxygen termination and iron termination.
 | ||
| Fig. 1 (left panel) Schematic representation (side view) of various surface terminations of the clean α-Fe2O3(0001) surface. Large red and small blue spheres represent oxygen and iron ions, respectively. (middle panel) Surface structure (top view) of the respective pristine terminations. All atoms lying below the topmost three layers are faded. (right panel) Surface structure of the considered defective terminations: (e) O3−x–Fe–Fe–R, (f) Fe–O3−x–Fe–R, (g) O1−xFe–O3–Fe–R, (h) OFe–O3−x–Fe–R. All atoms lying below the topmost three layers are faded. Arrows point out at the defect sites. | ||
The possible α-Fe2O3(0001) surface terminations have attracted a lot of attention both from experimentalists and theoreticians (see ref. 2, 5 and 6 and the references therein). Nevertheless, clear conclusions could not be reached so far. The reason might be that high oxygen pressures are necessary for the preparation of clean surfaces with well-defined structures and composition, which are hard to reconcile with experiments in ultrahigh vacuum environments. Furthermore, the use of photoemission spectroscopy and of scanning tunnelling microscopy is difficult because of the insulating character of hematite. Finally, experimental investigations of the surfaces of both bulk α-Fe2O3(0001) and epitaxially grown thin films showed significant variations in the relative stabilities of different surface terminations depending on the method of surface preparation.5
The computational results also disagree with each other.7–11 Density functional theory (DFT) within the generalised gradient approximation (GGA) has shown that the Fe-terminated surface of hematite is preferred at low oxygen pressures and that O-terminated surfaces should occur at increasing oxygen chemical potentials (μO), leaving a small stability domain to ferryl-terminated surfaces.7–9 Inclusion of a Hubbard-type on-site Coulomb repulsion (GGA+U approach) yields a ferryl-terminated surface at high μO and Fe-terminated surfaces at low potentials.8,10 Within GGA+U, the O-terminated surface is out of the physically meaningful range of oxygen chemical potentials. To our best knowledge, more sophisticated computational approaches have not been employed when studying the stabilities of different hematite (0001) surface terminations.
DFT has also been used to study the adsorption of water on hematite surfaces.9–13 In agreement with experiments14,15 these studies show that upon water adsorption the hydroxylated terminations appear to be more stable than their dehydroxylated counterparts. However, the localised nature of the 3d states of iron in these studies was not always taken into account. Moreover, the reactivity of hematite surfaces with oxygen vacancy defects has been rarely addressed (see ref. 6 and the references therein).
Here, we examine the adsorption of an isolated water molecule on the pristine and defective α-Fe2O3(0001) surfaces, taking different terminations into account. Comparison will be made with α-Al2O3 as it shares the corundum structure with α-Fe2O3, but belongs to the non-reducible oxides.
2 Computational details
Spin-polarised DFT calculations based on plane-wave basis sets of 500 eV cutoff energy were performed with the Vienna ab initio simulation package (VASP).16–18 The Perdew–Burke–Ernzerhof (PBE) exchange–correlation functional19 was employed. The electron–ion interaction was described within the projector augmented wave (PAW) method20 with Fe (3d, 4s), O (2s, 2p), and H (1s) states treated as valence states. The Brillouin-zone integration was performed on Γ-centred symmetry reduced Monkhorst–Pack meshes using a Gaussian smearing with σ = 0.05 eV, except for the calculation of total energies and densities of states (DOSs). For those calculations, the tetrahedron method with Blöchl corrections21 was employed. A 4 × 4 × 1 k-mesh was used in the case of ionic relaxations and 8 × 8 × 1 for single point calculations, respectively.The DFT+U scheme22,23 was adopted for the treatment of Fe 3d orbitals, with the parameter Ueff = U − J equal to 4 eV, which yields lattice constants a = 507 pm and c = 1387 pm, an Fe magnetic moment of 4.2μB, and a band gap of 2.1 eV for the bulk hematite, in good agreement with the most widely accepted experimental values, a = 504 pm and c = 1375 pm,24 4.6μB25 and 2.1 eV,26 respectively. We note that the band gap of bulk hematite is only 0.4 eV without the U correction, and it increases to 3.4 eV when a hybrid functional (here HSE0627) is used. As suggested in ref. 28, the agreement with experiment can be significantly improved when using a reduced Fock exchange contributing in the HSE functional 12% instead of the standard HSE06 value of 25%. We found the HSE (12%) and PBE+U results to be almost identical to each other. For comparison reasons, selected calculations were performed using the original HSE06 functional.
The compensated polar (0001) hematite surfaces29 were modelled by symmetric slabs. In total, four pristine Fe2O3(0001) terminations were considered (Fig. 1a–d). The used supercells contain 21, 23, 19, and 23 atomic layers in the case of Fe–O3–Fe–R, Fe–Fe–O3–R, O3–Fe–Fe–R, and OFe–O3–Fe–R, respectively, and a vacuum gap of approximately 2600 pm. For all these structures the ions of the 13 middle inner layers were fixed at their bulk positions during the structural optimisation procedure, whereas the positions (x, y, z-coordinates) of all other ions were fully relaxed until forces became smaller than 0.01 eV Å−1. A (2 × 2) supercell in the lateral plane was adopted to allow a sufficient degree of surface reconstruction and non-integer composition ratios. The lattice constant in the lateral plane was set according to the optimised lattice constant of bulk hematite, a = 507 pm.
To quantify the structural stability, we define the surface free energy per unit cell γ at temperature T and pressure p as

where A is the surface area, the factor 2 accounts for the presence of two identical surfaces in the structural slab model. The chemical potential μO can meaningfully vary only within a limited range. At lower limit, reduction of the oxide from Fe2O3 to magnetite (Fe3O4) will take place. At the upper limit, oxygen starts to condensate at the surface of hematite. These limiting values are given by

| 3μFe2O3 − 2μFe3O4 ≤ μO ≤ ½μO2. |
The electrically neutral vacancies were created by removing an oxygen atom from the supercells of the same surface periodicity, i.e. (2 × 2). Thereby, the distance between repeated vacancies in the nearest-neighbour cells is larger than 1000 pm. The oxygen defect formation energy is defined as follows
| ΔEdef(1/2O2) = E(FenOm−1) + 1/2E(O2) − E(FenOm) |
To study the adsorption of a single H2O molecule, a (2 × 2) surface cell of the size (101.4 × 101.4) pm was used with one water molecule added from one side of the slab. This corresponds to a quarter monolayer with respect to the surface iron ions. Adsorption energies were calculated as
| ΔEads = E(H2O/FenOm) − [E(FenOm) + E(H2O)] |
The results for the Al2O3–H2O interaction used for comparison were obtained with the same computational settings as for the Fe2O3–H2O interaction. Our results for the water adsorption on the pristine Al2O3(0001) surface are in qualitative agreement with previously published data33 obtained with a slightly different functional (Perdew and Wang 199134 augmented by the Grimme “D2” term).
3 Results and discussion
3.1 Surface stability
We consider four possible pristine terminations. Three of them are obtained by simple bulk cleavage above the oxygen layer (O3–Fe–Fe–R, see Fig. 1a), above the Fe double layer (Fe–Fe–O3–R, see Fig. 1b), and between the Fe layers (Fe–O3–Fe–R, see Fig. 1c). One further possible termination, shown in Fig. 1d is a single-metal termination capped with O ions atop the metal ions to produce a layer of ferryl (Fe![[double bond, length as m-dash]](https://www.rsc.org/images/entities/char_e001.gif) O) species. As defects play an important role on oxide surfaces and can significantly influence the interaction of water with the surface,35 oxygen surface vacancies (Fig. 1e–h) are also investigated.
O) species. As defects play an important role on oxide surfaces and can significantly influence the interaction of water with the surface,35 oxygen surface vacancies (Fig. 1e–h) are also investigated.
Fig. 2 shows the Gibbs free energies per surface area for the studied surface terminations as functions of μO. The dashed black vertical lines bracket the allowed range of μO (for details, see Section 2). Fe–O3–Fe–R is clearly the energetically most favourable surface termination. Another Fe-terminated surface, the Fe–Fe–O3–R structure, was found to be energetically unfavourable over the whole range, except for extremely poor oxygen conditions where the termination is in thermodynamic equilibrium with the magnetite (Fe3O4) bulk phase. The O3–Fe–Fe–R and OFe–O3–Fe–R are stable only outside of the region of interest under extremely oxygen rich atmosphere. This is consistent with the previously published DFT results for the nondefective Fe2O3(0001) surface.8
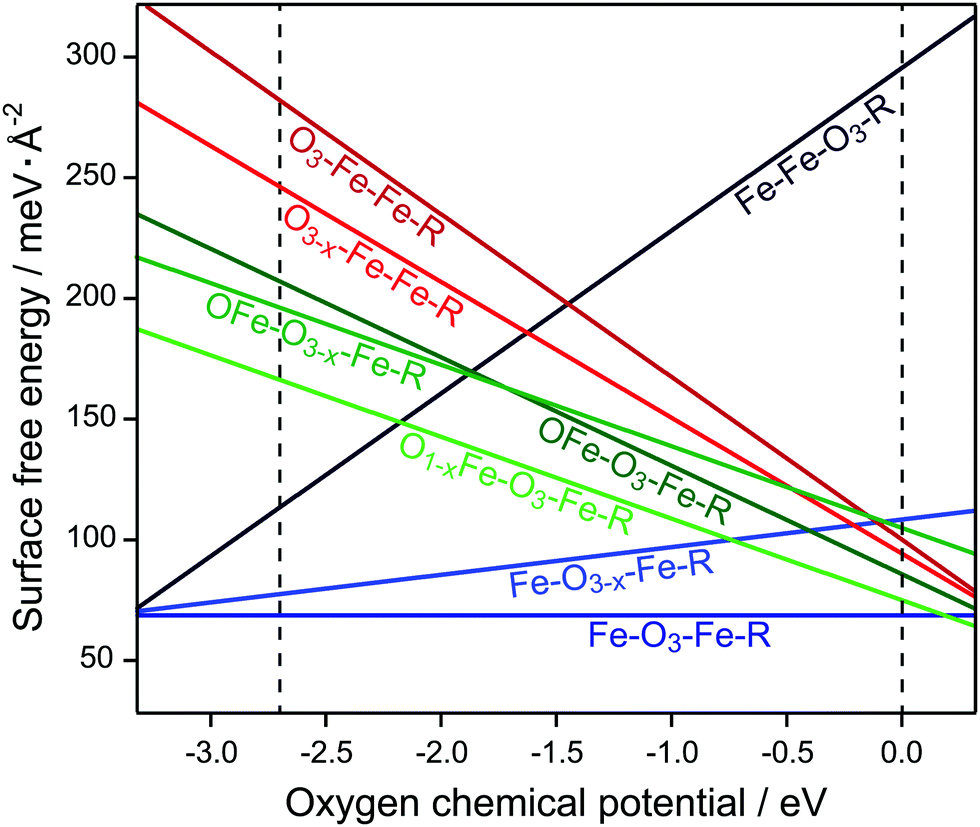 | ||
| Fig. 2 Surface energies of different Fe2O3(0001) surface terminations. The dashed vertical lines indicate the allowed range of oxygen chemical potential, μO (see text for details). | ||
The overall stability of the Fe–O3–Fe–R structure may have a very simple explanation as it is the only structure without a notable surface dipole. Furthermore, on structure optimisation the surface Fe ions significantly relax inward, accompanied by charge redistribution in the surface layer. In our calculations, the lowest empty surface state, which has predominantly Fe 3dz2 character, is 1.57 eV above the Fermi level (Fig. 3a).
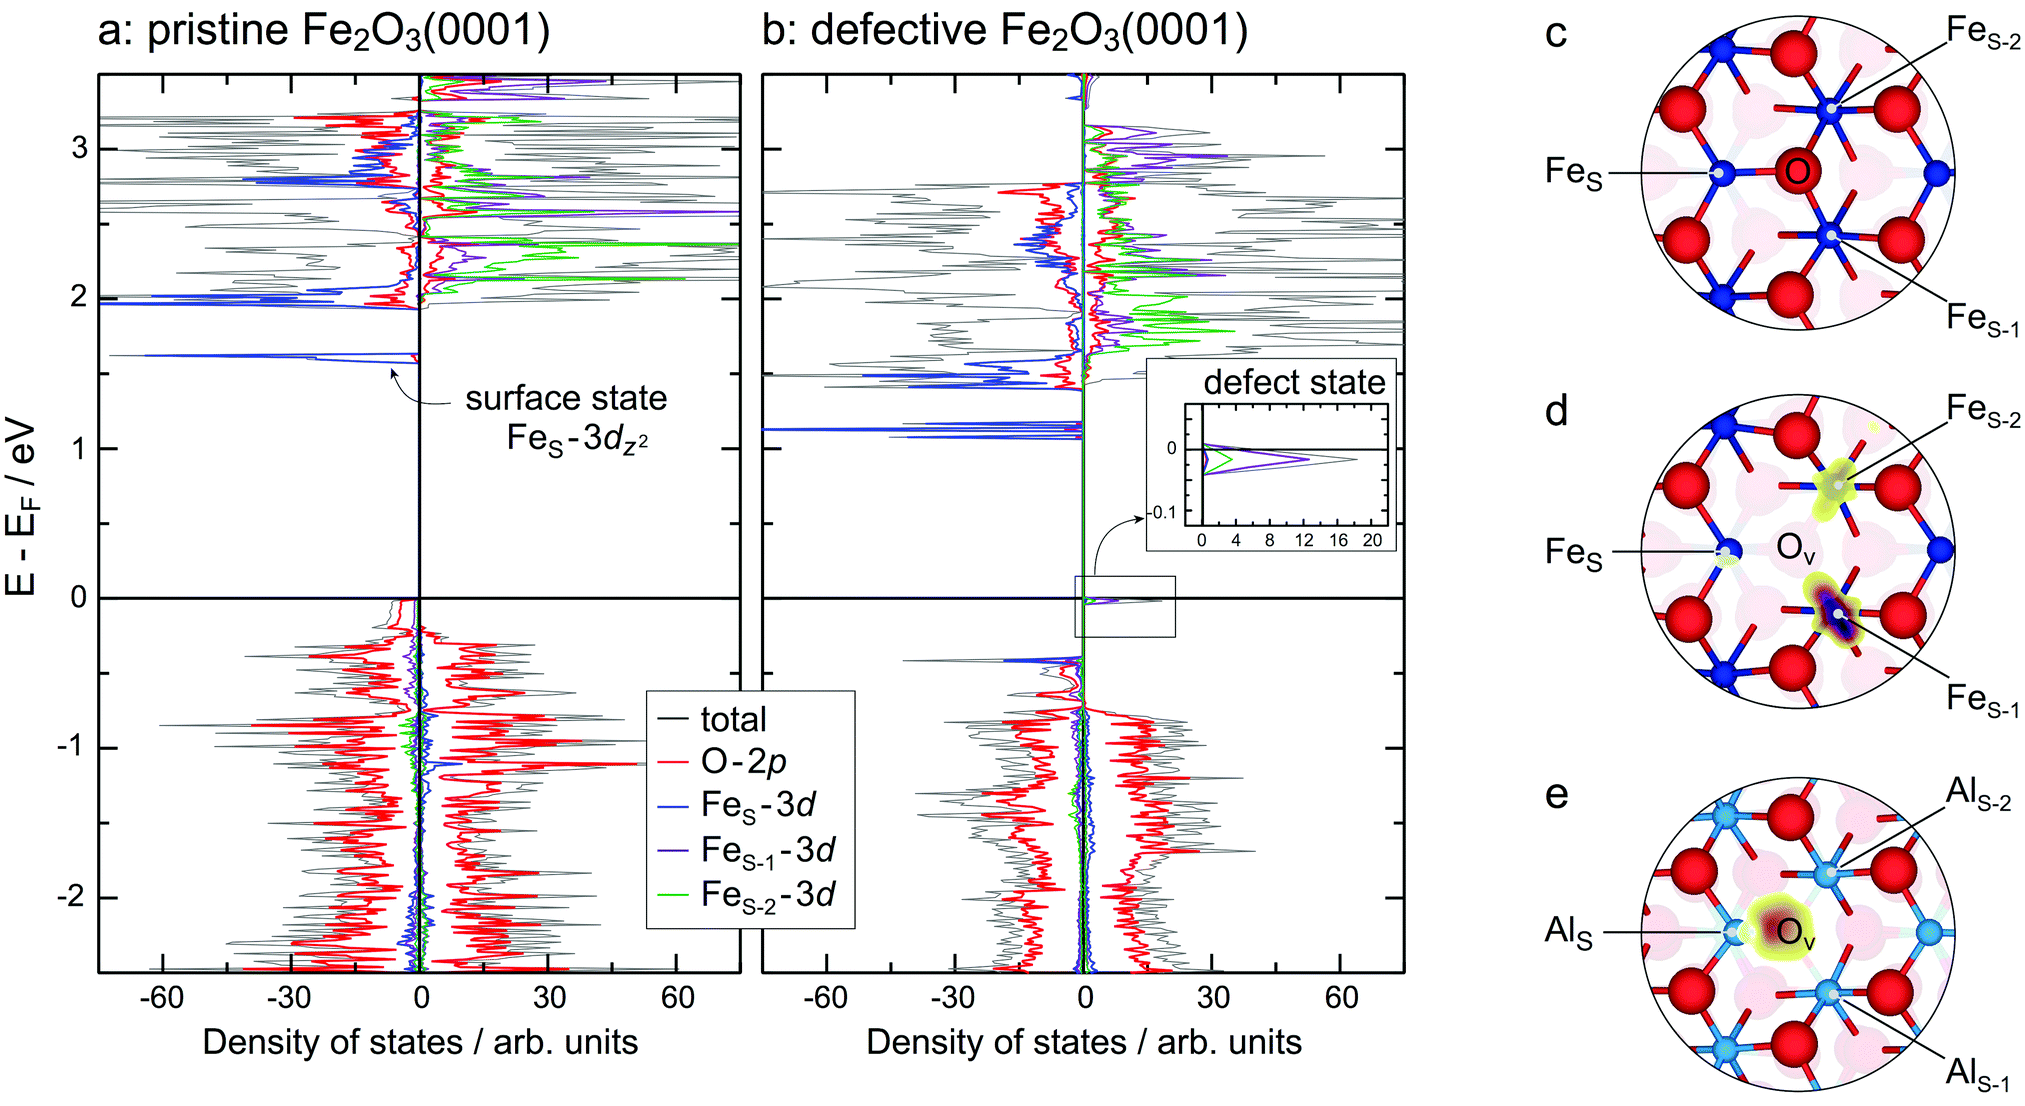 | ||
| Fig. 3 Total and site-projected density of states for (a) Fe–O3–Fe–R and (b) Fe–O3−x–Fe–R. FeS/FeS−1/FeS−2 denote surface/subsurface/subsubsurface Fe sites. In (b) zoom around EF is shown as an inset. (c) Top view of the relaxed Fe–O3–Fe–R structure. Large red and small blue spheres represent oxygen and metal ions, respectively. (d and e) Top views of the relaxed Fe–O3−x–Fe–R and Al–O3−x–Al–R structures, respectively, with the corresponding electron densities for a surface oxygen vacancy superimposed. | ||
The O3–Fe–Fe–R termination has the largest dipole at the surface. This surface termination has a very unfavourable free energy, which decreases fast with increasing μO. The O-terminated surface can become more stable, however, upon creation of oxygen vacancies (see Fig. 2). Thus, the O3−x–Fe–Fe–R and OFe–O3–Fe–R structures have consistently lower free energies than O3–Fe–Fe–R for the whole range of μO. Creating vacancies in the OFe–O3–Fe–R surface layer further stabilises this termination, whereas O-vacancies in the subsurface layers of OFe–O3–Fe–R and Fe–O3–Fe–R destabilise the respective surfaces. Still, the latter structure is the most stable among all studied defective surfaces, except for high μO values.
The defect formation energies show a similar pattern (Table 1): while removing oxygen yields an energy gain in the case of O3−x–Fe–Fe–R and O1−x–Fe–O3–Fe–R, the defective Fe–O3−x–Fe–R and OFe–O3−x–Fe–R structures are less stable than the parent terminations. Hybrid functionals yield qualitatively similar results for the relative surface stabilities compared to DFT+U, see ESI† (Fig. S1) for surface free energies obtained with different computational approaches.
Comparison with experiment is not an easy task as different preparation methods can lead to different results and, sometimes, even to different phases being formed. Some studies indicate the coexistence of Fe2O3(0001) and FeO(111) phases, see, e.g.ref. 36. Recently, it was shown that the so-called biphase termination of α-Fe2O3 is related to a thin overlayer of Fe3O4.37 It was proposed that the effect of the metal substrate, often used for preparation of epitaxial thin films, cannot be ignored even in the case of rather thick (10–50 nm) iron oxide layers.37,38 When growing α-Fe2O3 as films on Pt(111), the coexistence of two different domains (a single-metal termination and a ferryl termination) was observed at intermediate pressures, while higher and lower pressures led to one or the other of these domains becoming dominant.39 Contrary to the observations made when growing α-Fe2O3 films on metal surfaces, the clean α-Fe2O3(0001) surface grown epitaxially (≈35 nm thick) on α-Al2O3(0001) is single-Fe-terminated and, in this case, the surface structure of α-Fe2O3(0001) is similar to that of α-Al2O3(0001) (1 × 1).40 There was no evidence for a stable O-terminated surface in this X-ray photoelectron diffraction experiments. The same conclusions were reached when studying the surface of a bulk α-Fe2O3(0001) crystal by STM2 and LEED.38 Our slabs of around 20 atomic layers model the Fe2O3 single crystal surface or a bulk-like thick film. Thus, comparison of the presented results with those of ref. 2, 38 and 40 is adequate and good agreement between calculations and experiment is achieved.
A further possibility to compare our results with experiment provides simulation of STM images (for details, see ESI,† Fig. S3). In agreement with the site-projected density of states calculated for the pristine Fe2O3(0001) (see Fig. 3a), one observes imaging of the oxygen sublattice for the bias voltage of −2.5 V (occupied states) and the uppermost Fe sublattice for the bias voltage of +2.5 V (unoccupied states). This is in agreement with the available experimental results for the surface of a bulk α-Fe2O3(0001) crystal.2
The results we obtain for α-Fe2O3(0001) are in qualitative agreement with the data available for the isomorphic α-Al2O3 surface.7 The common features are: (i) the single-metal termination is energetically most favourable; (ii) creating O-vacancies in the subsurface layer destabilises the respective surface; (iii) among the O-terminated surfaces, those containing less oxygen ions at the surface are more stable. In the case of (0001) surfaces of hematite and corundum there is only one dominating low energy surface termination in the allowed μO range: the single-metal termination. Therefore, from now on, we will focus on this particular surface termination, i.e. Fe–O3–Fe–R, as well as on the corresponding defective structure, namely Fe–O3−x–Fe–R.
3.2 Oxygen vacancies
Removal of an oxygen atom reduces the coordination number of the three neighbouring iron ions, leading to strong modification of the local lattice structure. The FeS–FeS−1–FeS−2 triangle (for notations, see Fig. 3c) shrinks and the FeS–FeS−1 and FeS–FeS−2 distances become smaller (ca. 5%), whereas the FeS−1–FeS−2 distance stays almost unchanged. Simultaneously, FeS moves inwards, whereas FeS−2 and FeS−3 are moving out of the surface. Overall, all three metal ions are moving closer to the centre of the triangle, i.e. the former position of O. Similar changes have been observed when comparing Al–O3–Al–R and Al–O3−x–Al–R.41As result of the O-vacancy (VO) formation,
| [2Fe3+,O2−] → [2Fe2+,VO] + ½O2, |
In Al2O3, the excess electrons localise in the vacancy,
| [2Al3+,O2−] → [2Al3+,2e−] + ½O2, |
3.3 Adsorption of an isolated water molecule
 | ||
| Fig. 4 (a–c) Top and side views of the adsorption structures of one water molecule on the pristine single-Fe terminated Fe2O3(0001) surface. Large red and small blue spheres represent oxygen and metal ions, respectively. In the top views, all atoms lying below the topmost four layers are faded. The water molecule is shown with orange (larger) and white (smaller) spheres, for O and H respectively. The calculated adsorption energy (kJ mol−1, dispersion included) is given below each individual side-view plot. For comparison the values for the respective structures of the H2O/Al2O3(0001) system are given in parenthesis. The side-view cuts are made perpendicular to the surface through the dashed line as shown in the respective top view. | ||
The tilted structure we find for of a single adsorbed water molecule on Fe2O3 is different from the parallel configuration found to be most stable on Al2O3(0001).33
In addition to M, two different dissociated structures, called “D1” and “D2”, were investigated, with an OH− group at the surface Fe ion and a proton either at a neighbouring (Fig. 4b) or a distant surface oxygen ion (Fig. 4c), respectively. Due to the strong interaction between the surface Fe ion and the hydroxyl group, the Fe–O distance is shorter (184 and 185 pm in D1 and D2, respectively) than in M (216 pm). The strong interaction causes also an outward relaxation of a surface cation by 26 pm and 16 pm for D1 and D2, respectively. On protonation, the surface O2− ion is pulled out of the surface by ca. 20 pm and the neighbouring iron ions are pushed away from their positions in the pristine surface.
Fig. 4 shows the same relative stabilities of the three adsorption structures for hematite and corundum (D1 > M > D2), although the binding is much stronger for the corundum surface. This is due to smaller ionic radius for Al3+ (54 pm) compared to Fe3+ (65 pm).42 Compared to PBE+U+D2, HSE06+D2 gives very similar results for the adsorption energy (−100 kJ mol−1, −117 kJ mol−1, and −82 kJ mol−1 for M, D1, and D2, respectively).
 | ||
| Fig. 5 (a–d) Top views of the studied adsorption structures of one water molecule on the defective single-Fe terminated Fe2O3(0001) surface. Large red and small blue spheres represent O2− and Fe3+ ions, respectively. The water molecule is shown with orange (larger) and white (smaller) spheres, for O and H, respectively. Fe2+ ions are shown in black. Arrows point to the defect site. All ions lying below the topmost four layers are faded. For the M-d (a) and D1-d (b) structures side views are given to the right of the corresponding top views. The cut is made perpendicular to the surface through the dashed line. The calculated adsorption energy (kJ mol−1, dispersion included) is given below each individual structure. For comparison, the respective results for the H2O/Al2O3(0001) system are given in parenthesis. | ||
There are two very stable structures, D1-d and D2-d in which water is dissociated into OH− and H+, with OH− is filling the oxygen vacancy. The two defect electrons remain localised in Fe-3d states. The proton can be attached to two different oxygen sites. In the D1-d structure the two surface OH groups formed coordinate to the same iron surface ion, whereas in the D2-d structure they are further apart. The former structure is more stable with a binding energy of −236 kJ mol−1 instead of −211 kJ mol−1.
In the D3-d adsorption structure, a hydride (H−) ion is occupying the oxygen vacancy position. Formally, it is created when the proton in the vacancy position picks up the two electrons left behind on vacancy formation:
| [2Fe2+,VO] + H+ → [2Fe3+,H−] |
For Al2O3, the relative stabilities of the two different types of structures are reversed. On defect formation, the two electrons left behind fill the vacancy position because there are no d-states available to accommodate the electrons,
| [2Al3+,O2−] → [2Al3+,2e−] + ½O2. |
In the D1-d and D2-d structures, the surface iron ion relaxes back closer to the surface plane. In the D3-d structure (as in D1) the OH group is bended slightly towards the vacancy, which is now occupied by the hydride ion. From the energetic point of view this structure is significantly less favourable than the other three structures.
Contrary to Fe2O3, for Al2O3 both molecular and dissociative adsorption is energetically less favourable at surface defects than at the pristine surface, except when the hydride ion occupies the vacancy site.
Fig. 6 shows different states of water adsorption on the pristine and defective Fe2O3(0001) surfaces obtained with PBE+U+D2. The presence of water reduces the defect formation energy and enhances the reducibility. The O-defect formation energy is lowered from 354 kJ mol−1 for the dry surface to 222 kJ mol−1 for the surface with an adsorbed water molecule. In Al2O3, the O-defect formation energy is reduced by approximately the same value, 550 kJ mol−1 and 427 kJ mol−1 for the surfaces without and with an adsorbed water molecule, respectively. Dehydrogenation of the hydrated defective surfaces heals the defect. It requires 178 kJ mol−1 and 33 kJ mol−1 for hematite and corundum, respectively, significantly less than water desorption (236 and 288 kJ mol−1, respectively, see Fig. 6).
 | ||
| Fig. 6 Energy diagram (kJ mol−1) for the adsorption of H2O on the pristine and defective Fe2O3 (black) and Al2O3 (blue) (0001) surfaces. | ||
When comparing the interaction of a water molecule with the three-fold coordinated Fe3+ ions in hematite (α-Fe2O3(0001)) and magnetite (Fe3O4(111)),43,44 the four-fold coordinated Fe3+ ions in goethite (α-FeOOH(101)),45 akaganeite (β-FeOOH(100)),45 and lepidocrocite (γ-FeOOH(010))45 as well as the five-fold coordinated Fe3+ ion in magnetite (Fe3O4(100))46,47 (Table 2), the interaction strength decreases with increasing coordination number of the surface iron ion. Dissociated structures are stable only when both iron cations and oxygen anions occur on an oxide surface.
| Substrate | Coordination number of FeS | Adsorption mode | ΔEads/kJ mol−1 | d Fe–O/pm |
|---|---|---|---|---|
| a See Fig. 4. | ||||
| α-Fe2O3(0001) | 3 | Molecular | −83 (−95)a | 216 (217) |
| α-Fe2O3(0001) | 3 | Dissociative | −100 (−104)a | 184 (184) |
| Fe3O4(111)43,44 | 3 | Dissociative | −140 (−167) | 191 |
| α-FeOOH(101)45 | 4 | Molecular | −9 | 236 |
| β-FeOOH(100)45 | 4 | Molecular | −37 | 236 |
| γ-FeOOH(010)45 | 4 | Molecular | 3 | 239 |
| Fe3O4(100)47 | 5 | Molecular | −38 | 222 |
| Fe3O4(100)47 | 5 | Dissociative | −73 | 184 |
Molecular water binds more strongly on the three-fold coordinated Fe3+ ions on the hematite (0001) surface than on the five-fold coordinated Fe3+ ions on the magnetite (100) surface which is also reflected in shorter Fe–OH2O distances (216 pm compared to 222 pm). In both cases, water extends a hydrogen bond to a neighboured surface oxygen ion (note: the presently accepted model of Fe3O4(100)48 deviates from that utilised in ref. 46 and 47. Still it contains both five-fold coordinated Fe3+ and O2− in the surface layer).
Furthermore, for both oxides dissociative adsorption is more favourable than molecular adsorption. However, for magnetite the adsorption energy is not sensitive to the position of the proton on the surface (−70 kJ mol−1 for H+ attached to a neighbouring oxygen ion and −73 kJ mol−1 for H+ on the more distant surface oxygen ion).46,47 For hematite the relative positions of the hydroxyl group and the proton are of crucial importance (−100 kJ mol−1 for the nearest oxygen ion vs. −62 kJ mol−1 for the more distant oxygen ion, without dispersion term). Dissociation of a single water molecule was also found when considering the Fe3O4(111) surface terminated by octahedrally coordinated iron ions.43,44
Similarly to hematite, the adsorption on the defective magnetite surface is strongly favourable over adsorption on the pristine one.46,47 Here quantitative comparison is complicated by the more complex structure of magnetite. The formation energy for an oxygen vacancy varies between 241 and 337 kJ mol−1![[thin space (1/6-em)]](https://www.rsc.org/images/entities/char_2009.gif) 46,47 depending on the presence of tetrahedrally coordinated Fe ions in its neighbourhood. Nevertheless, the general (qualitative) behaviour of the defective Fe3O4(100) and Fe2O3(0001) is very similar. In both cases, electrons localise on two subsurface iron ions,46 dissociative adsorption on the defective surface is favoured over the molecular one, and the OH group, formed on heterolytic dissociation, fills the oxygen vacancy.
46,47 depending on the presence of tetrahedrally coordinated Fe ions in its neighbourhood. Nevertheless, the general (qualitative) behaviour of the defective Fe3O4(100) and Fe2O3(0001) is very similar. In both cases, electrons localise on two subsurface iron ions,46 dissociative adsorption on the defective surface is favoured over the molecular one, and the OH group, formed on heterolytic dissociation, fills the oxygen vacancy.
4 Conclusion
Relative stabilities of the pristine and defective α-Fe2O3 surfaces were studied by density functional theory within the PBE+U(+D2) approach. Even under oxygen rich conditions the metal-terminated surface was shown to be stable. This is in agreement with experiments on single crystals.2,38,40 On this surface termination isolated water molecules form an dissociated structure with an OH group attached to a surface iron ion and a protonated surface oxygen ion. The isostructural α-Al2O3(0001) (corundum) shows a similar behaviour unless the oxygen vacancy is created. The nature of oxygen vacancies is different in reducible (here: α-Fe2O3) and non-reducible (here: α-Al2O3) oxides.35 In the case of hematite, dissociative adsorption is strongly promoted at the surface defect sites. Here, the electrons left behind on vacancy formation are accommodated into low-lying empty 3d states of the Fe ions. On dissociative water adsorption, the OH− fills the vacancy position. In contrast, in corundum, the vacancy site is filled with two electrons that repel OH−. Here, the proton resulting from dissociated water forms a hydride ion (H−).For both Fe2O3 and Al2O3 the O vacancy formation energy becomes lower if an adsorbed water molecule is present. On increasing the temperature, water would not desorb from the defect site, but rather dehydrogenation accompanied by defect healing will occur.
Among different iron oxides with Fe3+ surface ions the strength of the interaction with water molecules depends on the coordination number of the Fe3+ ions as well as on the composition of the surface, i.e. the coexistence of oxygen and iron ions in the topmost layer. The adsorption behaviour of water on the Fe2O3(0001) and Fe3O4(100) surfaces is similar.
Acknowledgements
We thank the German Research Foundation (DFG) for financial support within the Collaborative Research Centre (SFB) 1109 and the North-German Supercomputing Alliance (HLRN) for providing computer time.References
- R. M. Cornell and U. Schwertmann, The Iron Oxides, Wiley, Weinheim, 2003 Search PubMed.
- G. E. Brown, V. E. Henrich, W. H. Casey, D. L. Clark, C. Eggleston, A. Felmy, D. W. Goodman, M. Grätzel, G. Maciel, M. I. McCarthy, K. H. Nealson, D. A. Sverjensky, M. F. Toney and J. M. Zachara, Chem. Rev., 1999, 99, 77–174 CrossRef CAS PubMed.
- A. Kay, I. Cesar and M. Grätzel, J. Am. Chem. Soc., 2006, 128, 15714–15721 CrossRef CAS PubMed.
- H. Kuhlenbeck, S. Shaikhutdinov and H.-J. Freund, Chem. Rev., 2013, 113, 3986–4034 CrossRef CAS PubMed.
- D. P. Woodruff, Chem. Rev., 2013, 113, 3863–3886 CrossRef CAS PubMed.
- G. S. Parkinson, Surf. Sci. Rep., 2016, 71, 272–365 CrossRef CAS.
- X. G. Wang, A. Chaka and M. Scheffler, Phys. Rev. Lett., 2000, 84, 3650–3653 CrossRef CAS PubMed.
- A. Rohrbach, J. Hafner and G. Kresse, Phys. Rev. B: Condens. Matter Mater. Phys., 2004, 70, 125426 CrossRef.
- T. Trainor, A. Chaka, P. Eng, M. Newville, G. Waychunas, J. Catalano and G. Brown, Surf. Sci., 2004, 573, 204 CrossRef CAS.
- S. Souvi, M. Badawi, J. Paul, S. Cristol and L. Cantrel, Surf. Sci., 2013, 610, 7 CrossRef CAS.
- M.-T. Nguyen, N. Seriani and R. Gebauer, J. Chem. Phys., 2013, 138, 194709 CrossRef PubMed.
- S. Yin, X. Ma and D. E. Ellis, Surf. Sci., 2007, 601, 2426–2437 CrossRef CAS.
- S. Yin and D. E. Ellis, Surf. Sci., 2008, 602, 2047–2054 CrossRef CAS.
- P. Liu, T. Kendelewicz, G. Brown, Jr., E. Nelson and S. Chambers, Surf. Sci., 1998, 417, 53 CrossRef CAS.
- S. Yamamoto, T. Kendelewicz, J. Newberg, G. Ketteler, D. Starr, E. Mysak, K. Andersson, H. Ogasawara, H. Bluhm, M. Salmeron, G. Brown and A. Nilsson, J. Phys. Chem., 2010, 114, 2256 CAS.
- G. Kresse and J. Furthmuller, Comput. Mater. Sci., 1996, 6, 15–50 CrossRef CAS.
- G. Kresse and J. Hafner, J. Phys.: Condens. Matter, 1994, 6, 8245–8257 CrossRef CAS.
- G. Kresse and J. Hafner, Phys. Rev. B: Condens. Matter Mater. Phys., 1993, 47, 558–561 CrossRef CAS.
- J. P. Perdew, K. Burke and M. Ernzerhof, Phys. Rev. Lett., 1997, 78, 1396 CrossRef CAS.
- P. E. Blöchl, Phys. Rev. B: Condens. Matter Mater. Phys., 1994, 50, 17953–17979 CrossRef.
- P. E. Blöchl, O. Jepsen and O. K. Andersen, Phys. Rev. B: Condens. Matter Mater. Phys., 1994, 49, 16223–16233 CrossRef.
- V. I. Anisimov, F. Aryasetiawan and A. I. Lichtenstein, J. Phys.: Condens. Matter, 1997, 9, 767–808 CrossRef CAS.
- S. L. Dudarev, G. A. Botton, S. Y. Savrasov, C. J. Humphreys and A. P. Sutton, Phys. Rev. B: Condens. Matter Mater. Phys., 1998, 57, 1505–1509 CrossRef CAS.
- L. W. Finger and R. M. Hazen, J. Appl. Phys., 1980, 51, 5362 CrossRef CAS.
- J. M. D. Coey and G. A. Sawatzky, J. Phys. Chem., 1971, 4, 2386–2407 CAS.
- S. Mochizuki, Phys. Status Solidi A, 1977, 41, 591–594 CrossRef CAS.
- J. Heyd, G. E. Scuseria and M. Ernzerhof, J. Chem. Phys., 2003, 118, 8207 CrossRef CAS.
- Z. D. Pozun and G. Henkelman, J. Chem. Phys., 2011, 134, 224706 CrossRef PubMed.
- P. W. Tasker, J. Phys. C: Solid State Phys., 1979, 12, 4977–4984 CrossRef CAS.
- K. Reuter and M. Scheffler, Phys. Rev. B: Condens. Matter Mater. Phys., 2001, 65, 035406 CrossRef.
- S. Grimme, J. Comput. Chem., 2006, 27, 1787–1799 CrossRef CAS PubMed.
- T. Kerber, M. Sierka and J. Sauer, J. Comput. Chem., 2008, 29, 2088–2097 CrossRef CAS PubMed.
- J. Wirth and P. Saalfrank, J. Phys. Chem. C, 2012, 116, 26829–26840 CAS.
- J. P. Perdew and Y. Wang, Phys. Rev. B: Condens. Matter Mater. Phys., 1992, 46, 12947 CrossRef.
- M. V. Ganduglia-Pirovano, A. Hofmann and J. Sauer, Surf. Sci. Rep., 2007, 62, 219–270 CrossRef CAS.
- R. J. Lad and V. E. Henrich, Surf. Sci., 1988, 193, 81–93 CrossRef CAS.
- C. H. Lanier, A. N. Chiaramonti, L. D. Marks and K. R. Poeppelmeier, Surf. Sci., 2009, 603, 2574–2579 CrossRef CAS.
- M. Lübbe and W. Moritz, J. Phys.: Condens. Matter, 2009, 21, 134010 CrossRef PubMed.
- X. G. Wang, W. Weiss, S. K. Shaikhutdinov and M. Ritter, Phys. Rev. Lett., 1998, 81, 1038–1041 CrossRef CAS.
- S. Thevuthasan, Y. J. Kim, S. I. Yi, S. A. Chambers and J. Morais, Surf. Sci., 1999, 425, 276–286 CrossRef CAS.
- J. Carrasco, J. R. B. Gomes and F. Illas, Phys. Rev. B: Condens. Matter Mater. Phys., 2004, 69, 064116 CrossRef.
- R. D. Shannon, Acta Crystallogr., Sect. A: Cryst. Phys., Diffr., Theor. Gen. Crystallogr., 1976, 32, 751 CrossRef.
- P. Dementyev, K.-H. Dostert, F. Ivars-Barceló, C. P. O Brien, F. Mirabella, S. Schauermann, X. Li, J. Paier, J. Sauer and H.-J. Freund, Angew. Chem., Int. Ed., 2015, 54, 13942–13946 CrossRef CAS PubMed.
- X. Li and J. Paier, J. Phys. Chem. C, 2016, 120, 1056–1065 CAS.
- K. Otte, W. W. Schmahl and R. Pentcheva, Surf. Sci., 2012, 606, 1623–1632 CrossRef CAS.
- N. Mulakaluri, R. Pentcheva, M. Wieland and W. Moritz, Phys. Rev. Lett., 2009, 103, 176102 CrossRef PubMed.
- N. Mulakaluri, R. Pentcheva and M. Scheffler, J. Phys. Chem. C, 2010, 114, 11148–11156 CAS.
- R. Bliem, E. McDermott, P. Ferstl, M. Setvin, O. Gamba, J. Pavelec, M. A. Schneider, M. Schmid, U. Diebold, P. Blaha, L. Hammer and G. S. Parkinson, Science, 2014, 346, 1215–1218 CrossRef CAS PubMed.
Footnote |
| † Electronic supplementary information (ESI) available. See DOI: 10.1039/c6cp05313k |
| This journal is © the Owner Societies 2016 |