 Open Access Article
Creative Commons Attribution 3.0 Unported Licence
Mechanistic insights into lithium ion battery electrolyte degradation – a quantitative NMR study†
S.
Wiemers-Meyer
a,
M.
Winter
ab and
S.
Nowak
*a
aUniversity of Muenster, MEET Battery Research Center, Institute of Physical Chemistry, Corrensstraße 46, 48149 Muenster, Germany. E-mail: sascha.nowak@uni-muenster.de
bHelmholtz Institute Münster, IEK-12 of Forschungszentrum Jülich, Corrensstrasse 46, Münster, Germany
First published on 7th September 2016
Abstract
The changes in electrolyte composition on the molecular level and the reaction mechanisms of electrolyte degradation upon thermal aging are monitored by quantitative NMR spectroscopy, revealing similar rates of degradation for pristine and already aged electrolytes. The data analysis is not in favor of an autocatalytic reaction mechanism based on OPF3 but rather indicates that the degradation of LiPF6 in carbonate based solvents proceeds via a complex sequence of “linear” reactions rather than a cyclic reaction pattern which is determined by the amount of water present in the samples. All investigated electrolytes are reasonably stable at temperatures of up to 60 °C in the presence of minor amounts or absence of water hence indicating that chemical instability of electrolyte components against water is decisive for degradation and an increase in temperature (“thermal aging”) just accelerates the degradation impact of water.
1 Introduction
Currently, much effort is devoted to investigate the relation between chemical and physical properties and electrochemical performance of lithium ion battery materials.1–6 Early studies considering the electrolyte and its aging processes revealed that water and other protic impurities have a detrimental effect on the electrolyte stability at higher temperatures,7,8 while later the identification of degradation products (mainly from carbonate and PF6−) and kinetic studies came into focus thereby providing tentative reaction mechanisms9–14 in addition to a detailed report on degradation mechanisms of carbonate electrolyte solvents.15 Also, the applicability of various analytical methods to reliably monitor electrolyte aging processes including gas chromatography (GC),16–23 ion chromatography (IC),19,22,24–27 high pressure liquid chromatography (HPLC),17 electrospray ionization mass spectrometry (ESI-MS),17,22,24–27 infrared (IR) spectroscopy,28 inductively coupled or low temperature plasma mass spectrometry (ICP-MS),22,26 (LTP-MS)29 as well as optical emission spectroscopy (ICP-OES)22,25 or hyphenations of these methods was thoroughly reviewed.Though most of these studies discuss qualitative data, the extent of HF release was estimated by titration with NaOH8 while OPF2OEt formation during electrolyte aging could be established by nuclear magnetic resonance (NMR) spectroscopy.11,14 Other reports include a quantification of carbonates and their degradation products based on HPLC and GC methods,17,19 that in principle allow for a separation of non-ionic electrolyte components. Nevertheless, to the best of our knowledge, there is no detailed report available that quantitatively considers the degradation products of the rather abundantly applied electrolyte 1 M LiPF6 in a mixture of ethylene carbonate (EC) and dimethyl carbonate (DMC) though unraveling of molecular electrolyte aging mechanisms could afford unprecedented ways to either prevent or at least defer occurring aging phenomena. Therefore, in this work, the impact of various experimental conditions on both the electrolyte stability and aging processes are systematically elucidated. In addition, monitoring the occurrence of potentially toxic compounds may yield crucial data for further industrial safety evaluations. Since the compounds likely involved in electrolyte aging contain NMR-active nuclei such as e.g., fluorine, phosphorous or hydrogen multinuclear solution NMR spectroscopy is applied for identification and quantification of molecular species present in the considered aged electrolytes where the use of gas-tight flame-sealed NMR tubes with polytetrafluoroethylene (PTFE) tube liners should allow for equilibrium conditions at least at the timescale of the experiments.
2 Experimental
2.1 Materials
Battery grade SelectiLyte™ LP30 was purchased from BASF (Germany). It consists of LiPF6 (1 mol L−1) in EC![[thin space (1/6-em)]](https://www.rsc.org/images/entities/char_2009.gif) :
:![[thin space (1/6-em)]](https://www.rsc.org/images/entities/char_2009.gif) DMC (1
DMC (1![[thin space (1/6-em)]](https://www.rsc.org/images/entities/char_2009.gif) :
:![[thin space (1/6-em)]](https://www.rsc.org/images/entities/char_2009.gif) 1 by weight). The water content of the electrolyte was measured with an 851 Titrando Karl Fischer Coulometer (Metrohm, Switzerland). The content was determined to be 68 ppm. Deionized water was obtained from a Milli-Q water system (Merck Millipore, USA). Acetonitrile (LC grade) was ordered from VWR (Germany), all other chemicals were purchased from Sigma-Aldrich (USA) and used without further purification. PTFE-FEP (polytetrafluoroethylene-fluorinated ethylene polypropylene copolymer) NMR tube liners were ordered from Wilmad-LabGlass (USA).
1 by weight). The water content of the electrolyte was measured with an 851 Titrando Karl Fischer Coulometer (Metrohm, Switzerland). The content was determined to be 68 ppm. Deionized water was obtained from a Milli-Q water system (Merck Millipore, USA). Acetonitrile (LC grade) was ordered from VWR (Germany), all other chemicals were purchased from Sigma-Aldrich (USA) and used without further purification. PTFE-FEP (polytetrafluoroethylene-fluorinated ethylene polypropylene copolymer) NMR tube liners were ordered from Wilmad-LabGlass (USA).
2.2 Sample preparation
The dilution series was prepared in a gravimetric manner. Acetonitrile was used as solvent, DMC as heteronuclear standard and monofluorobenzene as analyte from 20 ppm to 200![[thin space (1/6-em)]](https://www.rsc.org/images/entities/char_2009.gif) 000 ppm (wt). For the quantification, three different samples were prepared: an LP30 electrolyte in PTFE NMR tube liners, an LP30 electrolyte with 1000 ± 10 volumetric ppm (vppm) H2O in PTFE NMR tube liners and an LP30 electrolyte in NMR glass tubes. Each sample contained 500 μL of electrolyte. The NMR tube liners were cut to a length of 12.5 cm to fit inside the NMR glass tubes and sealed with a PTFE plug. The glass tubes were flame-sealed to achieve gas-tightness. Due to the distance between the electrolyte sample and the part of the tube that was sealed, the flame-sealing does not heat up the sample. The samples were stored at 60 °C.
000 ppm (wt). For the quantification, three different samples were prepared: an LP30 electrolyte in PTFE NMR tube liners, an LP30 electrolyte with 1000 ± 10 volumetric ppm (vppm) H2O in PTFE NMR tube liners and an LP30 electrolyte in NMR glass tubes. Each sample contained 500 μL of electrolyte. The NMR tube liners were cut to a length of 12.5 cm to fit inside the NMR glass tubes and sealed with a PTFE plug. The glass tubes were flame-sealed to achieve gas-tightness. Due to the distance between the electrolyte sample and the part of the tube that was sealed, the flame-sealing does not heat up the sample. The samples were stored at 60 °C.
2.3 Measurements
Each sample was measured three times on each date. The NMR measurements were performed employing an Avance III HD spectrometer (Bruker, USA) at 400 MHz (1H) and a broadband probe (PA BBO 400 MHz, Bruker). The 1H and 13C NMR signals were referenced to the signals of EC at 4.63 ppm (1H) and 67.1 ppm (13C), while the 19F and 31P signals were referenced with respect to the signals of PF6− at −72.7 ppm (19F) and −146.1 ppm (31P), respectively. Note that SiMe4 (1H and 13C), CCl3F (19F) and H3PO4 (31P) were used as primary standards. The quantification measurements were carried out at −15 °C. A parameter optimization measurement for the relaxation delay (d1) was used to figure out the required time for full spin relaxation, while a comparison of 13C NMR spectra recorded with and without proton decoupling of pristine and aged electrolyte showed that ongoing degradation of the electrolyte did not influence the NMR signal enhancement of the peak attributed to EC due to broadband decoupling. The acquisition parameters are listed in Table S1 (ESI†).2.4 Data processing
The NMR spectrometer was controlled by TopSpin™ 3.2 (Bruker, USA). The NMR data processing was done by the same software and also by MestReNova 10.0 (Mestrelab research, Spain). Plotting of graphs and curve fitting was done using OriginPro 2015 (9.2) (OriginLab, USA).3 Results and discussion
3.1 Quantification
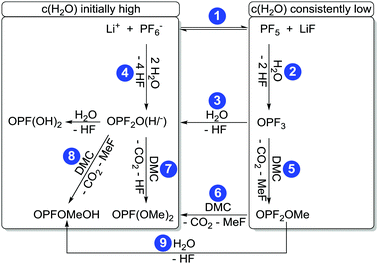
In the following chapters no distinction between protonated and deprotonated acidic phosphates is made. Concerning the degradation of electrolytes at least a cyclic11,14 and a linear22,26,29 reaction scheme was proposed.The cyclic reaction scheme (Fig. 1) emphasizes the formation of difluorinated organophosphates and the crucial role of OPF3. Most notably, actual electrolyte degradation according to this reaction scheme should result in both significant accumulation of OPF3 and subsequently increasing degradation rates. In contrast, the linear reaction mechanism considers solely reaction of PF5 with water as the source of OPF3, followed by substitution reactions indicating that electrolyte degradation does not pile up OPF3 so that the degradation rate should not increase. In order to corroborate a cyclic reaction scheme, a quantification of OPF2OEt, a degradation product of LiPF6 and diethyl carbonate, was reported though the data interpretation in part remained ambiguous.11,14 In an attempt to more thoroughly elucidate the possible routes of electrolyte aging, while considering that likely occurring degradation products of PF6− contain NMR active nuclei, quantitative 19F NMR spectroscopy appears as suitable method. Nevertheless, reliable quantification of reaction species present in a considered sample via solution NMR spectroscopy often requires the addition of an internal standard.30 This standard should be chemically inert (neither changing over time nor taking part in degradation reactions) while the corresponding NMR signal should be unaffected by signals of occurring degradation products. Therefore, monofluorobenzene, hexafluorobenzene, monofluoronaphthalene and trichlorofluoromethane were evaluated as potential standards, applying flame-sealed standard NMR glass tubes or polytetrafluoroethylene (PTFE) NMR tube liners (to prevent a potential reaction of HF with glass). However, none of the considered compounds met all requirements for an internal standard in both types of sample containers (chapter S3.1, ESI†). Therefore, an NMR method was implemented that does not rely on the addition of a standard compound but rather utilizes a species present in the sample. Indeed, many compounds with methyl groups were found in aged electrolytes, likely originating from DMC, while only two degradation products containing ethylene groups were found. The initial amount of EC may thus be represented by the sum of integrated signal areas of EC and its associated decomposition products such as dimethyl-2,5-dioxahexane di-carboxylate (DMDOHC) and 2-methoxyethyl methyl carbonate (MEMC) in the corresponding 1H or 13C{1H} solution NMR spectra (I0(EC)). The latter compounds are solely identified in the case of considerably aged electrolytes.
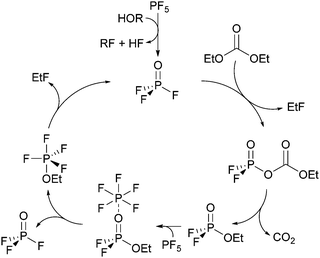 | ||
| Fig. 1 Autocatalytic reaction mechanism for the degradation of LiPF6 in carbonate solvents.11,14 | ||
Based on quantitative 1H or 13C{1H} and 19F NMR data the actual PF6− concentration c(PF6−) during electrolyte degradation can be obtained from the expression
 | (1) |
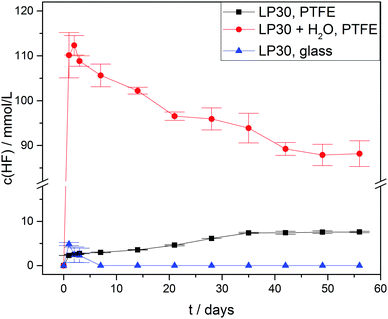
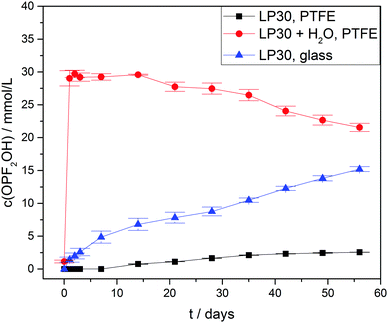
Due to hydrolysis of PF5 and PF6− (reaction routes 2 and 4) HF will be released at the onset of degradation, therefore the concentration curves of HF in case of three different types of samples were observed (Fig. 4) for a period of 56 days. As anticipated all the samples with an addition of 1000 ± 10 vppm of water exhibited a rather strong increase of the HF concentration to 110 ± 5 mmol L−1 after one day, which is twice the initial water concentration (55.6 ± 0.6 mmol L−1) and in agreement with reaction route 4 (and possibly 1, 2 and 3). The subsequently identified decrease of the HF concentration suggests that HF in part even escaped from the PTFE NMR tube, though no significant impact on the actual mechanism of electrolyte degradation is expected. In contrast, the samples without water addition revealed much lower HF concentrations. For “LP30, PTFE” the HF concentration rather slowly increased to 7.6 ± 0.2 mmol L−1 after eight weeks while negligibly small amounts of HF were detectable in case of “LP30, glass” during the first days. In the latter sample, HF disappeared after one week due to the reaction with the NMR glass tube yielding BF4− and H2O. Notably, the concentration of OPF2OH rapidly increased in the samples with water addition, thus during one day reaching 29 ± 1.2 mmol L−1 (Fig. 5) in agreement with reaction route 4. The subsequent decrease of OPF2OH concentration to 21.6 ± 0.6 mmol L−1 during the observation period of 56 days is attributed to substitution reactions according to reaction routes 7 and 8, yielding monofluorinated phosphates. Likewise, for the samples stored in glass tubes (LP30, glass) the concentration of OPF2OH increased continuously to a value of 15.2 ± 0.4 mmol L−1 at the end of the measurement period, reflecting the reaction of HF with glass and accompanied release of water that corroborate an ongoing formation of OPF2OH. Without water addition the formation of OPF2OH in the PTFE tube samples is almost negligible, reaching merely 2.56 ± 0.01 mmol L−1 after eight weeks.
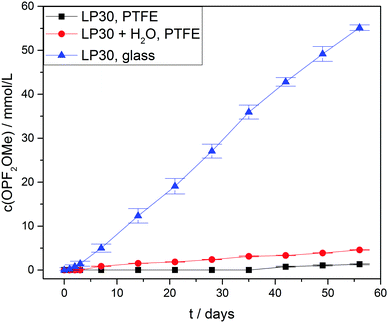
For the difluorinated phosphates OPF2OH and OPF2OMe remarkably different rates of formation were identified. While the formation of OPF2OH was very pronounced in those samples where additional water was added (21.6 ± 0.6 mmol L−1), the concentration of OPF2OMe solely reached 4.57 ± 0.05 mmol L−1 after eight weeks of aging (Fig. 6). In contrast, the samples stored in glass NMR tubes exhibited a maximum OPF2OMe concentration of 55.2 ± 0.6 mmol L−1 while for OPF2OH a maximum concentration of 15.2 ± 0.4 mmol L−1 was determined. In principle, this observation may be rationalized based on the proposed reaction scheme (Fig. 3) provided that the reaction of PF5 with water is favored over the reaction of PF6− with water. However, the presented equilibrium (reaction 1) is far on the left side (since the fresh electrolyte predominantly contains PF6−) thereby promoting a reaction of water with PF6− so that it appears reasonable to assume that initially added water primarily reacts with PF6− until it is almost consumed (reaction path 4). In contrast, in the presence of rather small amounts of water the equilibrium reaction 1 could deliver sufficient amounts of PF5 that further react with traces of water, in this way following the reaction paths 2 and 5. This scenario is feasible for the electrolytes stored in glass tubes where a minor amount of water is permanently present, hence suggesting that preferred reaction paths for electrolyte degradation are influenced by the overall amount of water present in the sample or eventually added and whether or not the critical amount of water is provided in one batch at first or continuously formed over time. It has to be noted that no NMR signals assigned to PF5 are found, which is in agreement with its character as a highly reactive intermediate.
Fig. 7 shows the measured concentrations of monofluorinated phosphates. These degradation products were only found in the “LP30 + H2O, PTFE” and “LP30, glass” samples. The concentrations in the samples with water addition show an almost constant slope, whereas the slope of OPF(OMe)2 increases over time in the glass tubes. The reason for this is most likely the formation of the monofluorinated phosphates by a reaction of difluorinated phosphates with DMC (Fig. 3 reaction routes 6, 7 and 8). Reaction routes 6 and 8 are previously proposed based on qualitative data about electrolyte degradation products.22,26,29 The results of this work confirm these proposals. Furthermore, it has to be noted that only quantitative studies are able to reveal reaction route 7 by comparing the product's formation rate with the reactants concentration. The formation of OPFOMeOH in the glass tube samples most likely proceeds according to reaction routes 8 and 9.
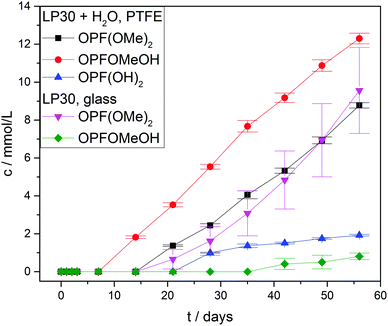 | ||
| Fig. 7 Concentration curves of monofluorinated phosphates. Concentrations in the PTFE tube samples without water addition are below the LOQ. Lines serve as guide to the eye. | ||
The autocatalytic reaction mechanism (Fig. 1) for the degradation of LiPF6 in carbonate based solvents indicates the OPF3 species as main driving force of the overall reaction where consumption of one OPF3 molecule eventually results in the release of two further OPF3 molecules, thereby accelerating the electrolyte degradation rate, accompanied by subsequent accumulation of OPF3. The accumulation of OPF3, however, was not observed within this work. Rather, the NMR based quantification of the occurring reaction species clearly revealed that the degradation rates of pristine and aged electrolytes are comparable. In addition, the presence of OPF3 (19F NMR signal at −88.9 ppm) could be detected only in the case of samples stored in NMR glass tubes at rather constant amounts. These observations are not in favor of a “cyclic” autocatalytic reaction mechanism but corroborate electrolyte aging according to an augmented linear reaction scheme (Fig. 3).22,26,29
Note that the reaction paths 6 and 8 were previously introduced based on qualitative inspection of electrolyte degradation products22,26,29 and are supported by this work while the reaction routes 4, 7 and 9 were identified from concentration curves and comparison of the concentrations of difluorinated phosphates with the formation rate of monofluorinated phosphates, hence from quantitative data of this work. Since the samples stored in PTFE tubes without the presence of water revealed minor degradation while all the others exhibited significant aging (as established from residual concentrations of PF6− after eight weeks, see Table 1) it appears that chemical instability of the electrolyte with respect to water rather than with respect to elevated temperatures is responsible for the observable degradation over time.
| Compound |
δ(1H)/ppm
(J(1H–1H), J(1H–31P)) |
δ(13C{1H})/ppm |
δ(19F)/ppm
(J(19F–31P)) |
δ(31P)/ppm (J(19F–31P), J(1H–31P)) |
c(t = 56 days)/mmol−1 L−1LP30; LP30 + H2O; LP30 glass |
|---|---|---|---|---|---|
| a The signal of the OMe-group was not found. LOD: limit of detection. | |||||
| EC | 4.63 (s) |
67.1
158.7 |
— | — | — |
| DMC | 3.81 (s) |
56.0
158.2 |
— | — | — |
| PF6− | — | — | −72.70 (d, 708 Hz) | −146.1 (sept, 708 Hz) |
996 ± 16;
956 ± 20; 895 ± 8 |
| CH3OCH3 | 3.37 (s) | 61.1 | — | — | — |
| CH2CH2 | 5.80 (s) | — | — | — | — |
| CO2 | — | 126.3 | — | — | — |
| DMDOHC | 4.41 (s) |
67.2
157.3 |
— | — | — |
| MEMC |
3.39 (s)
3.67 (t + d, 1.9, 9.1 Hz); 4.32 (t + d, 1.9, 9.1 Hz) |
59.3 68.4 71.5 157.7 |
— | — | — |
| OPF3 | — | — | −88.09 (d, 1066 Hz) | −36.3 (q, 1066 Hz) |
<LOD;
<LOD; 0.22 ± 0.01 |
| OPF2(OH) | — | — | −83.35 (d, 930–960 Hz) | −21.6 (t, 930–960 Hz) |
2.56 ±0.01;
21.6 ± 0.6; 15.2 ± 0.4 |
| OPF2(OMe) | 4.22 (d, 12.0 Hz) | — | −86.59 (d, 1008 Hz) | −21.1 (t; q, 1008 Hz, 12.2 Hz) |
1.3 ± 0.1;
4.57 ± 0.05; 55.2 ± 0.6 |
| OPF2(OCH2CH2OMe)a |
4.51 (m)
4.77 (m) |
— | −84.40 (d, 1007 Hz) | −21.9 (t; t; t, 1007 Hz, 9.4 Hz, 1.9 Hz) |
<LOD;
<LOD; 1.36 ± 0.02 |
| OPF(OH)2 | — | — | −75.76 (d, 926 Hz) | −10.6 (d, 926 Hz) |
<LOD;
1.93 ± 0.05; <LOD |
| OPF(OMe)(OH) | 3.98 (d, 11.7 Hz) | — | −82.18 (d, 943 Hz) | −10.2 (d; q, 943 Hz, 11.7 Hz) |
<LOD;
12.3 ± 0.3; 0.8 ± 0.2 |
| OPF(OMe)2 | 4.04 (d, 11.6 Hz) | — | −86.73 (d, 962 Hz) | −9.5 (d; sept, 962 Hz, 11.6 Hz) |
<LOD;
8.8 ± 0.1; 10 ± 2 |
| OPF2(OH)–BF3 | — | — |
−84.40 (d; q, 960 Hz, 2.5 Hz)
−147.78 (10B) (d; t, 10 Hz, 2.5 Hz) −147.84 (11B) (d; t, 10 Hz, 2.5 Hz) |
−27.6 (t; q, 960 Hz, 10 Hz) |
<LOD;
<LOD; 0.77 ± 0.05 |
| BF4− | — | — |
−154.22 (10B),
−154.27 (11B) |
— |
<LOD;
1.2 ± 0.1; 11.9 ± 0.2 |
| HF | 9.14 (d, 474 Hz) | — | −188.05 (d, 474 Hz) | — |
7.6 ± 0.2;
88 ± 3; <LOD |
3.2 Identification
The identification of degradation products and assignment of their NMR signals are crucial steps prior to quantification. Besides the necessity of knowing the compounds that are to be quantified, it is required that all degradation products of the chosen heteronuclear standard (EC) are found. If EC is not completely stable, its degradation products have to be taken into account for an accurate quantification.The ESI† contain a detailed description of the identification strategy and the complex measurements which were necessary for the signal assignment. All identified compounds are listed in Table 1. Two compounds, namely dimethyl-2,5-dioxahexane dicarboxylate (DMDOHC) and 2-methoxyethyl methyl carbonate (MEMC) are found as degradation products of EC (Fig. S5, ESI†).
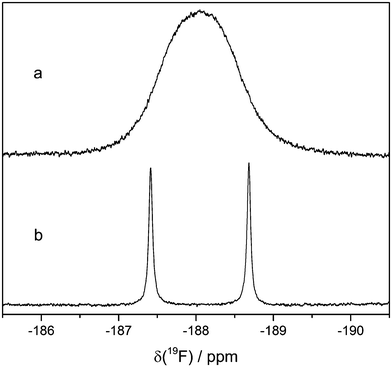
The 19F NMR spectrum of electrolyte LP30 stored in NMR glass tubes at 60 °C contains two singlets at approx. −154 ppm (Fig. 8). The ratio of their integrated signal areas is 1![[thin space (1/6-em)]](https://www.rsc.org/images/entities/char_2009.gif) :
:![[thin space (1/6-em)]](https://www.rsc.org/images/entities/char_2009.gif) 4. According to literature the 19F NMR signal of HF is a singlet at the same chemical shift.11,12,20 However, the ratio of the integrated signal areas is identical with the isotopic signature of boron (20% 10B, 80% 11B), suggesting the presence of BF4− formed by reaction of HF with the borate glass of the NMR tube. Furthermore, the 19F NMR signal of BF4− is known to be at the above mentioned chemical shift.31 The different masses of the isotopes lead to different mean distances between the fluorine and boron atoms, which influences the chemical shift.32 The assignment to BF4− is confirmed by 19F measurements of an electrolyte sample with additional LiBF4.
4. According to literature the 19F NMR signal of HF is a singlet at the same chemical shift.11,12,20 However, the ratio of the integrated signal areas is identical with the isotopic signature of boron (20% 10B, 80% 11B), suggesting the presence of BF4− formed by reaction of HF with the borate glass of the NMR tube. Furthermore, the 19F NMR signal of BF4− is known to be at the above mentioned chemical shift.31 The different masses of the isotopes lead to different mean distances between the fluorine and boron atoms, which influences the chemical shift.32 The assignment to BF4− is confirmed by 19F measurements of an electrolyte sample with additional LiBF4.
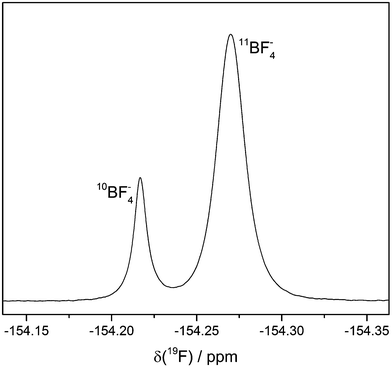 | ||
| Fig. 8 19F signals of BF4−. LP30 stored in NMR glass tubes at 60 °C. The two different singlets are caused by the two boron isotopes. Line broadening: 0.5 Hz. | ||
The actual HF signal in the 19F NMR spectrum can be found when PFTE NMR tube liners are used. It is a doublet at −188.05 ppm with a 1J(1H–19F) coupling constant of 474 Hz (Fig. 9). To the best of our knowledge, this is the first time the 1H–19F coupling of HF is observed, most likely because the exchange of protons in the presence of protic compounds usually leads to the observation of a singlet. In this work, the addition of 1000 vppm water leads to broad singlets in the 19F and 1H spectra at the chemical shifts of HF. Fluoride and HF can form clusters of the formula [F(HF)n]−.33 Since the corresponding 1H signal at 9.14 ppm is also a doublet, there is no more than one coupling partner of the 1H hence no clusters are present.
5 Conclusions
A facile NMR method for reliable quantification of species occurring during thermal aging of electrolytes was developed and applied to expand the under-standing of molecular processes thereby affording detailed insight into the underlying reaction mechanisms, which in principle are suitable for enhanced battery safety evaluations. In contrast to previous reports it was successfully demonstrated that electrolyte degradation proceeds at similar rates in pristine and already aged electrolytes upon thermal treatment. In addition, the collected NMR data strongly suggests that water not only reacts with PF5 but also with PF6−, in this way critically determining the actually occurring degradation products. While an excess of water forces hydrolysis of PF6− hence yielding OPF2OH, the continuous presence of rather small amounts of water (e.g., due to almost constant release from glass materials) results in predominant formation of OPF2OMe whereas negligible electrolyte degradation is observable in the absence of water, in this way highlighting the critical effects of different water concentrations in electrolytes.Acknowledgements
The authors would like to thank the Bundesministerium für Bildung und Forschung (Federal Ministry of Education and Research, Germany) for funding the project “Elektrolytlabor 4e”.References
- G. G. Amatucci, J. M. Tarascon and L. C. Klein, J. Electrochem. Soc., 1996, 143, 1114–1123 CrossRef CAS.
- D. Aurbach, M. D. Levi, K. Gamulski, B. Markovsky, G. Salitra, E. Levi, U. Heider, L. Heider and R. Oesten, J. Power Sources, 1999, 81–82, 472–479 CrossRef CAS.
- A. K. Padhi, K. S. Nanjundaswamy and J. B. Goodenough, J. Electrochem. Soc., 1997, 144, 1188–1194 CrossRef CAS.
- M. Winter, J. O. Besenhard, M. E. Spahr and P. Novák, Adv. Mater., 1998, 10, 725–763 CrossRef CAS.
- T. Placke, V. Siozios, R. Schmitz, S. F. Lux, P. Bieker, C. Colle, H. W. Meyer, S. Passerini and M. Winter, J. Power Sources, 2012, 200, 83–91 CrossRef CAS.
- J. Kasnatscheew, M. Evertz, B. Streipert, R. Wagner, R. Klopsch, B. Vortmann, H. Hahn, S. Nowak, M. Amereller, A. C. Gentschev, P. Lamp and M. Winter, Phys. Chem. Chem. Phys., 2016, 18, 3956–3965 RSC.
- D. Aurbach, A. Zaban, A. Schechter, Y. Ein-Eli, E. Zinigrad and B. Markovsky, J. Electrochem. Soc., 1995, 142, 2873–2882 CrossRef CAS.
- U. Heider, R. Oesten and M. Jungnitz, J. Power Sources, 1999, 81–82, 119–122 CrossRef CAS.
- S. E. Sloop, J. K. Pugh, S. Wang, J. B. Kerr and K. Kinoshita, Electrochem. Solid-State Lett., 2001, 4, A42–A44 CrossRef CAS.
- B. Ravdel, K. M. Abraham, R. Gitzendanner, J. DiCarlo, B. Lucht and C. Campion, J. Power Sources, 2003, 119–121, 805–810 CrossRef CAS.
- C. L. Campion, W. Li and B. L. Lucht, J. Electrochem. Soc., 2005, 152, A2327–A2334 CrossRef CAS.
- A. V. Plakhotnyk, L. Ernst and R. Schmutzler, J. Fluorine Chem., 2005, 126, 27–31 CrossRef CAS.
- T. Kawamura, S. Okada and J.-i. Yamaki, J. Power Sources, 2006, 156, 547–554 CrossRef CAS.
- C. L. Campion, W. Li, W. B. Euler, B. L. Lucht, B. Ravdel, J. F. DiCarlo, R. Gitzendanner and K. M. Abraham, Electrochem. Solid-State Lett., 2004, 7, A194–A197 CrossRef CAS.
- G. Gachot, S. Grugeon, M. Armand, S. Pilard, P. Guenot, J.-M. Tarascon and S. Laruelle, J. Power Sources, 2008, 178, 409–421 CrossRef CAS.
- W. Weber, V. Kraft, M. Grützke, R. Wagner, M. Winter and S. Nowak, J. Chromatogr. A, 2015, 1394, 128–136 CrossRef CAS PubMed.
- C. Schultz, V. Kraft, M. Pyschik, S. Weber, F. Schappacher, M. Winter and S. Nowak, J. Electrochem. Soc., 2015, 162, A629–A634 CrossRef CAS.
- G. g. Gachot, P. Ribière, D. Mathiron, S. Grugeon, M. Armand, J.-B. Leriche, S. Pilard and S. p. Laruelle, Anal. Chem., 2010, 83, 478–485 CrossRef PubMed.
- M. Grützke, V. Kraft, W. Weber, C. Wendt, A. Friesen, S. Klamor, M. Winter and S. Nowak, J. Supercrit. Fluids, 2014, 94, 216–222 CrossRef.
- P. Handel, G. Fauler, K. Kapper, M. Schmuck, C. Stangl, R. Fischer, F. Uhlig and S. Koller, J. Power Sources, 2014, 267, 255–259 CrossRef CAS.
- L. Terborg, S. Weber, S. Passerini, M. Winter, U. Karst and S. Nowak, J. Power Sources, 2014, 245, 836–840 CrossRef CAS.
- M. Grutzke, V. Kraft, B. Hoffmann, S. Klamor, J. Diekmann, A. Kwade, M. Winter and S. Nowak, J. Power Sources, 2015, 273, 83–88 CrossRef.
- L. Gireaud, S. Grugeon, S. Pilard, P. Guenot, J.-M. Tarascon and S. Laruelle, Anal. Chem., 2006, 78, 3688–3698 CrossRef CAS PubMed.
- L. Terborg, S. Nowak, S. Passerini, M. Winter, U. Karst, P. R. Haddad and P. N. Nesterenko, Anal. Chim. Acta, 2012, 714, 121–126 CrossRef CAS PubMed.
- L. Terborg, S. Weber, F. Blaske, S. Passerini, M. Winter, U. Karst and S. Nowak, J. Power Sources, 2013, 242, 832–837 CrossRef CAS.
- V. Kraft, M. Grützke, W. Weber, J. Menzel, S. Wiemers-Meyer, M. Winter and S. Nowak, J. Chromatogr. A, 2015, 1409, 201–209 CrossRef CAS PubMed.
- V. Kraft, M. Grutzke, W. Weber, M. Winter and S. Nowak, J. Chromatogr. A, 2014, 1354, 92–100 CrossRef CAS PubMed.
- S. Wilken, P. Johansson and P. Jacobsson, Solid State Ionics, 2012, 225, 608–610 CrossRef CAS.
- B. Vortmann, S. Nowak and C. Engelhard, Anal. Chem., 2013, 85, 3433–3438 CrossRef CAS PubMed.
- S. K. Bharti and R. Roy, TrAC, Trends Anal. Chem., 2012, 35, 5–26 CrossRef CAS.
- V. N. Plakhotnyk, L. Ernst, P. Sakhaii, N. F. Tovmash and R. Schmutzler, J. Fluorine Chem., 1999, 98, 133–135 CrossRef.
- H. S. Gutowsky, J. Chem. Phys., 1959, 31, 1683–1684 CrossRef CAS.
- I. G. Shenderovich, S. N. Smirnov, G. S. Denisov, V. A. Gindin, N. S. Golubev, A. Dunger, R. Reibke, S. Kirpekar, O. L. Malkina and H.-H. Limbach, Ber. Bunsen-Ges., 1998, 102, 422–428 CrossRef CAS.
Footnote |
| † Electronic supplementary information (ESI) available. See DOI: 10.1039/c6cp05276b |
| This journal is © the Owner Societies 2016 |

