 Open Access Article
Excited-state relaxation of the solar cell dye D49 in organic solvents and on mesoporous Al2O3 and TiO2 thin films†
Oliver
Flender‡
,
Mirko
Scholz‡
,
Johannes R.
Klein
,
Kawon
Oum
* and
Thomas
Lenzer
*
Universität Siegen, Physikalische Chemie, Adolf-Reichwein-Str. 2, 57076 Siegen, Germany. E-mail: oum@chemie.uni-siegen.de; lenzer@chemie.uni-siegen.de
First published on 9th September 2016
Abstract
We present an ultrafast UV-Vis-NIR transient absorption study of the donor–acceptor solar-cell dye D49 in diisopropyl ether, THF and acetonitrile, as well as on mesoporous Al2O3 and TiO2 thin films. Photoexcitation at 505 nm initially populates the first electronically excited state of the dye having significant intramolecular charge transfer character (“S1/ICT”). On Al2O3 and in the three organic solvents, the dynamics are fully explained in terms of S1/ICT stabilisation (by reorientation of adjacent solvent or D49 molecules and collisional cooling), intramolecular vibrational redistribution and S1/ICT → S0 electronic decay. A substantial decrease of the S1/ICT lifetime is observed with increasing polarity of the surrounding medium suggesting an acceleration of internal conversion. In agreement with these results, the addition of the nonpolar co-adsorbent deoxycholic acid (DCA) to the Al2O3 surface leads to a substantial increase of the S1/ICT lifetime. DCA spacers reduce the local polarity around the dye molecules, thus interrupting D49 “self-solvation”. These results are in contrast to a recent experimental study for the indoline dye D131 on Al2O3, where charge transfer from electronically excited D131 to adjacent dye molecules was proposed (Cappel et al., Sci. Rep., 2016, 6, 21276). We do not see evidence for charge transfer processes between D49 molecules and also not for electron injection from D49 into Al2O3 trap states. Charge separation is only observed for D49 bound to TiO2 thin films, with efficient injection of electrons into the conduction band of the semiconductor via formation of a [D49˙+⋯e−] complex and a transient Stark effect signalling the formation of mobile electrons upon dissociation of the complex.
1. Introduction
Efficient photoinduced electron injection from appropriate dyes into mesoporous TiO2 or ZnO semiconductor oxide thin films is the key step for initial charge separation in dye-sensitised solar cells (DSCs).1 Frequently, metal-free organic donor–acceptor dyes, such as substituted indolines2–4 or triarylamine–thiophenylcyanoacrylic acids,5,6 are employed as photosensitisers. The dynamics of the initial charge separation event is conveniently followed by transient absorption spectroscopy. From such data one obtains timescales for electron injection and migration as well as the spectra of the transient species involved.7–18Mesoporous thin films of large band-gap oxide materials, such as Al2O3, have been employed as reference systems for studying the dynamics of solar cell dyes under “non-injecting” conditions.16,17,19–21 For instance, the results of transient absorption experiments suggest that triarylamine–benzothiazole sensitisers inject electrons into Al2O3 surface trap states.17 Very recently, Cappel et al. proposed a mechanism, in which photoexcited D131 indoline dyes bound to Al2O3 exhibit efficient charge transfer to neighbouring D131 molecules. The formation of a D131˙+ radical cation and a D131˙− radical anion with an efficiency of up to 80% at high surface concentrations of the dye was claimed, yet no fingerprints of the radical anion have been found in the transient spectra.22 Such a process may be regarded as a special type of hole transfer event relevant to the understanding of dye regeneration processes in DSCs.
Here, we present a broadband (350–1600 nm) transient absorption study of the donor–acceptor dye D49 (Fig. 1) in organic solvents, on Al2O3 thin films (with or without the co-adsorbent deoxycholic acid (3α,12α-dihydroxy-5β-cholan-24-oic acid = “DCA”, Fig. 1)) and on mesoporous TiO2 surfaces. Investigations in diisopropyl ether, THF and acetonitrile clarify the polarity-dependent spectra and relaxation time constants of the isolated electronically excited dye. These data then serve as a basis to understand the photoinduced dynamics observed on the Al2O3 and TiO2 thin films.
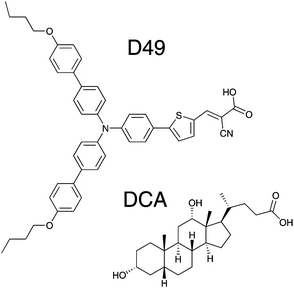 | ||
| Fig. 1 Chemical structures of the donor–acceptor dye D49 and the co-adsorbent 3α,12α-dihydroxy-5β-cholan-24-oic acid (DCA). | ||
2. Experimental
2.1 Chemicals and preparation of thin films
The dye D49 ((E)-3-(5-(4-(bis(4′-butoxy-[1,1′-biphenyl]-4-yl)amino)phenyl)thiophen-2-yl)-2-cyanoacrylic acid) was purchased from Dyenamo. Additional D49 samples for the measurements, synthesised by E. Gabrielsson and L. Sun (KTH Stockholm, Sweden), were kindly provided by G. Boschloo (University of Uppsala).23 Mesoporous Al2O3 and TiO2 thin films with a thickness of ca. 2 μm (ca. 500 nm for the spectroelectrochemistry experiments on TiO2) were prepared on microscope glass slides (BMS) or fluorine doped tin oxide (FTO) glass (Solaronix, TCO10-10) as described in our previous publications.13–15 Thin films were sensitised by placing them in a 50 μM solution of D49 in acetonitrile until the desired optical density (OD) was reached, followed by rinsing with acetonitrile to remove free D49.In additional experiments, the ratio of the D49 sensitiser and the co-adsorbent DCA was varied. Two different methods were employed: in the “two-step” method, the thin films were first saturated with the co-adsorbent by placing them in a 5.0 × 10⁻³ M solution of DCA in i-propanol for two days. Afterwards, DCA-coated thin films were dipped into a 2.7 × 10⁻⁵ M solution of D49 in i-propanol until the desired OD of D49 was reached. In the “one-step” method, thin films were dipped into solutions of either i-propanol or acetonitrile/tert-butanol (1![[thin space (1/6-em)]](https://www.rsc.org/images/entities/char_2009.gif) :
:![[thin space (1/6-em)]](https://www.rsc.org/images/entities/char_2009.gif) 1 by volume) containing specific DCA
1 by volume) containing specific DCA![[thin space (1/6-em)]](https://www.rsc.org/images/entities/char_2009.gif) :
:![[thin space (1/6-em)]](https://www.rsc.org/images/entities/char_2009.gif) D49 mole ratios between 0
D49 mole ratios between 0![[thin space (1/6-em)]](https://www.rsc.org/images/entities/char_2009.gif) :
:![[thin space (1/6-em)]](https://www.rsc.org/images/entities/char_2009.gif) 1 and 400
1 and 400![[thin space (1/6-em)]](https://www.rsc.org/images/entities/char_2009.gif) :
:![[thin space (1/6-em)]](https://www.rsc.org/images/entities/char_2009.gif) 1 for 30–180 min, with the D49 concentration in the range (2.5–11) × 10−5 M.
1 for 30–180 min, with the D49 concentration in the range (2.5–11) × 10−5 M.
The substances diisopropyl ether (Merck, p.a., 99.0%), THF (Merck, Uvasol, 99.9%), acetonitrile (Fisher, HPLC gradient grade, 99.99%), i-propanol (Fisher, analytical reagent grade, 99.97%), tert-butanol (Alfa Aesar, 99.5%, anhydrous), acetic acid (Th. Geyer, p.a., 99.5%) and ferrocene (Alfa Aesar, high purity, 99.5%) were used as received.
2.2 Pump – supercontinuum probe (PSCP) spectroscopy
Ultrafast UV-Vis-NIR transient absorption spectra were recorded at 920 Hz repetition frequency on three different setups employing the PSCP technique.13,14,24–27 In the first setup,27,28 a multifilament Vis-NIR supercontinuum covering the wavelength range 500–920 nm was generated in a translating 2 mm thick CaF2 plate using a noncollinearly phase-matched optical parametric amplifier (NOPA) running at 630 nm (12 μJ pulse−1). The NOPA was driven by a regeneratively amplified titanium:sapphire system (Spectra-Physics Hurricane, 780 nm, 90 fs, 1 mJ pulse−1).In the second PSCP setup,29–32 a UV-Vis multifilament supercontinuum spanning a wavelength range of 260–660 nm was generated in a translating 2 mm thick CaF2 plate from the second harmonic (400 nm, 12 μJ pulse−1) of the fundamental beam of a regeneratively amplified titanium:sapphire system (Coherent Libra USP-HE, 800 nm, 50 fs, 3.5 mJ pulse−1).
In the third, a newly-established PSCP setup, a multifilament supercontinuum spanning a wavelength range of 820–1600 nm was generated in a 2 mm thick sapphire plate using 800 nm radiation (20 μJ pulse−1) from the same regeneratively amplified titanium:sapphire system used for UV-Vis supercontinuum generation.
In each setup, the supercontinuum was split up into a reference and probe beam path. Pump pulses at 505 nm (typical fluences: 0.45 mJ cm−2 for solvent experiments and 0.07–0.10 mJ cm−2 for thin film measurements) were generated using a NOPA and chopped at a frequency of 460 Hz. Pump and probe beams were polarised at a magic angle (54.7°). The cross-correlation was typically ca. 80 fs, and the determination of zero time delay was accurate within ca. 20 fs.
The pump and probe pulses were focused into a home-built contact cell15 accommodating the sensitised thin film in contact with nitrogen (Messer, 4.6). During the experiment, the contact cell was constantly moved in a plane perpendicular to the propagation axis of the probe beam (scanning area 2 × 2 mm2). For experiments in organic solvents, 10–15 mL of a nitrogen-saturated solution of D49 in diisopropyl ether, THF or acetonitrile was circulated through a flow cell with a path length of 1 mm, so that the sample volume was exchanged between subsequent pump–probe cycles. Solutions with a typical OD of 0.1 (at 505 nm, 1 mm path length) were used.
In both setups, the reference and probe beams were imaged onto the entrance slits of separate grating spectrographs and detected by 512 element Si or InGaAs photodiode array detectors. Single-shot baseline corrections were applied. Unless otherwise stated, a transient spectrum represents the average of three independent scans, each typically consisting of 1000 pump–probe cycles per delay time.
Steady-state absorption and fluorescence spectra were recorded on Varian Cary 5000 and Agilent Cary Eclipse spectrometers, respectively. For fluorescence measurements, the samples were excited at 454 nm. A small amount (≤0.2 vol%) of acetic acid was added to the solutions to avoid any deprotonation of D49. We carefully checked that this small amount had no influence on the absorption/fluorescence properties of the neutral dye. Slit widths for excitation/emission were 2.5 or 5.0 nm.
2.3 PSCP data treatment and global kinetic analysis
The PSCP spectra were chirp-corrected using the coherent response of pure solvents or thin films. In organic solvents, the UV-Vis coherent signals were subtracted from the transient absorption data of D49 to obtain the pure dynamics of the dye. Solvent contributions in the NIR and thin film contributions over the whole spectral range were so weak that they were neglected during analysis.UV-Vis and NIR PSCP data sets were subjected to a global modelling procedure13,26,33 employing the kinetic schemes discussed below. Species-associated spectra were parametrised by a sufficient number of Gaussian functions, including a possible time dependence of the parameters, e.g. to describe continuous solvation band shifts. The lifetimes as well as the position, width and height of the Gaussian functions were optimised simultaneously to arrive at the best fit, which included convolution with the experimental time response. The latter one was determined from the transient absorption signal of the pure solvents or thin films.
2.4 Spectroelectrochemistry
Details of our setup for spectroelectrochemistry employing a Metrohm Autolab PGSTAT 101 potentiostat were described previously.14 The oxidation of D49 was investigated on TiO2 thin films deposited on FTO glass in contact with nitrogen-purged acetonitrile containing 100 mM tetrabutylammonium perchlorate as the supporting electrolyte. A newly developed spectroelectrochemical cell was used. It consisted of a 10 mm × 10 mm quartz cuvette, covered by a polyether ether ketone (PEEK) cap with feedthroughs. A brass clamp attached to the cap accommodated the dye-sensitised mesoporous TiO2 film on FTO glass as the working electrode. A platinum wire coiled up on a stainless steel bar served as the counter-electrode and a silver wire was used as the pseudoreference electrode.2.5 DFT/TDDFT calculations
Calculations for neutral D49, the radical cation D49˙+ and the radical anion D49˙− were carried out using procedures described in our previous publications:14,15 briefly, the structure of each ground electronic state was optimised using DFT employing the B3LYP functional and a 6-31G(d) basis set. Energies of the excited states (vertical excitation) were determined by TDDFT using the MPW1K functional and a 6-31+G(d) basis set. The MPW1K functional was chosen because it provides reasonable accuracy for the excited state transitions of solar cell donor–acceptor dyes.13,14,34 The PCM solvent model was employed for acetonitrile.3. Results and discussion
3.1 Steady-state spectra
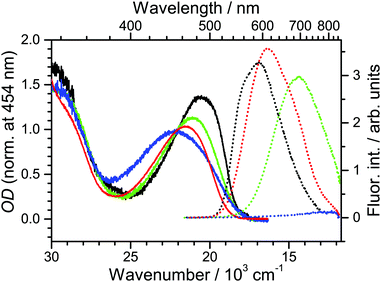
Steady-state absorption and fluorescence spectra of D49 are presented in Fig. 2 for the solvents n-hexane, diisopropyl ether, THF and acetonitrile. Deprotonation of the dye in the low-concentration solutions used in the fluorescence experiments was suppressed by adding a small amount of acetic acid (Fig. S1 and S2, ESI†). Also, we did not find any indications for dye aggregation (Fig. S2, ESI†). The Stokes shift of D49 increases drastically with increasing polarity (3600, 5200, 6700 and 9800 cm−1). This suggests a strong intramolecular charge transfer (ICT) character in the first excited electronic state of D49, and therefore we denote it as S1/ICT. A similar behaviour was found previously by us for the related dye D35. In that case, DFT/TDDFT calculations showed that electron density moves from the triarylamine donor to the thiophenylcyanoacrylic acid acceptor upon photoexcitation.14In addition, the fluorescence intensity in acetonitrile drops considerably (shown by the blue dotted line). Assuming an only weakly solvent-dependent radiative rate constant, this suggests a strong reduction of the excited-state lifetime in highly polar solvents due to accelerated intramolecular nonradiative relaxation. The transient absorption experiments reported in Section 3.2 indeed find a fast IC channel S1/ICT → S0.
Fig. 3 contains steady-state absorption and fluorescence spectra of Al2O3 for different DCA![[thin space (1/6-em)]](https://www.rsc.org/images/entities/char_2009.gif) :
:![[thin space (1/6-em)]](https://www.rsc.org/images/entities/char_2009.gif) D49 ratios. Samples were prepared using the “two-step” method (Section 2.1) which provides much better spectral reproducibility than the “one-step” route (see ESI†). Starting from a DCA-saturated mesoporous Al2O3 thin film, the absorbance and fluorescence intensities of the samples increase from 1 to 60 min dipping time (black to green lines). D49 binds to the surface by adsorbing to empty places in between DCA or by exchange. Saturation of the absorbance signal is reached after three days (red line), accompanied by a reduction of the fluorescence signal for high-OD films. As will be shown below, the reduction of fluorescence is also due to polarity-induced acceleration of D49 nonradiative decay, in this case because of increased D49–D49 interactions at higher surface concentrations. Still, the main contribution to the fluorescence signal stems from D49 surrounded by DCA.
D49 ratios. Samples were prepared using the “two-step” method (Section 2.1) which provides much better spectral reproducibility than the “one-step” route (see ESI†). Starting from a DCA-saturated mesoporous Al2O3 thin film, the absorbance and fluorescence intensities of the samples increase from 1 to 60 min dipping time (black to green lines). D49 binds to the surface by adsorbing to empty places in between DCA or by exchange. Saturation of the absorbance signal is reached after three days (red line), accompanied by a reduction of the fluorescence signal for high-OD films. As will be shown below, the reduction of fluorescence is also due to polarity-induced acceleration of D49 nonradiative decay, in this case because of increased D49–D49 interactions at higher surface concentrations. Still, the main contribution to the fluorescence signal stems from D49 surrounded by DCA.
A cyclic voltammogram of D49 on mesoporous TiO2 is shown in Fig. S3 (ESI†), yielding an oxidation potential of 1.14 V vs. NHE. In Fig. 4 we display steady-state absorption spectra in the 600–1700 nm region obtained upon oxidation of D49 on TiO2/FTO (black line). A characteristic absorption band with a peak at 1145 nm is observed. It is assigned to the D0 → D1 transition of the radical cation D49˙+.15 The corresponding spectrum for D49˙+ in acetonitrile is shown for comparison. Here, the spectrum peaks at 1046 nm.15 The spectral shift is likely due to changes in the electronic structure arising from the different types of carboxyl functions and “solvent” environments. The full width at half maximum (FWHM) of the spectrum on TiO2 is 3190 cm−1 and thus larger than that in acetonitrile (2590 cm−1). It is likely that different binding sites on the surface lead to a larger inhomogeneous broadening of the spectrum.
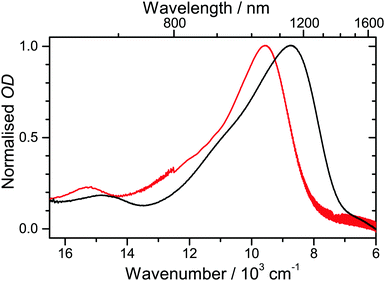 | ||
| Fig. 4 Comparison of radical cation spectra from spectroelectrochemistry: (black) D49˙+ on TiO2/FTO and (red) D49˙+ in acetonitrile (adapted from ref. 15). | ||
3.2 Ultrafast photoinduced dynamics of D49 in organic solvents and on mesoporous Al2O3 and TiO2 thin films
UV-Vis-NIR broadband transient absorption spectra obtained after laser excitation at 505 nm (S0 → S1/ICT) in the organic solvents diisopropyl ether, THF and acetonitrile and on mesoporous Al2O3, Al2O3/DCA and TiO2 are shown in Fig. 5(A–F) as contour plots. The corresponding sets of broadband PSCP spectra can be found in Fig. S4–S9 (ESI†). The results of global modelling are summarised in Table 1. A comparison of transient spectra and selected kinetic traces including fit lines is shown in Fig. 6. We commence with the dynamics of D49 in organic solvents and discuss its transient spectra on thin films afterwards.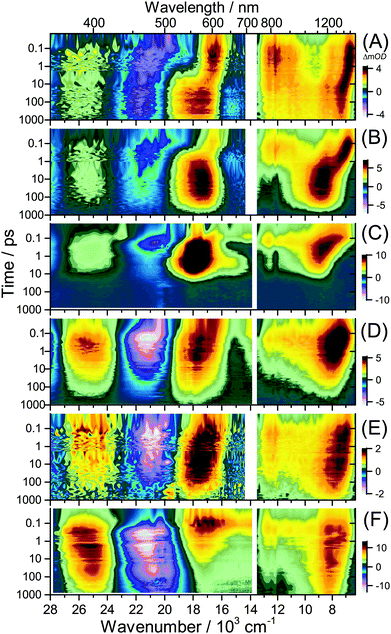 | ||
| Fig. 5 Contour plots of PSCP spectra for D49. (A) Diisopropyl ether, (B) THF, (C) acetonitrile, (D) Al2O3, (E) Al2O3/DCA, and (F) TiO2. | ||
| Solvent/thin film | Δfa | τ(ICT)b (ps) | τ(S1)b (ps) | Φ (S1)c | τ av (ps) | τ 1 (ps) | τ 2 (ps) |
|---|---|---|---|---|---|---|---|
| a Solvent dipolarity Δf = R(ε) − R(n) = (ε − 1)/(ε + 2) − (n2 − 1)/(n2 + 2); ε = dielectric constant, n = refractive index. Δf values are taken from ref. 32. b τ(S1) and τ(ICT) represent the lifetime of the S1 and ICT species, respectively. For diisopropyl ether and THF there is no experimental indication for separate S1 and ICT species. Therefore we assume a single S1/ICT state with a lifetime τ(S1/ICT). c Quantum yield for initial formation of the S1 species. For the thin films, the biexponential character might also reflect site-specific polarity. d Average relaxation time τav = Φ(S1)·τ(S1) + (1 − Φ(S1))·τ(ICT). e Time constants describing band shape changes mainly due to solvation and also intramolecular vibrational redistribution. Components with time constants of several ps likely also reflect collisional cooling. Values for acetonitrile are taken from ref. 36, see Section 3.4. f Time constants τComplex for separation of the initially formed radical cation–electron complex [D49˙+⋯e−] and its intramolecular vibrational redistribution τIVR. τComplex also describes spectral changes due to the transient Stark effect which indicates formation of mobile electrons in the TiO2 conduction band. g Lifetime τCat of the radical cation D49˙+ and slower band shape changes due to the transient Stark effect described by τStark. | |||||||
| Diisopropyl ether | 0.28 | 2900 | — | 2900 | 5.0 | 34 | |
| THF | 0.44 | 350 | — | 350 | 0.60 | 3.3 | |
| Acetonitrile | 0.71 | 8.8 | 1200 | 0.05 | 72 | 0.089 | 0.630 |
| Al2O3 | — | 94 | 1700 | 0.25 | 490 | 0.56 | 9.0 |
| Al2O3/DCA | — | 600 | 2800 | 0.48 | 1700 | 0.30 | 31 |
![[thin space (1/6-em)]](https://www.rsc.org/images/entities/char_2009.gif) :
:![[thin space (1/6-em)]](https://www.rsc.org/images/entities/char_2009.gif) GSB band ratio increases even further, in agreement with the higher solvent polarity. The shift and broadening dynamics of the S1/ICT band also accelerate; for a detailed analysis of the solvation contribution see Section 3.4. The decay time is 8.8 ps, and thus even shorter than in THF. We observe a 5% contribution of a second, long-lived component. Therefore, our global modelling for acetonitrile involves an initial branching into ICT and S1 species decaying independently to S0. The most likely explanation is a polarity-dependent barrier between S1 and ICT, which leads to initial trapping of a small part of the population in the long-lived higher-energy S1 part of the excited-state potential, with an estimated S1 lifetime of ca. 1200 ps.
GSB band ratio increases even further, in agreement with the higher solvent polarity. The shift and broadening dynamics of the S1/ICT band also accelerate; for a detailed analysis of the solvation contribution see Section 3.4. The decay time is 8.8 ps, and thus even shorter than in THF. We observe a 5% contribution of a second, long-lived component. Therefore, our global modelling for acetonitrile involves an initial branching into ICT and S1 species decaying independently to S0. The most likely explanation is a polarity-dependent barrier between S1 and ICT, which leads to initial trapping of a small part of the population in the long-lived higher-energy S1 part of the excited-state potential, with an estimated S1 lifetime of ca. 1200 ps.
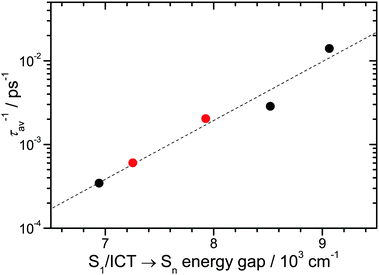
The correlation of the S1/ICT lifetime with polarity may be quantified in terms of the “energy gap law” of radiationless transitions:37–39 the lifetime should decrease with increasing polarity because of the decreasing S1/ICT–S0 energy gap. We already noted that this decrease is accompanied by a corresponding increase of the energy gap between S1/ICT and the upper state Sn of the NIR ESA transition. This is underlined by the blue-shift of this peak in Fig. 6(A). According to the energy gap law, the average rate constant (= inverse average lifetime) should show a dependence of the type log10(kav) = log10(τav−1) = A + B·E, where E is the energy gap, and A and B are fit parameters.37–39Fig. 7 shows such an energy gap law correlation for D49. Here we employed the NIR peak positions from Fig. 6(A) and average lifetimes τav = Φ(S1)·τ(S1) + (1 − Φ(S1))·τ(ICT) (Table 1), with Φ(S1) being the quantum yield for forming S1. The average lifetime should give the best representation of the overall excited-state decay. All data points are well described by the energy gap law expression (dashed line). According to the correlation, the average local polarity for closely-packed D49 on Al2O3 is smaller than for D49 in THF. The addition of DCA reduces the local polarity further and brings τav closer to the value for D49 in diisopropyl ether. This is reasonable considering the chemical structure of DCA (Fig. 1).
The PSCP spectra suggest the following series of events: photoexcitation generates instantaneously (within our time resolution) a close radical cation–electron complex [D49˙+⋯e−](TiO2). Although initial charge separation has therefore already happened, the broadened spectrum still resembles that of the S1/ICT state observed in organic solvents and on Al2O3. Afterwards, the electron separates from the radical cation core and becomes a “mobile” conduction band electron in TiO2: [D49˙+⋯e−](TiO2) → D49˙+ + e− (TiO2), see e.g. the spectra at 0.5–6 ps in Fig. S9 (ESI†). The dynamics involves a slight blue-shift of the NIR absorption band, a decay of absorption in the 550–1000 nm range and a red-shift of the GSB. The spectrum above 600 nm at 6 ps already resembles the D49˙+ spectrum from spectroelectrochemistry (Fig. 4), with a characteristic NIR peak and a long tail toward the visible region. According to the global kinetic analysis, the lifetime of the [D49˙+⋯e−] complex is τComplex = 3.1 ps. We assign an additional superimposed ultrafast change in the band shape to intramolecular vibrational redistribution (IVR) inside the complex with a time constant τIVR = 0.13 ps (Table 1).
From 20 ps onward, the amplitude of the bleach feature at 485 nm and of the absorption band at 400 nm decreases (Fig. S9 (ESI†), third panel). At the same time the 400 nm band and the GSB are continuously shifting to the red. We ascribe these pronounced dynamics in the GSB region of the spectrum to a transient Stark effect (=electrochromism):13–15,40,41 as the mobile electrons separate further from the stationary radical cations over time, the resulting electric field between D49˙+ and e−(TiO2) exerted on neighbouring ground state D49 molecules changes and also slowly decreases because the electrons are progressively screened inside the semiconductor. As shown previously by Cappel et al., the transient spectrum of the GSB region in the presence of a Stark shift should largely resemble the first derivative of the inverted steady-state absorption spectrum.40 The bottom panel of Fig. S9 (ESI†) shows that this is indeed the case (compare the green spectrum at 900 ps and the magenta dashed scaled derivative in the 450–550 nm range). The amplitude of the derivative-like feature is proportional to the amplitude of the electric field across the thin film.40 The decay of these spectral features and the slight red-shift of the UV-Vis ESA and GSB bands from 20 ps onward seen in Fig. 5(F) and Fig. S9 (ESI†) (third and fourth panels) must therefore arise from a decrease of the electric field strength due to electron screening. Global kinetic modelling provides a time constant of τStark = 210 ps for this process (Table 1). We note that the transient D49˙+ spectrum in the NIR at 1800 ps is slightly red-shifted compared with the spectrum from spectroelectrochemistry. This is likely due to the fact that the Stark effect also induces a weak shift of the radical cation D0 → D1 absorption. Our experiments suggest that the transient Stark effect is a sensitive spectral indicator for the initial formation of mobile electrons and the subsequent delocalisation of the conduction band electrons in TiO2. “Transient absorption Stark effect spectroscopy” therefore provides valuable information on electron relaxation timescales at the dye-semiconductor interface which is complementary to data from time-resolved THz techniques.12
Electron–cation recombination occurs on much slower timescales and we estimate a radical cation lifetime of τCat = 3.2 ns for this process from the slow decay of the spectrum above 1 ns (Table 1).
3.3 No evidence for D49–D49 charge transfer on Al2O3
The data presented so far suggest that D49 in organic solvents and bound to an Al2O3 thin film only exhibits S1/ICT excited-state “solvation”, collisional relaxation and fluorescence/IC. We do not see photoinduced charge separation processes like on TiO2, in contrast to what was suggested previously for the indoline dye D131 on Al2O3.22 To further support this interpretation, we carried out DFT/TDDFT calculations for different dye species. The PCM solvent model was employed for acetonitrile. Calculated values are summarised in Table S1 (ESI†), and additional gas-phase results for D49 and D49˙+ can be found in our previous study.15 The transitions and their oscillator strengths (gas-phase values) are shown in Fig. 8 as stick spectra for D49 (black), D49˙+ (red) and D49˙− (green). The positions of the experimentally determined S0 → S1/ICT band of D49 (Fig. 2) and the D0 → D1 band of D49˙+ (Fig. 4) are very well reproduced. According to the calculations, one would expect that any spectral contributions of the radical anion D49˙−, produced via the hypothetical charge transfer process D49(S1/ICT) + D49(S0) → D49˙+ + D49˙−,22 would show up as a strong band around 510 nm in the PSCP spectra. At the same time, this charge transfer step would bleach additional D49(S0) molecules and remove S1/ICT population. Assuming e.g. 80% efficiency of this process claimed for indoline D131 on Al2O3 at “full coverage”,22 this should increase the amplitude of the GSB around 480 nm by about a factor of two, and the S1/ICT ESA band at 580 nm should disappear almost completely. All of this should happen with an expected time constant of >7 ps.22 There is clearly no indication for such a process in our PSCP spectra. We therefore conclude that an intermolecular D49–D49 charge transfer channel is not operative on mesoporous Al2O3. Instead the spectral changes are fully explained by intramolecular S1/ICT excited state dynamics of the dye under the influence of the solvent environment.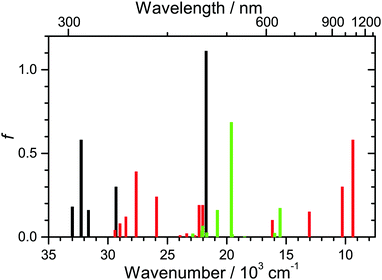 | ||
| Fig. 8 Oscillator strengths f (gas-phase values) for the five energetically lowest S0 → Sn transitions of neutral D49 (black), the fifteen energetically lowest D0 → Dn transitions of the radical cation D49˙+ (red), and the ten energetically lowest D0 → Dn transitions of the radical anion D49˙− (green). Values for D49 and D49˙+ are taken from ref. 15. | ||
3.4 A closer look at the solvation dynamics of D49
Solvation dynamics of dye molecules in their excited state is usually monitored by ultrafast fluorescence techniques, such as broadband fluorescence up-conversion spectroscopy (FLUPS), where the time-resolved fluorescence response of the sample is detected by optical gating.42,43 Transient shifts of SE or ESA bands in broadband transient absorption spectra carry the same information, however their evaluation often becomes complicated due to the presence of overlapping ESA bands. This requires careful deconvolution of the time-resolved spectra.35,44Here we demonstrate that the problem of spectral overlap can be resolved by monitoring the dynamics of the lowest-energy ESA transition located in the NIR region which is well separated from the rest of the electronic spectrum. As an example, Fig. 9(A) contains a set of PSCP spectra for the spectral development of the NIR ESA transition of D49 in acetonitrile between 0.10 and 19.9 ps. The initially broad and asymmetric electronic band moves to shorter wavelengths, narrows and becomes more symmetric. For the analysis of this solvation dynamics we fit the transient bands to a log-normal function, resulting in the respective solid fit lines.36,45
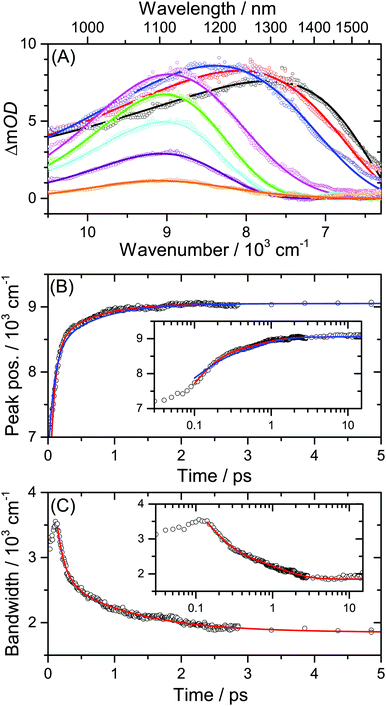 | ||
| Fig. 9 Solvation dynamics of the solar cell dye D49 in acetonitrile. (A) NIR PSCP spectra at 0.10, 0.15, 0.20, 1.0, 2.5, 4.9, 9.9 and 19.9 ps (from right to left) including log-normal fits. (B) Blue-shift of the NIR ESA band peak with time. Solid lines are biexponential fits from this work (red line) and Horng et al. for Coumarin 153/acetonitrile from ref. 36 (blue line). (C) Change of the bandwidth of the NIR ESA band with time including a biexponential fit (red line). The insets in (B) and (C) show the dynamics on a logarithmic timescale up to 15 ps. | ||
The temporal changes of the peak frequency and bandwidth are plotted in panels (B) and (C). We describe these by biexponential fits starting from 0.10 ps, as it is usually practiced in the evaluation of solvation dynamics experiments.45,46 In (B), the blue line corresponds to a constrained fit employing the time constants and amplitudes from the work of Horng et al. for Coumarin 153 in acetonitrile (τ1 = 0.089 ps, A1 = 0.686, τ2 = 0.630 ps, A2 = 0.314).36 The agreement is very good, especially considering the fact that there could be small differences in the measured solvation times due to the different molecular structure of the solvation probe.46 Using a free biexponential fit (red line) we obtain similar time constants and amplitudes: τ1 = 0.07 ps (A1 = 0.82) and τ2 = 0.58 ps (A2 = 0.18).
In (C), the initial increase of the width of the ESA band on a 100 fs timescale is likely due to IVR in the S1/ICT state of D49.36,45 The decrease of the bandwidth at later times is well described by a biexponential function. We obtain the values τ1 = 0.12 ps (A1 = 0.74) and τ2 = 1.1 ps (A2 = 0.26). The underlying processes are also dominated by IVR, with the slower component containing contributions of cooling processes in the excited state.45
This example suggests that the NIR band-shift and broadening dynamics of D49 in organic solvents and on Al2O3 are dominated by solvation processes superimposed by contributions of IVR and collisional cooling. Such background-free transient absorption spectroscopy of ESA transitions in the NIR range turns out to be a powerful tool for studying solvation dynamics of molecular probes, complementary to broadband fluorescence up-conversion spectroscopy.
4. Conclusions
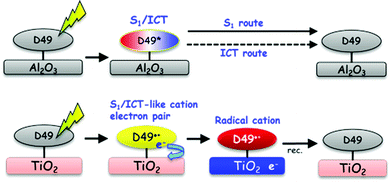
Our investigations of the excited-state dynamics of the solar cell dye D49 by UV-Vis-NIR transient absorption spectroscopy revealed the following photoinduced processes:In organic solvents and on Al2O3, relaxation arises from the S1/ICT → S0 electronic decay, with contributions from radiative (fluorescence) and nonradiative (IC) channels. As the polarity of the dye's surrounding increases, nonradiative decay by IC strongly accelerates. This behaviour is successfully modelled in terms of an energy gap law approach. Biexponential decays of D49 observed in polar environments suggest that the S1 and ICT populations decay independently (i.e. S1 → S0 and ICT → S0). This is likely due to a sufficiently high energy barrier suppressing interconversion between the S1 and ICT species, as known from other molecular systems, such as all-trans retinal.32 The biexponential decay observed for D49 on Al2O3 also contains contributions from surface inhomogeneity resulting in a range of adsorption sites of different local polarity. The local polarity around the dye on Al2O3 is efficiently reduced by introducing nonpolar DCA spacer molecules. We observe solvation dynamics of the dye in all organic solvents and on Al2O3. As an example, the solvation time constants and amplitudes in acetonitrile are in very good agreement with those obtained for the “gold standard”47 solvation probe Coumarin 153. On Al2O3, “self-solvation” of D49 is observed and arises from the restricted movements of adsorbed dye or DCA spacer molecules. We do not see any evidence for charge transfer processes between D49 molecules and also no indication for electron injection into Al2O3 trap states. Based on our current findings for D49, the intermolecular charge-transfer mechanism between adjacent indoline D131 dye molecules proposed in ref. 22 should be re-examined, as there might be an alternative explanation based on the mechanism shown in Fig. 10 (top).
The UV-Vis-NIR coverage of the transient absorption spectra provides a detailed picture of the ultrafast electron injection mechanism of D49 into the conduction band of TiO2. An immediately formed radical cation–electron complex separates into D49˙+ and mobile electrons. The appearance of mobile electrons is tracked by the transient Stark effect signalling the build-up of an electric field at the interface which induces characteristic shifts of the ground state D49 and radical cation spectra on picosecond timescales. This completely different behaviour of D49 on “injecting” TiO2 and “non-injecting” Al2O3 thin films is summarised by the illustration in Fig. 10.
Acknowledgements
K. O. and T. L. thank the German Science Foundation (DFG) for financial support of this work through grants OU 58/10-1 and LE 926/11-1. We acknowledge G. Boschloo, E. Gabrielsson and L. Sun (University of Uppsala) for providing a high purity D49 sample for the current experiments. We thank J. Weber and J. Schmedt auf der Günne (University of Siegen) for providing the oven for sintering the mesoporous Al2O3 and TiO2 layers. We also thank N. P. Ernsting (Humboldt University Berlin, Germany) and J. L. Pérez Lustres (University of Santiago de Compostela, Spain) as well as J. Troe, K. Luther, J. Schroeder, D. Schwarzer and A. M. Wodtke (Georg August University Göttingen, Germany) for their continuous support and advice.References
- A. Hagfeldt, G. Boschloo, L. Sun, L. Kloo and H. Pettersson, Chem. Rev., 2010, 110, 6595 CrossRef CAS PubMed.
- T. Horiuchi, H. Miura and S. Uchida, Chem. Commun., 2003, 3036 RSC.
- T. Horiuchi, H. Miura, K. Sumioka and S. Uchida, J. Am. Chem. Soc., 2004, 126, 12218 CrossRef CAS PubMed.
- S. Ito, S. M. Zakeeruddin, R. Humphry-Baker, P. Liska, R. Charvet, P. Comte, M. K. Nazeeruddin, P. Péchy, M. Takata, H. Miura, S. Uchida and M. Grätzel, Adv. Mater., 2006, 18, 1202 CrossRef CAS.
- S. M. Feldt, E. A. Gibson, E. Gabrielsson, L. Sun, G. Boschloo and A. Hagfeldt, J. Am. Chem. Soc., 2010, 132, 16714 CrossRef CAS PubMed.
- D. P. Hagberg, X. Jiang, E. Gabrielsson, M. Linder, T. Marinado, T. Brinck, A. Hagfeldt and L. Sun, J. Mater. Chem., 2009, 19, 7232 RSC.
- R. Huber, J.-E. Moser, M. Grätzel and J. Wachtveitl, J. Phys. Chem. B, 2002, 106, 6494 CrossRef CAS.
- G. Benkö, J. Kallioinen, J. E. I. Korppi-Tommola, A. P. Yartsev and V. Sundström, J. Am. Chem. Soc., 2002, 124, 489 CrossRef.
- A. Furube, R. Katoh, K. Hara, S. Murata, H. Arakawa and M. Tachiya, J. Phys. Chem. B, 2003, 107, 4162 CrossRef CAS.
- A. Furube, R. Katoh, T. Yoshihara, K. Hara, S. Murata, H. Arakawa and M. Tachiya, J. Phys. Chem. B, 2004, 108, 12583 CrossRef CAS.
- B. Wenger, M. Grätzel and J.-E. Moser, J. Am. Chem. Soc., 2005, 127, 12150 CrossRef CAS PubMed.
- H. Nemec, J. Rochford, O. Taratula, E. Galoppini, P. Kuzel, T. Polívka, A. Yartsev and V. Sundström, Phys. Rev. Lett., 2010, 104, 197401 CrossRef CAS PubMed.
- K. Oum, P. W. Lohse, O. Flender, J. R. Klein, M. Scholz, T. Lenzer, J. Du and T. Oekermann, Phys. Chem. Chem. Phys., 2012, 14, 15429 RSC.
- K. Oum, P. W. Lohse, J. R. Klein, O. Flender, M. Scholz, A. Hagfeldt, G. Boschloo and T. Lenzer, Phys. Chem. Chem. Phys., 2013, 15, 3906 RSC.
- K. Oum, O. Flender, P. W. Lohse, M. Scholz, A. Hagfeldt, G. Boschloo and T. Lenzer, Phys. Chem. Chem. Phys., 2014, 16, 8019 RSC.
- O. Flender, P. W. Lohse, J. Du, T. Oekermann, M. Scholz, K. Oum and T. Lenzer, Z. Phys. Chem., 2015, 229, 1907 CrossRef CAS.
- M. Fakis, P. Hrobárik, O. Yushchenko, I. Sigmundová, M. Koch, A. Rosspeintner, E. Stathatos and E. Vauthey, J. Phys. Chem. C, 2014, 118, 28509 CAS.
- E. Rohwer, I. Minda, G. Tauscher, C. Richter, H. Miura, D. Schlettwein and H. Schwoerer, ChemPhysChem, 2015, 16, 943 CrossRef CAS PubMed.
- C. Martín, M. Ziółek, M. Marchena and A. Douhal, J. Phys. Chem. C, 2011, 115, 23183 Search PubMed.
- M. Fakis, E. Stathatos, G. Tsigaridas, V. Giannetas and P. Persephonis, J. Phys. Chem. C, 2011, 115, 13429 CAS.
- M. Wielopolski, J.-H. Kim, Y.-S. Jung, Y.-J. Yu, K. Y. Kay, T. W. Holcombe, S. M. Zakeeruddin, M. Grätzel and J.-E. Moser, J. Phys. Chem. C, 2013, 117, 13805 CAS.
- U. B. Cappel, D. Moia, A. Bruno, V. Vaissier, S. A. Haque and P. R. F. Barnes, Sci. Rep., 2016, 6, 21276 CrossRef CAS PubMed.
- Y. Hao, E. Gabrielsson, P. W. Lohse, W. Yang, E. M. J. Johansson, A. Hagfeldt, L. Sun and G. Boschloo, Adv. Sci., 2015, 2, 1500174 CrossRef.
- A. L. Dobryakov, S. A. Kovalenko, A. Weigel, J. L. Pérez Lustres, J. Lange, A. Müller and N. P. Ernsting, Rev. Sci. Instrum., 2010, 81, 113106 CrossRef CAS PubMed.
- P. W. Lohse, J. Kuhnt, S. I. Druzhinin, M. Scholz, M. Ekimova, T. Oekermann, T. Lenzer and K. Oum, Phys. Chem. Chem. Phys., 2011, 13, 19632 RSC.
- K. Golibrzuch, F. Ehlers, M. Scholz, R. Oswald, T. Lenzer, K. Oum, H. Kim and S. Koo, Phys. Chem. Chem. Phys., 2011, 13, 6340 RSC.
- T. Lenzer, S. Schubert, F. Ehlers, P. W. Lohse, M. Scholz and K. Oum, Arch. Biochem. Biophys., 2009, 483, 213 CrossRef CAS PubMed.
- J. R. Klein, O. Flender, M. Scholz, K. Oum and T. Lenzer, Phys. Chem. Chem. Phys., 2016, 18, 10800 RSC.
- K. Oum, T. Lenzer, M. Scholz, D. Y. Jung, O. Sul, B. J. Cho, J. Lange and A. Müller, J. Phys. Chem. C, 2014, 118, 6454 CAS.
- L. F. Tietze, B. Waldecker, D. Ganapathy, C. Eichhorst, T. Lenzer, K. Oum, S. O. Reichmann and D. Stalke, Angew. Chem., Int. Ed., 2015, 54, 10317 CrossRef CAS PubMed.
- O. Flender, J. R. Klein, T. Lenzer and K. Oum, Phys. Chem. Chem. Phys., 2015, 17, 19238 RSC.
- O. Flender, M. Scholz, J. Hölzer, K. Oum and T. Lenzer, Phys. Chem. Chem. Phys., 2016, 18, 14941 RSC.
- T. Lenzer, F. Ehlers, M. Scholz, R. Oswald and K. Oum, Phys. Chem. Chem. Phys., 2010, 12, 8832 RSC.
- M. Pastore, E. Mosconi, F. De Angelis and M. Grätzel, J. Phys. Chem. C, 2010, 114, 7205 CAS.
- J. Ruthmann, S. A. Kovalenko, N. P. Ernsting and D. Ouw, J. Chem. Phys., 1998, 109, 5466 CrossRef CAS.
- M. L. Horng, J. A. Gardecki, A. Papazyan and M. Maroncelli, J. Phys. Chem., 1995, 99, 17311 CrossRef CAS.
- R. Englman and J. Jortner, Mol. Phys., 1970, 18, 145 CrossRef CAS.
- V. Chynwat and H. A. Frank, Chem. Phys., 1995, 194, 237 CrossRef CAS.
- F. Ehlers, D. A. Wild, T. Lenzer and K. Oum, J. Phys. Chem. A, 2007, 111, 2257 CrossRef CAS PubMed.
- U. B. Cappel, S. M. Feldt, J. Schöneboom, A. Hagfeldt and G. Boschloo, J. Am. Chem. Soc., 2010, 132, 9096 CrossRef CAS PubMed.
- S. Ardo, Y. Sun, A. Staniszewski, F. N. Castellano and G. J. Meyer, J. Am. Chem. Soc., 2010, 132, 6696 CrossRef CAS PubMed.
- X.-X. Zhang, C. Würth, L. Zhao, U. Resch-Genger, N. P. Ernsting and M. Sajadi, Rev. Sci. Instrum., 2011, 82, 063108 CrossRef PubMed.
- M. Gerecke, G. Bierhance, M. Gutmann, N. P. Ernsting and A. Rosspeintner, Rev. Sci. Instrum., 2016, 87, 053115 CrossRef PubMed.
- M. Sajadi, T. Obernhuber, S. A. Kovalenko, M. Mosquera, B. Dick and N. P. Ernsting, J. Phys. Chem. A, 2009, 113, 44 CrossRef CAS PubMed.
- M. Sajadi and N. P. Ernsting, J. Phys. Chem. B, 2013, 117, 7675 CrossRef CAS PubMed.
- M. Sajadi, M. Weinberger, H.-A. Wagenknecht and N. P. Ernsting, Phys. Chem. Chem. Phys., 2011, 13, 17768 RSC.
- M. Maroncelli, X.-X. Zhang, M. Liang, D. Roy and N. P. Ernsting, Faraday Discuss., 2012, 154, 409 RSC.
Footnotes |
| † Electronic supplementary information (ESI) available: Concentration-dependent steady-state absorption spectra of D49; cyclic voltammetry of D49; UV-Vis-NIR broadband transient absorption spectra of D49; comparison of D49-sensitised Al2O3 thin films with and without prior DCA saturation; one-step co-adsorption of D49 and DCA on Al2O3 thin films; results of DFT/TDDFT calculations for D49, D49˙− and D49˙+. See DOI: 10.1039/c6cp05167g |
| ‡ These authors contributed equally to this work. |
| This journal is © the Owner Societies 2016 |

