 Open Access Article
Creative Commons Attribution 3.0 Unported Licence
Mutagenic induction of an ultra-fast water-chain proton wire†
Vered
Wineman-Fisher
ab,
Ron
Simkovich
c,
Dan
Huppert
c,
Kristina
Trujillo
d,
S. James
Remington
d and
Yifat
Miller
*ab
aDepartment of Chemistry, Ben-Gurion University of the Negev, P.O. Box 653, Be'er Sheva 84105, Israel. E-mail: ymiller@bgu.ac.il; Fax: +972-86428709; Tel: +972-86428705
bIlse Katz Institute for Nanoscale Science and Technology, Ben-Gurion University of the Negev, Beér-Sheva 84105, Israel
cRaymond and Beverly Sackler Faculty of Exact Sciences, School of Chemistry, Tel Aviv University, Tel Aviv 69978, Israel
dDepartment of Physics and Institute of Molecular Biology, University of Oregon, Eugene, USA
First published on 1st August 2016
Abstract
Replacement of the hydroxyl group of a hydrophilic sidechain by an H atom in the proton wire of GFP induces formation of a water-chain proton wire. Surprisingly, this “non-native” water chain functions as a proton wire with response times within 10 ps of the wild type protein. This remarkable rate retention is understood as a natural consequence of the well-known Grotthuss mechanism of proton transfer in water.
Introduction
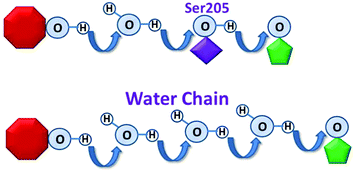
In many proteins, proton transfers occur within predefined “proton wires”, and are essential to numerous important biochemical processes.1–7 Typically, the proton wire involves well defined, precisely arranged amino acid side chains 1–7 while in other cases, the proton wire involves water-side chain hydrogen bonds that are presumably less well organized.8–11 Despite the innumerable documented examples of proton transfers that occur via amino acid side chains, and a handful that involve water-chains,8–11 it has yet to be demonstrated that an amino-acid based proton wire can be replaced by a functional water-chain wire.We herein use the green fluorescent protein (GFP) in an un-precedent fashion as an ultra-fast probe for investigating the activity of a mutagenically induced “water-chain” proton wire. This is achieved by replacing the hydroxyl group of the hydrophilic side chain Ser205 by the hydrogen atom of the smallest side chain Gly, i.e. S205G. This replacement led to a cavity in the proton wire domain that is then now occupied by water molecules from the interior β-barrel of the GFP. These water molecules function as an ultra-fast water chain in the proton wire domain (Fig. 1).
During fluorescence emission, wild-type (wt)-GFP exhibits well documented ultrafast, excited state proton transfer. A proton is transported within several ps (biphasic, rates ∼3 and ∼12 ps)12 from the excited state of the chromophore via a bound water molecule and Ser205 to the acceptor, a carboxylate oxygen of Glu222 (Fig. 1).13–18 Ultrafast spectroscopy, combined with crystal structure and molecular dynamics analyses in wild type and mutant GFP allows us to alter and measure proton transfer rates, leading to a deeper understanding of the mechanisms of proton transfer.4,19–28
Mutagenesis of GFP in the vicinity of the proton wire domain, such as replacement of the hydroxyl group of Ser205 (Fig. 1) and or the side chain of Thr203 by a hydrophobic isopropyl or methyl group (Val or Ala) resulted in substantial (up to 30-fold) reduction of proton transfer rates.4,17,28 On the other hand, simultaneous replacement of Ser205 by Ala and Thr203 by Val had a different result: a rearranged proton wire 21 which involved water molecules infrequently entering from the bulk, leading to a 350-fold reduction of the proton transfer rate compared to wt-GFP. However the general trend is that replacements of hydrophilic side chains by hydrophobic side chains dramatically decreases the proton transfer rates. This led us to investigate a different approach, namely to remove the intermediate side chain altogether. The resultant cavity is occupied by water molecules, which we herein show function as an ultrafast water-chain proton wire.
Materials and methods
Mutagenesis, protein expression, and crystallization
The S205G mutation was introduced into GFP and protein was prepared as previously described for the mutant S205V.22 Mutations were verified by sequencing the entire gene. Rectangular prismatic crystals of S205G were obtained in 2 days by hanging drop vapor diffusion. Crystallization setups consisted of 3 μl drops containing one part protein solution (A280 = 18.0) in 50 mM Hepes, pH 7.9, 0.3 M NaCl and one part well solution. Crystals of S205G grew best against well solutions of 2.0 M malic acid, pH 8.0, 0.1 M Tris, with a 10% drop volume additive of 60 mM detergent (n-nonyl-β-D-maltoside).Data collection and structure solution
X-ray diffraction data were collected at 100 K to 2.49 Å resolution (limited by the crystalline order) using the in house Rigaku Raxis-IV. Diffraction images were integrated and the data were scaled using the HKL program suite (Table S2, ESI†). The structure of S205G was solved by molecular replacement using the EPMR program29 with WT-GFP (RCSB Protein Data Bank ID 1EMB) as a search model. The model was refined with the CCP4 suite of crystallographic programs30 Manual model building was conducted with the Coot program.31There are two independent but structurally very similar molecules of S205G in the asymmetric unit, with one molecule of malate (Fig. S1 and S2, ESI†) bound adjacent to the chromophore within each monomer. In each case, the side chain of Tyr145 swings out about 45 degrees, and the main chain at the site of the mutation 205 moves outward toward solvent to accommodate the bound malate molecule (Fig. S2, ESI†). A single molecule of the detergent n-nonyl-β-D-maltoside was identified, bound to a crevice at the interface between the two molecules in the asymmetric unit. Final model statistics are satisfactory and are presented in Table S2 (ESI†).
Steady state spectroscopy
The steady-state absorption spectra were recorded by a Horiba Jobin Yvon FluoroMax-3 spectrofluorometer.Time-resolved emission spectroscopy
The fluorescence up-conversion technique was employed in this study to measure the time-resolved emission of wt-GFP and S205G GFP mutant at room temperature. The laser used for the fluorescence up-conversion was a cavity-dumped Ti:sapphire femtosecond laser, (Mira, Coherent), which provides short, 150 fs, pulses at about 800 nm. The cavity dumper operated with a relatively low repetition rate of 800 kHz. The up-conversion system (FOG-100, CDP, Russia) operated at 800 kHz. The samples were excited by pulses of ∼8 mW on average at the SHG frequency. The time response of the up-conversion system is evaluated by measuring the relatively strong Raman-Stokes line of water shifted by 3600 cm−1. It was found that the Full width at half maximum (fwhm) of the signal is 250 fs. Samples were placed in a rotating optical cell to avoid degradation. We found that, during our five-minute time-resolved measurements in a cell rotating at a frequency of 10 Hz, the degradation of the sample was marginal, and had no effect on the signal's decay profile. Experiments were carried out on samples of concentrations of about 1 mM or less.Kinetic isotope effect (KIE) – estimation of rates
The kinetic isotope effect (KIE) is defined as the ratio of rate constants with and without isotopic substitution. The kinetic isotope effect is a fingerprint of an ESPT process and is found in all hydroxyaryl photoacids. In ESPT to water, the dissociation rate coefficient ratio in H2O and D2O is kH/kD, which is the value we use here and in the main manuscript.32,33 We use the spherical symmetric diffusion program (SSDP) developed by Krissnel and Agmon in order to fit the experimental results, and calculate kD or kH, and derive the KIE.34For wt-GFP the KIE is rather large, KIE ∼ 5. In bulk aqueous solution weak photoacids with pKa* > 0 exhibits a KIE of about 3. It is smaller for very strong photoacids with pKa* > 0–2. Fig. S3 (ESI†) shows the normalized steady state fluorescence spectrum of S205G in H2O and D2O on a semilogarithmic scale. The intensity ratio between the ROH band at 450 nm and the RO− band at 510 nm differs by a factor of 3 in D2O when compared with that obtained in H2O. This factor is approximately the kinetic isotope effect expected for an ESPT process to water.
Fig. S4 (ESI†) shows the time-resolved fluorescence of the ROH form of S205G mutant measured at 460 nm in both H2O and D2O solutions. As seen in the figure the fluorescence decay of the D2O sample is rather slower than that of the H2O sample. Fig. S5 (ESI†) shows the time-resolved emission of the RO− form of S205G mutant measured at 520 nm in both H2O and D2O samples. As expected, the rise of the signal of the D2O sample is much longer than that of the RO− S205G mutant signal in H2O.
Examining the role of the malate in the ESPT
We examined whether malate plays a role in the ESPT process. To this end we compared the spectroscopy measurements of the GFP S205G mutant without the malate to those of the wt-GFP. Time resolved emission spectra were obtained for S205G in solutions with varying concentrations of malate and compared to results obtained in the absence of malate. Fig. S6 and S7 (ESI†) illustrate that the time-resolved emission spectra of the ROH and the RO− forms of S205G are similar with or without malate at various concentrations, up to 3 M of malate. Furthermore, we found that the malate does not affect the fluorescence decay of the ROH form of the mutant up to a concentration of 1 M of malate (Fig. S7, ESI†), also at longer times (Fig. S8, ESI†). Finally, the steady state excitation and emission spectra of S205G in the presence of malate demonstrates similar bands to those obtained in the absence of malate (Fig. S9, ESI†). These results led us to conclude that the malate does not play a role in the ESPT process (at least up to 3 M), although the malate is near the chromophore and forms hydrogen bonds as observed from the crystal structure.Weller's formulation
Following Weller's formulation:35This equation neglects proton geminate recombination and assumes the same radiative life-time for both ROH and RO−.
Molecular dynamics (MD) simulations protocol
Molecular dynamics (MD) simulations were performed starting from the 5HZO Protein Data Bank entry for the S205G mutant of GFP. MD simulations of the solvated structures were performed in the NPT ensemble using the NAMD36 with the CHARMM27 force field.37 The structures were energy minimized and explicitly solvated in a TIP3P water box38,39 with a minimum distance of 15 Å from each edge of the box. Each water molecule within 2.5 Å of the protein was removed. Counter ions were added at random locations to neutralize the protein's charge. The Langevin piston method40,41 with a decay period of 100 fs and a damping time of 50 fs was used to maintain a constant pressure of 1 atm. The temperature 310 K was controlled by a Langevin thermostat with a damping coefficient of 10 ps. The short-range van der Waals (VDW) interactions were calculated using the switching function, with a twin range cutoff of 10.0 and 12.0 Å. Long-range electrostatic interactions were calculated using the particle mesh Ewald method with a cutoff of 12.0 Å.42,43 The equations of motion were integrated using the leapfrog integrator with a step of 1 fs. The counter ions and water molecules were allowed to move. The minimized solvated system was energy minimized for 5000 additional conjugate gradient steps and 20![[thin space (1/6-em)]](https://www.rsc.org/images/entities/char_2009.gif) 000 heating steps at 250 K, with all atoms allowed to move. Then, the system was heated from 250 to 310 K for 300 ps and equilibrated at 310 K for 300 ps. The simulation ran for 60 ns, as we previously performed for wt-GFP and other mutants.17,28 To examine whether the timescale of 60 ns of simulations is a reasonable timescale, we examined the root-mean square deviations (RMSDs) of the system along the time of the simulations (Fig. S10, ESI†). One can see from Fig. S10 (ESI†) that the system has been converged; therefore, these conditions (60 ns and 310 K) were carefully chosen for such systems.
000 heating steps at 250 K, with all atoms allowed to move. Then, the system was heated from 250 to 310 K for 300 ps and equilibrated at 310 K for 300 ps. The simulation ran for 60 ns, as we previously performed for wt-GFP and other mutants.17,28 To examine whether the timescale of 60 ns of simulations is a reasonable timescale, we examined the root-mean square deviations (RMSDs) of the system along the time of the simulations (Fig. S10, ESI†). One can see from Fig. S10 (ESI†) that the system has been converged; therefore, these conditions (60 ns and 310 K) were carefully chosen for such systems.
Results and discussion
Crystal structure of GFP S205G
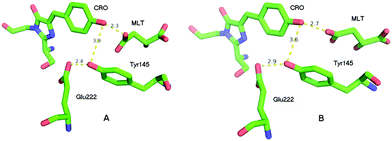
The crystal structure of the S205G mutant was determined to 2.5 Å resolution using crystals grown using sodium malate as the precipitant (SI text, PDB ID code: 5HZO). There are two independent but nearly identical protein molecules in the asymmetric unit. In each molecule, a significant conformational change involving Tyr145 opened a cavity adjacent to the chromophore, which was observed to contain a strong electron density feature unconnected to the protein. The features were adequately modeled as malate (Fig. S1 and S2, ESI†), however the malate molecules are not in a position to participate in the ESPT process, and there are no obvious candidates (including well-ordered water molecules) to substitute for the proposed functional role of the Ser205 hydroxyl group in wt-GFP.The overall crystal structure of the GFP S205G mutant is very similar to that previously described for wt-GFP, however, structural changes near the site of the mutation are clearly revealed by the electron density map. Fig. 2 shows excerpts from the A and B molecules in the asymmetric unit, and illustrates the chromophore cavity containing the proton wire region. In each case the presumed malate molecule is near the chromophore (CRO), with one oxygen making a presumed hydrogen bond with the chromophore hydroxyl, but not in a position to participate in ESPT to Glu222. While it is conceivable that the hydroxyl of Tyr145 could replace the functionality of the Ser205 hydroxyl in wt-GFP, the orientation is very poor and the distance between the CRO and the Tyr145 hydroxyl is too large for direct proton transfer.
The proton transfer process in GFP S205G is dramatically faster than other mutants and has closer rate to the wt-GFP
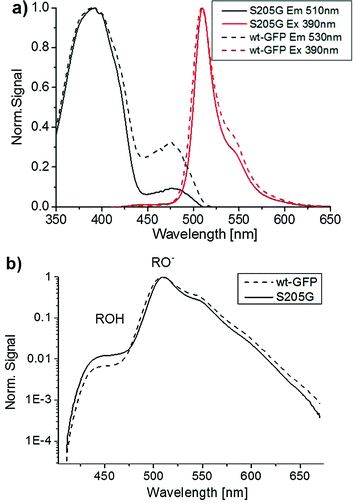
Time-resolved emission spectroscopy, ultrafast fluorescence up-conversion spectroscopy and steady-state excitation and emission spectroscopy have been applied to investigate the proton transfer rates in the GFP S205G with and without sodium malate in solution. Interestingly, these spectroscopic measurements demonstrated similar proton transfer rates, therefore indicating that malate has no detectable effect on the excited-state proton transfer (ESPT) process (Fig. S3–S7, ESI†).Fig. S5 (ESI†) shows the steady state excitation and emission spectra of the GFP S205G mutant. One can see that the fluorescence spectrum consists of a weak emission band of the ROH and a strong emission band of RO−. These results indicate an efficient ESPT process of the protonated chromophore in the S205G mutant. Time-resolved fluorescence of the mutant supports the assignment of an ESPT process of the excited chromophore and that the proton transfer to amino acids via a proton acceptor, which is one or more water molecules within the β-barrel of the GFP (Fig. S11, ESI†). Fig. 3a compares the steady state excitation and emission spectra of GFP S205G mutant and the wt-GFP. The excitation spectrum of the wt-GFP shows that the relative absorbance of the ROH and RO− forms in the ground state are 75% and 25%, respectively, while for the GFP S205G mutant the relative absorbance of ROH and RO− forms are 91% and 9%, respectively. The excitation spectrum of GFP S205G mutant shows a weaker intensity for RO− at pH ∼ 7, therefore the pKa of the mutant is shifted to higher wavelengths. The steady state emission spectra of both wt-GFP and the mutant shows that the ROH emission band intensity is two orders of magnitude weaker than that of the RO− emission (Fig. 3b).
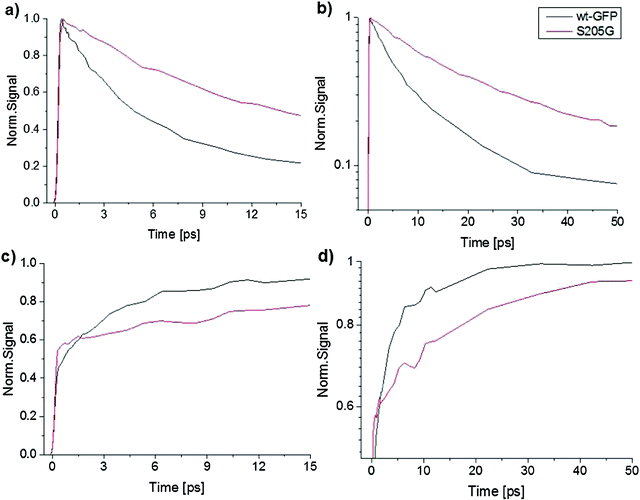
Furthermore, the ROH emission intensity of the wt-GFP is weaker than the mutant and therefore one can expect that the ESPT rate of the wt-GFP is faster than that of the mutant. To estimate the ESPT rate we applied Weller's formulation35 (ESI† text). For an emission life time of the RO− = 3 ns, the estimated ESPT rate constants are 5.1 × 10¹⁰ s−1 and 2.7 × 10¹⁰ s−1 for the wt-GFP and the GFP S205G, respectively. Therefore, the ESPT rate of the GFP S205G is about twice slower than that of the wt-GFP. The time-resolved emission spectra of the ROH and the RO− forms of both the wt-GFP and the mutant are seen in Fig. 4. Table S1 (ESI†) provides the fitting parameters of the three-exponential fitting function to the ROH fluorescence decay of the wt-GFP and the mutant. The average decay time of the ROH of the mutant is three times longer than that of the wt-GFP (Fig. 4a and b), the long rise-time component that is assigned to the formation of RO− due to the ESPT process shows a longer time for the mutant compared to the wt-GFP (Fig. 4c and d). This indicates that the ESPT rate of the mutant is three times slower than for the wt-GFP. The ESPT rate has a similar value to that observed for an ESPT from a weak photoacid to acetate ion via a few water molecules.44 Therefore, the estimated ESPT rate study suggests that the proton wire study involves water molecules (Fig. S3, ESI†). We also measured the kinetic isotopic effect (KIE) of the mutant and compared it with the KIE of the wt-GFP (ESI† text, Fig. S4 and S12). The KIE value of wt-GFP is around 5 and for the mutant it is ∼3.5. The lower KIE of S205G is similar to the ESPT study of many photoacids to bulk water and therefore suggests that the ESPT process involves water molecules.
Two novel “proton-wire” pathways in the S205G GFP involve water molecules
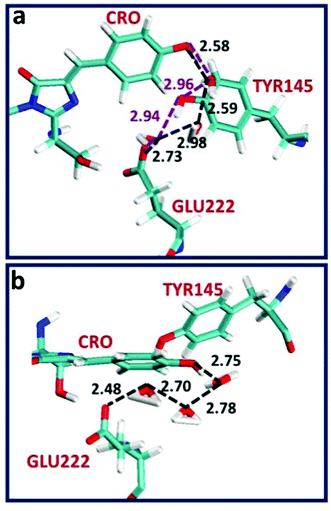
To provide insight into the ESPT mechanism in the mutant, we performed all-atom explicit MD simulations. The details for the procedure of MD simulations are reported and illustrated in the ESI†. For the MD simulations we used the 5HZO Protein Data Bank entry for the S205G mutant of GFP. Starting the MD simulations from the S205G crystal structure, the proton wire that is seen in Fig. 2 has changed during the simulation: the position of Tyr145 fluctuated during the simulations and the distance between the Tyr145 and the CRO increased (Fig. S13, ESI†). This may explain the relatively large O–O distance (3.9 Å) between the TYR145 and the CRO that is observed from the crystal structure (Fig. 2). However, a new proton wire is obtained from the MD simulations at a relatively short time and remains stable until the end of the simulations. Interestingly, the new structure of the mutant shows that the Tyr145 fluctuates and forms a “hole” and thus allows water molecules to accommodate this “hole” (Fig. S14, ESI†). The Tyr145 fluctuated also between the CRO and the Glu222 (Fig. S15, ESI†). When the Tyr145 is far from the Glu222 it allows water molecules to accommodate the “hole” and consequently the Glu222 is more solvated (Fig. S16, ESI†). We therefore propose that the water molecules that accommodate this “hole” participate in the proton wire. To estimate the number of water molecules that participate in the proton wire, we computed the event distributions of water molecules that form a proton wire between the CRO and the Glu222. Our statistical calculations have shown that it is more likely that 2–3 water molecules participate in the proton wire (Fig. 5). Following the MD simulations we propose two novel “proton-wire” pathways, as one can see from the MD simulation snapshots (Fig. 6). The first pathway involves the phenol group of the chromophore, a water molecule, Typ145 and Glu222 or the phenol group of the chromophore, Typ145, a water molecule and Glu222 (Fig. 6a). This pathway is less frequently seen along the MD simulations (Fig. S15, ESI†). The second pathway involves the phenol group of the chromophore, 2–3 water molecules and Glu222 (Fig. 6b). This pathway is more frequent along the MD simulations. One can see from the MD simulations that these two pathways may be concerted simultaneously (Fig. 5a), i.e. may occur simultaneously and therefore we suggest that they may compete, but according to the frequent snapshots seen along the MD simulations, the Tyr145 is less involved in the proton wire (Fig. S15, ESI†).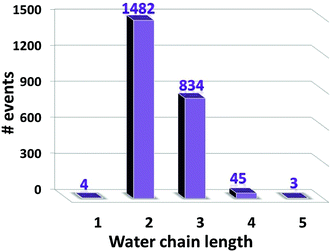 | ||
| Fig. 5 The distribution events of the number of water molecules that participate as water chain in the “proton wire” pathway. | ||
In summary, the MD simulations proposed two new possible proton transfer pathways, in which one pathway involves only one water molecule and the second involved 2–3 water molecules. In contrast to our previous study, in which we have shown that the water molecules involved in the proton wire process are infrequently entering from the bulk in the GFP double mutant T203V/S205A and with a rate of ∼350-fold reduction compare to wt-GFP, in the new GFP S205G mutant the water molecules are internal, i.e. in the β-barrel, and the rate is only ∼20 ps.
Conclusions
To advance our mechanistic understanding of ESPT processes in GFP, we present a crystal structure and time resolved spectroscopic analysis of the S205G mutant. The S205G mutation was introduced to study the role of the hydroxyl group in the proton transfer reaction. However the mutation introduced flexibility into the protein, leading to structural changes that create a binding site for malate (used as a precipitant for crystallization purposes) which interacts with the chromophore. It seems likely that this mutation could lead to a new class of indicator proteins, with binding sites engineered to accommodate various small molecules of interest. The crystal structure revealed no candidate side chains that could replace the role of the hydroxyl of Ser205 in ESPT. However, examining the ESPT of the GFP S205G mutant using a variety of optical techniques have revealed two interesting results: first, the GFP S205G demonstrated ESPT. Second, the kinetics of the ESPT process showed a fast process with comparison to the previous GFP mutants, such as T203V/S205V. To investigate the molecule mechanism of ESPT in the mutant, we performed all-atom explicit MD simulations. The simulations allow following the dynamics of the GFP S205G mutant in solvated water molecules. Interestingly, during the MD simulations Tyr145 fluctuated (in agreement with the crystal structure), opening a “hole” between the chromophore and Glu222 and allowing entry of water molecules from the interior of the β-barrel to participate simultaneously in two competing novel proton wire mechanisms. In this study, the unique fluorescence properties of the GFP protein are used as an ultra-fast probe for testing the activity of a mutagenically induced water-chain proton wire. Namely, re-placement of the hydroxyl group of a hydrophilic side chain in the wt-GFP proton wire by an approx. 5 Å cavity induces formation of a water-chain that functions as a proton wire with response times within 10 ps of the wild type protein. We understand this remarkable rate retention as a natural consequence of the inherent rate Grotthuss mechanism proton transfer in water.Acknowledgements
This project is funded by the FP7-PEOPLE-2011-CIG (YM; CIG 303741) and in part supported by Grant No. 2011/128 from the United States-Israel Binational Science Foundation (BSF). DH and SJR were funded by the BSF. SJR acknowledges support from the National Science Foundation, grant MCB-1021374. All simulations were performed using the high-performance computational facilities of the Miller lab in the BGU HPC computational center. The support of the BGU HPC computational center staff is greatly appreciated.References
- R. A. Frank, C. M. Titman, J. V. Pratap, B. F. Luisi and R. N. Perham, Science, 2004, 306, 872 CrossRef CAS PubMed.
- W. Han, R. C. Cheng, M. C. Maduke and E. Tajkhorshid, Proc. Natl. Acad. Sci. U. S. A., 2014, 111, 1819 CrossRef CAS PubMed.
- A. J. Hughes, A. M. Tentori and A. E. Herr, J. Am. Chem. Soc., 2012, 134, 17582 CrossRef CAS PubMed.
- S. P. Laptenok, A. Lukacs, A. Gil, R. Brust, I. V. Sazanovich, G. M. Greetham, P. J. Tonge and S. R. Meech, Angew. Chem., Int. Ed. Engl., 2015, 54, 9303 CrossRef CAS PubMed.
- Y. Nishihara and A. Kitao, Proc. Natl. Acad. Sci. U. S. A., 2015, 112, 7737 CrossRef CAS PubMed.
- U. S. Raghavender, S. Aravinda, N. Shamala, Kantharaju, R. Rai and P. Balaram, J. Am. Chem. Soc., 2009, 131, 15130 CrossRef CAS PubMed.
- A. Shinobu, G. J. Palm, A. J. Schierbeek and N. Agmon, J. Am. Chem. Soc., 2010, 132, 11093 CrossRef CAS PubMed.
- M. Barboiu and A. Gilles, Acc. Chem. Res., 2013, 46, 2814 CrossRef CAS PubMed.
- E. Freier, S. Wolf and K. Gerwert, Proc. Natl. Acad. Sci. U. S. A., 2011, 108, 11435 CrossRef CAS PubMed.
- E. Persson and B. Halle, J. Am. Chem. Soc., 2008, 130, 1774 CrossRef CAS PubMed.
- H. Yu and S. W. Rick, J. Am. Chem. Soc., 2009, 131, 6608 CrossRef CAS PubMed.
- M. Chattoraj, B. A. King, G. U. Bublitz and S. G. Boxer, Proc. Natl. Acad. Sci. U. S. A., 1996, 93, 8362 CrossRef CAS.
- T. M. Creemers, A. J. Lock, V. V. Subramaniam, T. M. Jovin and S. Volker, Nat. Struct. Biol., 1999, 6, 706 CrossRef CAS PubMed.
- J. N. Henderson, R. Gepshtein, J. R. Heenan, K. Kallio, D. Huppert and S. J. Remington, J. Am. Chem. Soc., 2009, 131, 4176 CrossRef CAS PubMed.
- C. C. Hsieh, P. T. Chou, C. W. Shih, W. T. Chuang, M. W. Chung, J. Lee and T. Joo, J. Am. Chem. Soc., 2011, 133, 2932 CrossRef CAS PubMed.
- Y. Ma, Q. Sun, Z. Li, J. G. Yu and S. C. Smith, J. Phys. Chem. B, 2012, 116, 1426 CrossRef CAS PubMed.
- R. Simkovitch, A. Huppert, D. Huppert, S. J. Remington and Y. Miller, J. Phys. Chem. B, 2013, 117, 11921 CrossRef CAS PubMed.
- J. J. van Thor, T. Gensch, K. J. Hellingwerf and L. N. Johnson, Nat. Struct. Biol., 2002, 9, 37 CrossRef CAS PubMed.
- Y. Erez, R. Gepshtein, I. Presiado, K. Trujillo, K. Kallio, S. J. Remington and D. Huppert, J. Phys. Chem. B, 2011, 115, 11776 CrossRef CAS PubMed.
- C. Fang, R. R. Frontiera, R. Tran and R. A. Mathies, Nature, 2009, 462, 200 CrossRef CAS PubMed.
- M. A. Lill and V. Helms, Proc. Natl. Acad. Sci. U. S. A., 2002, 99, 2778 CrossRef CAS PubMed.
- X. Shu, P. Leiderman, R. Gepshtein, N. R. Smith, K. Kallio, D. Huppert and S. J. Remington, Protein Sci., 2007, 16, 2703 CrossRef CAS PubMed.
- D. Stoner-Ma, A. A. Jaye, K. L. Ronayne, J. Nappa, S. R. Meech and P. J. Tonge, J. Am. Chem. Soc., 2008, 130, 1227 CrossRef CAS PubMed.
- D. Stoner-Ma, E. H. Melief, J. Nappa, K. L. Ronayne, P. J. Tonge and S. R. Meech, J. Phys. Chem. B, 2006, 110, 22009 CrossRef CAS PubMed.
- J. J. van Thor, K. L. Ronayne, M. Towrie and J. T. Sage, Biophys. J., 2008, 95, 1902 CrossRef CAS PubMed.
- O. Vendrell, R. Gelabert, M. Moreno and J. M. Lluch, J. Am. Chem. Soc., 2006, 128, 3564 CrossRef CAS PubMed.
- O. Vendrell, R. Gelabert, M. Moreno and J. M. Lluch, J. Chem. Theory Comput., 2008, 4, 1138 CrossRef CAS PubMed.
- V. Wineman-Fisher, R. Simkovitch, S. Shomer, R. Gepshtein, D. Huppert, M. Saif, K. Kallio, S. J. Remington and Y. Miller, Phys. Chem. Chem. Phys., 2014, 16, 11196 RSC.
- C. R. Kissinger, D. K. Gehlhaar and D. B. Fogel, Acta Crystallogr., Sect. D: Biol. Crystallogr., 1999, 55, 484 CrossRef CAS.
- The CCP4 suite: programs for protein crystallography, Acta Crystallogr., Sect. D: Biol. Crystallogr., 1994, 50, 760–763 CrossRef PubMed.
- P. Emsley and K. Cowtan, Acta Crystallogr., Sect. D: Biol. Crystallogr., 2004, 60, 2126 CrossRef PubMed.
- N. Agmon, J. Phys. Chem. A, 2005, 109, 13 CrossRef CAS PubMed.
- A. L. Kohen and H. H. Limbach, The Kinetic Isotope Effect in the Photo-Dissociation Reaction of Excited-State Acids in Aqueous Solutions, Isotope effects in chemistry and biology, CRC Press, 2005 Search PubMed.
- E. B. Krissinel and N. Agmon, J. Comput. Chem., 1996, 17, 1085 CrossRef CAS.
- A. Weller, Prog. React. Kinet., 1961, 1, 187 CAS.
- L. Kale, R. Skeel, M. Bhandarkar, R. Brunner, A. Gursoy, N. Krawetz, J. Phillips, A. Shinozaki, K. Varadarajan and K. Schulten, J. Comput. Phys., 1999, 151, 283 CrossRef CAS.
- A. D. MacKerell, D. Bashford, M. Bellott, R. L. Dunbrack, J. D. Evanseck, M. J. Field, S. Fischer, J. Gao, H. Guo, S. Ha, D. Joseph-McCarthy, L. Kuchnir, K. Kuczera, F. T. K. Lau, C. Mattos, S. Michnick, T. Ngo, D. T. Nguyen, B. Prodhom, W. E. Reiher, B. Roux, M. Schlenkrich, J. C. Smith, R. Stote, J. Straub, M. Watanabe, J. Wiorkiewicz-Kuczera, D. Yin and M. Karplus, J. Phys. Chem. B, 1998, 102, 3586 CrossRef CAS PubMed.
- W. L. Jorgensen, J. Chandrasekhar, J. D. Madura, R. W. Impey and M. L. Klein, J. Chem. Phys., 1983, 79, 926 CrossRef CAS.
- M. W. Mahoney and W. L. Jorgensen, J. Chem. Phys., 2000, 112, 8910 CrossRef CAS.
- S. E. Feller, Y. H. Zhang, R. W. Pastor and B. R. Brooks, J. Chem. Phys., 1995, 103, 4613 CrossRef CAS.
- G. J. Martyna, D. J. Tobias and M. L. Klein, J. Chem. Phys., 1994, 101, 4177 CrossRef CAS.
- T. Darden, D. York and L. Pedersen, J. Chem. Phys., 1993, 98, 10089 CrossRef CAS.
- U. Essmann, L. Perera, M. L. Berkowitz, T. Darden, H. Lee and L. G. Pedersen, J. Chem. Phys., 1995, 103, 8577 CrossRef CAS.
- O. F. Mohammed, D. Pines, E. T. Nibbering and E. Pines, Angew. Chem., Int. Ed. Engl., 2007, 46, 1458 CrossRef CAS PubMed.
Footnote |
| † Electronic supplementary information (ESI) available. See DOI: 10.1039/c6cp05071a |
| This journal is © the Owner Societies 2016 |

