 Open Access Article
Creative Commons Attribution 3.0 Unported Licence
Helium droplet infrared spectroscopy of glycine and glycine–water aggregates
Matin
Kaufmann
,
Daniel
Leicht
,
Raffael
Schwan
,
Devendra
Mani
,
Gerhard
Schwaab
and
Martina
Havenith
*
Physical Chemistry II, Department of Chemistry and Biochemistry, Ruhr-Universität Bochum, Bochum, Germany. E-mail: martina.havenith@rub.de
First published on 21st September 2016
Abstract
Infrared absorption spectra of glycine and glycine–water aggregates embedded in superfluid helium nanodroplets were recorded in the frequency range 1000–1450 cm−1. For glycine monomer, absorption bands were observed at 1106 cm−1, 1134 cm−1, and 1389 cm−1. These bands were assigned to the C–OH stretch mode of the glycine conformers I, III and II, respectively. For glycine–water aggregates, we observed two bands at 1209 cm−1 and 1410 cm−1 which we assign to distinct conformers of glycine–H2O. In all cases, the water is found to preferentially bind to the carboxyl group of the glycine.
Introduction
Glycine is the smallest amino acid and serves as a model system for the building blocks of proteins. In the gas phase, glycine is present in its neutral form, while in the crystal structure and in aqueous solution it dissociates into its zwitterionic form. In the aqueous solution, this transition requires a proton transfer which is stabilized by the hydrogen bond network formed by the surrounding water.In a previous study, we have investigated the low frequency spectrum of the solvated glycine zwitterion using THz absorption spectroscopy in combination with ab initio molecular dynamics simulations.1 It was possible to dissect the experimentally observed spectrum of glycine in aqueous solution as a superposition of strong intra-molecular solute modes interplaying with distinct solute–solvent couplings together with rigid-body-like solute motion within the transient solvation cage. This has provided new insights into the molecular picture of the solvation of amino acids.
Previously, the microsolvation of glycine with water has given rise to numerous studies both experimentally and computationally: computational studies have investigated glycine–water complexes with up to 12 water molecules. The main emphasis lied on the question of how many water molecules are necessary to stabilize the zwitterion.2–4 Further computational studies focused on complexes of glycine with one water molecule. Particular attention was given to the nature of the binding site of the water molecule with the glycine and its interaction strength upon intermolecular bond formation.5–7
A range of experimental studies have been carried out on the glycine–water complex, including matrix isolation FTIR,8,9 Raman and microwave experiments in free jet expansions,10,11 as well as photoelectron experiments on anionic glycine–water clusters.12–14 In gas-phase experiments, a total of three different aggregates of glycine with one water molecule have been observed. In these, the water binds to the carboxyl group of the glycine, which is present in three different configurations.10,11 Previously, Ramaekers et al. recorded FTIR spectra of glycine and water embedded in an argon matrix. For a low water content, they found two glycine conformers with a water molecule binding to the carboxyl group, by comparing the experimental data to ab initio predictions. For a higher water content, they determined spectral changes upon annealing the matrix and assigned these to the formation of a zwitterionic structure of glycine–(H2O)4.8 In a more recent Ar matrix study, Espinoza et al. confirmed the results for aggregates of one glycine and one water molecule and found an additional configuration, where again the water binds to the carboxyl group.9 However, they suspected that some of the spectral features observed by Ramaekers et al. at a high water content may be due to glycine dimer formation. Therefore, no unambiguous confirmation of a zwitterion formation for a given cluster size was possible. For anionic [(glycine)(H2O)n]− clusters with n = 1, 2, 5–10, Xu et al. proposed that the transition to the zwitterionic form takes place for clusters with n ≥ 5.12
The helium droplet isolation technique is an established way for isolating weakly bound species and characterizing their vibrational spectra.15 Previously, infrared spectra of the glycine monomer and glycine dimer embedded in helium nanodroplets have been recorded in the O–H stretch region.16,17
Here, we report the observation of the infrared spectra of glycine and its complexes with one water molecule in the fingerprint region 1000–1450 cm−1. In this frequency range, we expect a strong C–O stretch / COH bending mode, in the following denoted as C–OH stretch mode. Furthermore, we were able to detect the spectrum of the glycine–water aggregates. The experimentally observed infrared spectra are compared to ab initio calculations in order to unravel the structures of helium solvated glycine–water aggregates.
Experimental methods
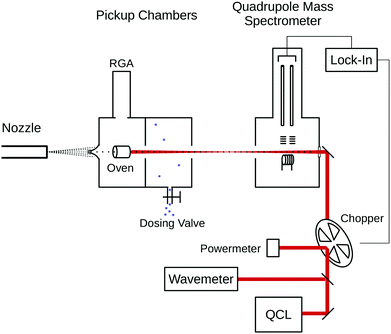
The experiments were carried out on the Bochum helium droplet apparatus, described in detail previously.18 A schematic drawing of the experimental setup is shown in Fig. 1. The helium droplet beam is generated in a continuous expansion of precooled (17 K, 20 K) helium at a stagnation pressure of 50 bar through a 5 μm nozzle, resulting in a mean droplet size of 10![[thin space (1/6-em)]](https://www.rsc.org/images/entities/char_2009.gif) 000 and 5000 helium atoms, respectively. In a first pickup chamber, a cylindrical steel oven is mounted with a transfixion for the transmission of the droplet beam.19 A barrel heater is wrapped around the oven and the reservoir inside is filled with crystalline glycine. At an oven temperature of about 80 °C, the glycine starts sublimating and is picked up by the droplets. During the experiments, oven temperatures in the range 80–120 °C were used. The optimal temperature for the pickup of a single glycine molecule was determined to be 105 °C. In a second pickup chamber, water is introduced through a dosing valve, with a partial pressure of up to 2 × 10⁻⁵ mbar. During the measurements of glycine–water aggregates, a partial pressure of 4 × 10⁻⁶ mbar H2O was maintained in the chamber. At this pickup pressure, single water molecules are embedded into the droplets preferentially. A residual gas analyzer (RGA; Pfeiffer QMG 220) is attached to the first pickup chamber and used for measuring the concentration of the dopants in the chambers.
000 and 5000 helium atoms, respectively. In a first pickup chamber, a cylindrical steel oven is mounted with a transfixion for the transmission of the droplet beam.19 A barrel heater is wrapped around the oven and the reservoir inside is filled with crystalline glycine. At an oven temperature of about 80 °C, the glycine starts sublimating and is picked up by the droplets. During the experiments, oven temperatures in the range 80–120 °C were used. The optimal temperature for the pickup of a single glycine molecule was determined to be 105 °C. In a second pickup chamber, water is introduced through a dosing valve, with a partial pressure of up to 2 × 10⁻⁵ mbar. During the measurements of glycine–water aggregates, a partial pressure of 4 × 10⁻⁶ mbar H2O was maintained in the chamber. At this pickup pressure, single water molecules are embedded into the droplets preferentially. A residual gas analyzer (RGA; Pfeiffer QMG 220) is attached to the first pickup chamber and used for measuring the concentration of the dopants in the chambers.
A tunable infrared quantum cascade laser (QCL; Daylight Solutions MIRcat) is overlapped with the droplet beam in a collinear arrangement. The MIRcat is equipped with four external cavity QCL modules with the frequency ranges of 950–1200 cm−1, 1170–1320 cm−1, 1300–1460 cm−1 and 2450–2600 cm−1. The output power ranges between 30 and 200 mW. The IR photons are absorbed by the embedded molecules and aggregates and the energy is dissipated via evaporation of helium, thus decreasing the ionization cross section of these droplets.
In the detector chamber, the droplet beam is ionized via electron impact and the cation fragments are detected in a mass spectrometer (Pfeiffer QMG 422). For the infrared depletion spectra, we have recorded the total ion current for all fragments with a mass/charge ratio m/z ≥ 8 (high pass), which yielded the best signal/noise ratio. We used a phase-sensitive detection of the depletion in the ion current on the frequency of the amplitude modulated laser beam via a lock-in amplifier.
Results
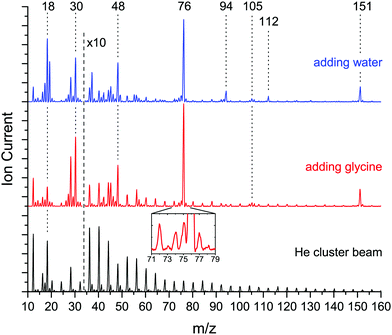
Fig. 2 shows a comparison of mass spectra of the neat helium droplet beam (bottom trace, black), droplets doped with glycine (mid trace, red) and droplets doped with glycine as well as water (upper trace, blue).The mass spectrum of the neat helium droplets shows peaks at multiples of four, attributed to (He)n+ fragments. The peaks at m/z = 18 and m/z = 28 originate from residual water and nitrogen in the machine, respectively.
The mass spectrum of droplets doped with glycine displays additional peaks at masses m/z = 30, 42–48, 74–76, 105–106 and 151. The fragment at mass m/z = 74 corresponds to deprotonated glycine (H2NCH2CO2)+, which is a decay channel for glycine monomer. The fragments at mass m/z = 30 (CH2NH2)+ and m/z = 75 (glycine cation, (H2NCH2CO2H)+) are fragments of glycine monomer, dimer, and glycine–water complexes. The fragment at mass m/z = 105 (glycine + CH2NH2+) corresponds to the dimer, which also contributes to the fragments at m/z = 30, 75, 76. Mass m/z = 151 corresponds to the protonated glycine dimer ((H2NCH2CO2H)2H)+ and is a fragment for the glycine trimer as well as glycine dimer + water.
Upon addition of water to the glycine-doped droplets, additional peaks appear at mass m/z = 17–19 and 37, which correspond to fragments of water clusters. In addition to the protonated glycine and glycine dimer, we observe peaks at mass m/z = 94 (protonated glycine + water, (H2NCH2CO2H)(H2O)H+) and m/z = 112 (protonated glycine + two water, (H2NCH2CO2H)(H2O)2H+). These are attributed to fragments of glycine water complexes, in particular (glycine)1(H2O)n with n = 2, 3 and (glycine)2(H2O)n with n = 1, 2, respectively.
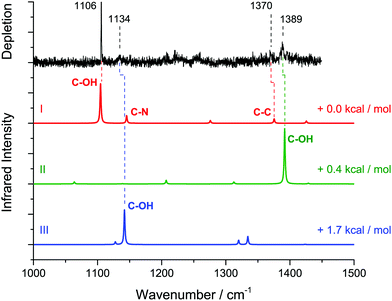
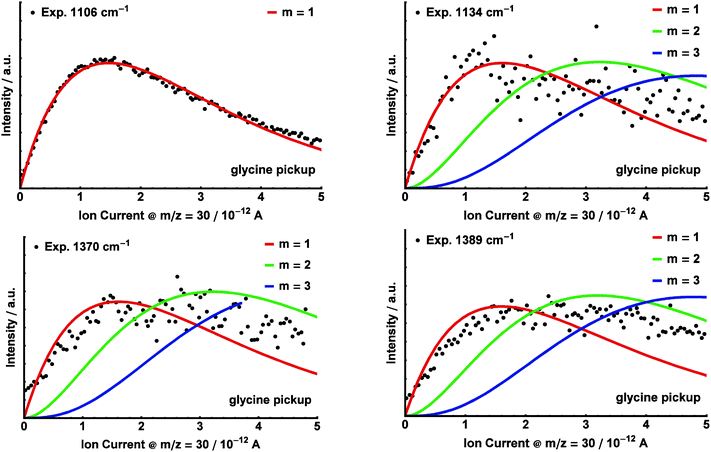
We recorded the infrared depletion spectrum of glycine in the range 1000–1450 cm−1 integrated over all masses m/z ≥ 8 using a mean helium droplet size 〈N〉 ≅ 5000, as shown in Fig. 3 (upper trace, black). We observe absorption bands at 1106 cm−1, 1134 cm−1, 1370 cm−1, and 1389 cm−1. At each of these bands, we recorded the depletion signal as a function of the glycine pressure (i.e. pickup curves). For this, the oven containing glycine was heated up to 120 °C and then cooled down to 80 °C, while recording the ion current on m/z = 30 in the residual gas analyzer that is connected to the pickup chamber. The experimental data are displayed in Fig. 4.
The probability P or the pickup of k dopant molecules is given by the Poisson distribution
 | (1) |
Poisson distributions for the pickup of m = 1, 2, 3 glycine molecules were fitted to the experimental pickup data. As parameters, we used a normalization factor and a parameter which includes the product σL. This parameter was determined by a fit for the pickup curve at 1106 cm−1, which served as a reference, using m = 1. In all subsequent fits, this value was kept constant. The pickup curves at 1106 cm−1, 1134 cm−1, 1370 cm−1 and 1389 cm−1 resemble very well the Poisson distribution for glycine monomer (see Fig. 4).
Accompanying ab initio calculations were carried out using the GAUSSIAN program suite.20 The structures for the main glycine conformers were optimized on the MP2/TZVPP level of theory and their harmonic frequencies were calculated.21,22 The structures for glycine I, II and III are shown in Fig. 5. Using MP2/TZVPP harmonic calculations (scaled by 0.97), we predict infrared transitions of the C–OH stretch mode for three distinct conformers at 1105 cm−1, 1142 cm−1 and 1392 cm−1. In addition, we predict weaker transitions at 1145 cm−1 and 1375 cm−1 for the C–C and C–N stretch modes of the conformer I, respectively. An overview of the experimentally observed lines and the predicted harmonic frequencies is given in Table 1.
 | ||
| Fig. 5 Structures of the glycine conformers I, II and III and their relative zero-point corrected MP2/TZVPP energies. All three conformers are observed here. | ||
| Structure | Mode | Experimental [cm−1] | Experimental shift [cm−1] | MP2/TZVPP harmonic frequencies (scaled 0.97) [cm−1] | Predicted shift [cm−1] |
|---|---|---|---|---|---|
| I | C–OH | 1106 | 1105 | ||
| I | C–N | 1134 | 1145 | ||
| I | C–C | 1370 | 1375 | ||
| III | C–OH | 1134 | 1142 | ||
| II | C–OH | 1389 | 1392 | ||
| ICa | C–OH | 1209 | +103 | 1215 | +110 |
| IIICa | C–OH | 1263 | +121 | ||
| IIB/IICb/IICc | C–OH | 1392/1393/1394 | +0/+1/+2 | ||
| IICa | C–OH | 1410 | +21 | 1406 | +14 |
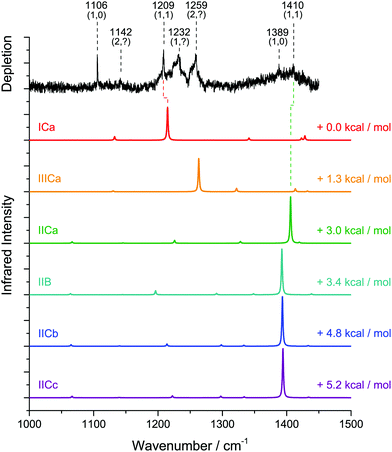
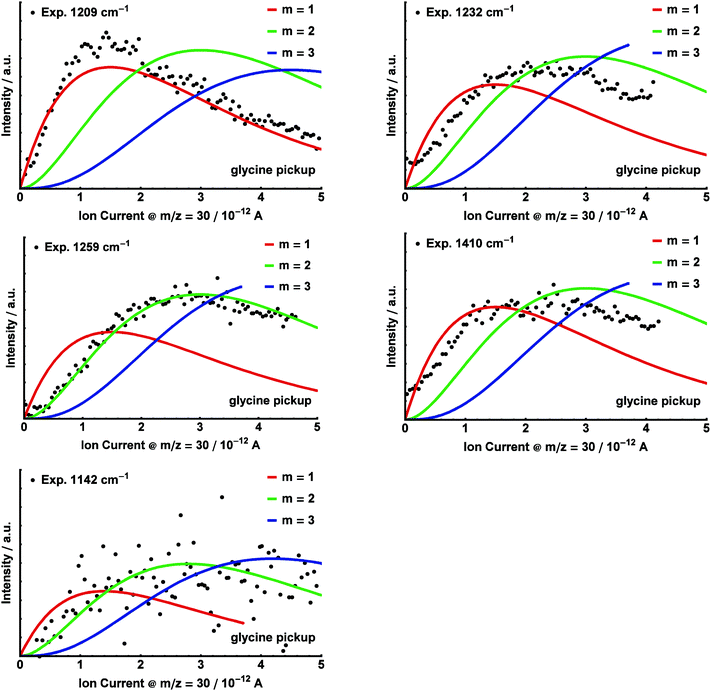
In order to record the experimental spectrum for glycine–water aggregates (Fig. 6), we increased the droplet size to 〈N〉 ≅ 10![[thin space (1/6-em)]](https://www.rsc.org/images/entities/char_2009.gif) 000. Upon addition of H2O, additional absorption bands are observed in the range 1200–1260 cm−1, most prominently at 1209 cm−1, 1232 cm−1 and 1259 cm−1. Furthermore, we observe bands at 1142 cm−1 as well as at 1410 cm−1. Pickup curves were recorded for the bands at 1142 cm−1, 1209 cm−1, 1232 cm−1, 1259 cm−1 and 1410 cm−1 as a function of the glycine pressure by varying the oven temperature (Fig. 7). During these measurements, the water pickup was kept constant at a partial pressure of 4 × 10⁻⁶ mbar.
000. Upon addition of H2O, additional absorption bands are observed in the range 1200–1260 cm−1, most prominently at 1209 cm−1, 1232 cm−1 and 1259 cm−1. Furthermore, we observe bands at 1142 cm−1 as well as at 1410 cm−1. Pickup curves were recorded for the bands at 1142 cm−1, 1209 cm−1, 1232 cm−1, 1259 cm−1 and 1410 cm−1 as a function of the glycine pressure by varying the oven temperature (Fig. 7). During these measurements, the water pickup was kept constant at a partial pressure of 4 × 10⁻⁶ mbar.
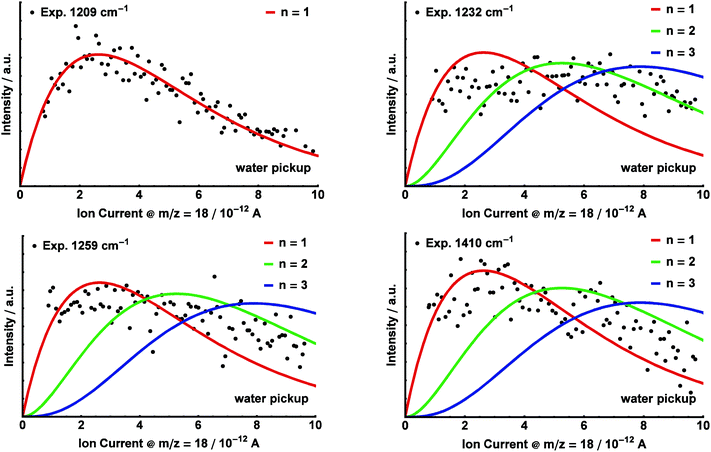
For the bands at 1209 cm−1, 1232 cm−1, 1259 cm−1 and 1410 cm−1, additional pickup curves were recorded by varying the H2O partial pressure between 0 and 1.5 × 10⁻⁵ mbar, while recording the ion current on m/z = 18 in the residual gas analyzer (Fig. 8). During these measurements, the glycine oven temperature was kept constant at a temperature of 105 °C.
We were able to fit Poisson distributions with m, n = 1, 2, 3 to the experimental glycine and water pickup curves, respectively. The pressure dependence (m, n) of the distinct bands corresponding to aggregates (glycine)m(H2O)n is given in Fig. 6. The product σ·L for the pickup of water was determined by a fit of the pressure dependence for the band at 1209 cm−1 as a reference, using n = 1. These parameters were kept constant in all subsequent fits. Based on the pickup curves, the lines at 1209 cm−1 and 1410 cm−1 are assigned to (glycine)1(H2O)1 (Fig. 7 and 8). Further pickup curves at 1142 cm−1 and at 1259 cm−1 resemble a (glycine)2 pressure dependence. Pickup curves at 1232 cm−1 resemble a (glycine)1(water)n dependence with n ≥ 1.
Structures for the glycine–water aggregates were determined via a conformational search on the BLYP-D3/TZVPP level of theory.22–25 For this, 200 structures for each glycine conformer with a random position of the water molecule were optimized and the resulting structures were compared by their root mean square distance. The obtained structures were further optimized on the MP2/TZVPP level of theory and harmonic frequencies were calculated.
The predictions yield eighteen different minimum structures. For most of the structures, the MP2/TZVPP harmonic frequencies yield a single, intense infrared transition for the C–OH stretch of the glycine, similar as for glycine monomer. Based upon a comparison between experiment and theory, all but six structures are excluded: the disregarded structures are expected to give rise to strong absorption bands between 1100 and 1200 cm−1, whereas the experimental spectrum shows no evidence for absorption bands of (glycine)1(H2O)1 aggregates in this frequency range.
The six structures that are further taken into account are depicted in Fig. 9 and labeled according to the configuration of the glycine (I, II or III) followed by the site of the binding water (C for carboxyl group, B for a ‘bridge’ position between the carboxyl and amino sites). For the structures ICa and IIICa, we find intermolecular hydrogen bonds between the water and the carboxyl group. In these structures, the water acts as both, a hydrogen bond donor and acceptor with respective bond lengths of 2.0 Å/1.8 Å for ICa and 1.9 Å/1.8 Å for IIICa. For the structures IICa, IICb and IICc the water acts as a hydrogen bond donor with bond lengths of 1.9 Å, 2.0 Å, and 2.0 Å, respectively. In structure IIB, the water is situated at the side of the glycine molecule and forms weak hydrogen bonds to the amino and carboxyl groups. In these bonds, the water acts as acceptor and donor with bond lengths of 2.3 Å and 2.4 Å, respectively. In all structures with glycine in conformation II, we find an additional intramolecular hydrogen bond with a bond length of 1.86 ± 0.02 Å. The harmonic frequencies (scaled by 0.97) of these structures yield strong infrared transitions at 1215 cm−1, 1263 cm−1, 1392–1394 cm−1, and 1406 cm−1. The predicted spectra are convoluted with a Lorentzian line shape and compared with the experimental spectrum in Fig. 6. An overview of the predicted frequencies is given in Table 1.
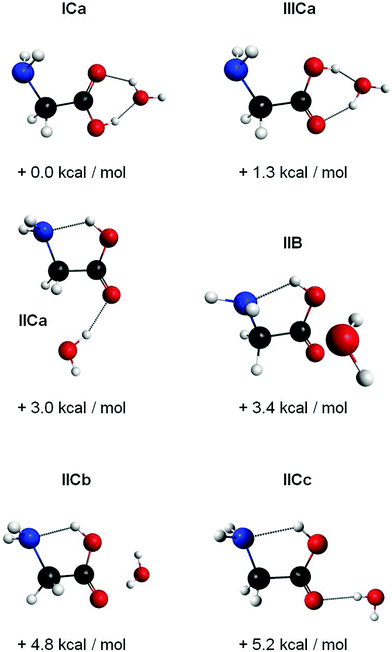 | ||
| Fig. 9 Six structures of glycine–water aggregates with their relative zero-point corrected MP2/TZVPP energies. We observed structures ICa and IICa. | ||
Discussion
Glycine monomer
Theory predicts at least 8 stable conformers of glycine.26,27 Here, we observe four IR bands of glycine monomer at 1106 cm−1, 1134 cm−1, 1370 cm−1, and 1389 cm−1 (see Fig. 3). This assignment is established by the corresponding experimental pickup curves, which all follow the Poisson statistics for the pickup of one glycine molecule (see Fig. 4). For a low glycine pickup pressure, the pickup curve of the band at 1389 cm−1 follows a linear increase corresponding to a monomer. However, for a higher glycine pressure, the pressure dependence resembles those for larger clusters. We attribute this to underlying absorption features of larger glycine clusters, which gain intensity for high glycine pressures.In comparison with the MP2/TZVPP harmonic frequencies, the bands at 1106 cm−1 and 1389 cm−1 are assigned to the C–OH stretch modes of the glycine conformers I and II, with the absorption at 1106 cm−1 corresponding to the predicted IR transition of conformer I at 1105 cm−1, and the absorption at 1389 cm−1 corresponding to the predicted transition of conformer II at 1392 cm−1. The band at 1370 cm−1 is assigned to the predicted C–C stretch mode of conformer I at 1375 cm−1. The band at 1134 cm−1 is assigned to an overlap of the C–N stretch mode of conformer I predicted at 1145 cm−1 and the C–OH stretch mode of conformer III predicted at 1142 cm−1. The infrared intensity of the C–OH stretch mode is predicted to have nearly the same strength for all three conformers. The difference of the experimental intensities of the bands at 1134 cm−1 and 1389 cm−1 compared to the band at 1106 cm−1 is therefore attributed to a difference in the abundance of the three conformers in helium nanodroplets.
Assuming that the band at 1134 cm−1 is solely due to the C–N stretch mode of conformer I, the experimental data does not confirm the observation of the glycine conformer III. However, bands of glycine monomer have been observed in helium droplets in the frequency range of the O–H stretch band and assigned to the glycine conformers I, II, and III.16 Furthermore, the observation of three conformers is in agreement with previous experimental measurements of glycine in inert gas matrices (conformers I, II and III; see Fig. 5).28–30 Therefore, we include conformer III in our assignment.
Glycine–H2O
Upon addition of H2O, we observe additional absorption bands at 1142 cm−1, 1410 cm−1, and several overlapping bands in the range 1200–1260 cm−1 (see Fig. 6). We still observe the bands at 1106 cm−1 and 1389 cm−1, which are attributed to the glycine monomer. The bands at 1142 cm−1 and 1259 cm−1 are assigned to clusters containing two glycine molecules based upon pickup curves recorded at these frequencies. The bands at 1209 cm−1, 1232 cm−1, and the smaller peak at 1410 cm−1 are assigned to aggregates containing one glycine molecule. The glycine pickup curves at 1232 cm−1 and 1410 cm−1 are not unambiguous since they seem to be composed of overlapping bands of (glycine)1(H2O)n as well as (glycine)2(H2O)n aggregates. However, the linear increase of the intensity of these bands for low glycine pressures supports their assignment to (glycine)1 aggregates. From the water pressure dependence, the bands at 1209 cm−1 and 1410 cm−1 are assigned to aggregates containing one water molecule. The water pickup curve at 1232 cm−1 does not display a clear Poisson dependence. We attribute this to overlapping bands of several aggregates incorporating a varying amount of water molecules in this region.We used the ratio between the predicted and the observed transition of glycine monomer as a scaling factor to predict the vibrational bands of the (glycine)1(H2O)1 aggregates. The results are summarized in Table 1. Based upon these values we assign the band at 1209 cm−1 to the C–OH stretch mode of the ICa configuration, predicted at 1215 cm−1. The band at 1410 cm−1 can be attributed to the C–OH stretch mode of the conformer IICa, which is predicted at 1406 cm−1. The structures IIB, IICb and IICc feature strong IR transitions that are predicted at 1392 cm−1, 1393 cm−1, and 1394 cm−1, respectively. However, the experimental band at 1389 cm−1 is observed without the addition of water and is therefore assigned to the glycine monomer. Nevertheless, we cannot exclude some contribution of these structures to the band at 1389 cm−1.
An assignment of the experimentally observed bands in the range 1200 cm−1 to 1260 cm−1 proves to be difficult. The C–OH stretch mode of the IIICa configuration is predicted at 1263 cm−1. We speculate that the corresponding absorption band in the experimental spectrum is overlapped with the strong band at 1259 cm−1, which is attributed to an aggregate (glycine)2(H2O)n.
The structure ICa shows the formation of H-bonds between the water and the carboxyl group. The intermolecular bonds strengthen the C–O bond, thus causing a predicted blue shift of the C–OH stretch vibration of 110 cm−1. This blue shift is in accordance with the experimental data, which show a blue shift of 103 cm−1.
For the glycine II conformer, the C–OH stretch mode is blue shifted experimentally by 21 cm−1 subsequent to aggregation with one water molecule. This is in line with a strengthening of the C–O bond via interaction with the water. However, the shift is five times smaller than the blue shift for the glycine conformer I. We suggest that the intramolecular hydrogen bond in the glycine II configuration moderates this effect. For the structure IICa the C–OH stretch mode is predicted to be blue shifted by 14 cm−1, which is in line with the experimental shift of 21 cm−1. We should note that for the structures IIB, IICb, and IICc the C–OH stretch mode is hardly affected with predicted shifts of +0 cm−1, +1 cm−1, and +2 cm−1, respectively. This observation suggests a marginal interaction with the water, which is in accordance with a large O⋯H bond distance of 2.0 Å for the structures IICb and IICc, and bond distances of 2.3 Å and 2.4 Å in the conformer IIB.
In our experiment, we observe structures, in which the water binds to the carboxyl site of glycine as conformer I and II (i.e. ICa and IICa). We further assume that the corresponding structure for glycine as conformer III is formed in helium droplets, as well. These aggregates are formed with the glycine conformers I, II, and III and correspond to the respective lowest energy structures. We find no evidence for the presence of complexes, in which the water binds to the amino site, even though these conformers correspond to local minima on the potential surface. The observation of a structure with the water acting as a bridge between the amino and carboxyl groups (i.e. IIB) is unlikely. The latter configuration would facilitate a hypothetical proton transfer. Zwitterion formation is therefore expected to require more water molecules.
This observation is in line with the previous gas-phase experiments, where the structures ICa and IIICa were observed, exclusively.11 However, it is in contrast to an aggregation that is dominated by dipole steering (i.e. a long-range interaction), which has been observed in helium droplets in the case of large rotational constants and large dipole moments (e.g. for HCN; see Nauta and Miller31). A pre-orientation of the aggregating molecules by dipole–dipole interaction would facilitate configurations with the water binding to the amino site, as well.
Here, we do not find this, which is in line with the small rotational constants or glycine (approx. 0.3 cm−1 and 0.1 cm−1)32 leading to the thermal population of several rotational states, despite the low temperature in the droplets. During aggregation, the glycine dipole is rotationally averaged, which reduces its interaction with the dipole of the water molecule. Rotational averaging has been discussed previously for different systems, e.g. the acetylene–furan trimer.33 Therefore, we suggest that structures which correspond to a global minimum on the potential energy surface are formed preferentially, since a rotational realignment subsequent to cooling is feasible.
Conclusion
In summary, we have recorded the IR fingerprint spectrum of glycine monomer and (glycine)1(H2O)1. Similar as in previous studies of Huisken,16 we found conformer I, II and III of glycine being populated even at temperatures of 0.37 K.Furthermore, we investigated the first step of microsolvation of glycine by addition of a single water molecule in helium droplets. By comparison between the experimentally recorded and the predicted spectrum, we were able to assign two bands to the C–OH stretch mode of the glycine. For both experimentally observed structures, a hydrogen bond is formed between the carboxyl group and the H2O molecule. These structures correspond to two low-lying conformers of the potential energy surface. It is interesting to note that for (glycine)1(H2O)1 no conformer was observed which would facilitate a proton transfer. Thus, we suspect that the formation of a larger water network is required before proton transfer can take place.
Acknowledgements
We acknowledge financial support from the Cluster of Excellence RESOLV (EXC 1069) funded by the Deutsche Forschungsgemeinschaft.References
- J. Sun, G. Niehues, H. Forbert, D. Decka, G. Schwaab, D. Marx and M. Havenith, J. Am. Chem. Soc., 2014, 136, 5031–5038 CrossRef CAS PubMed.
- W. Förner, P. Otto, J. Bernhardt and J. J. Ladik, Theor. Chim. Acta, 1981, 60, 269–281 CrossRef.
- J. H. Jensen and M. S. Gordon, J. Am. Chem. Soc., 1995, 117, 8159–8170 CrossRef CAS.
- S. M. Bachrach, J. Phys. Chem. A, 2008, 112, 3722–3730 CrossRef CAS PubMed.
- H. Basch and W. J. Stevens, Chem. Phys. Lett., 1990, 169, 275–280 CrossRef CAS.
- G. M. Chaban and R. B. Gerber, J. Chem. Phys., 2001, 115, 1340–1348 CrossRef CAS.
- W. Wang, W. Zheng, X. Pu, N. Wong and A. Tian, THEOCHEM, 2002, 618, 235–244 CrossRef CAS.
- R. Ramaekers, J. Pajak, B. Lambie and G. Maes, J. Chem. Phys., 2004, 120, 4182–4193 CrossRef CAS PubMed.
- C. Espinoza, J. Szczepanski, M. Vala and N. C. Polfer, J. Phys. Chem. A, 2010, 114, 5919–5927 CrossRef CAS PubMed.
- J. L. Alonso, E. J. Cocinero, A. Lesarri, M. E. Sanz and J. C. López, Angew. Chem., 2006, 118, 3551–3554 CrossRef.
- R. M. Balabin, J. Phys. Chem. B, 2010, 114, 15075–15078 CrossRef CAS PubMed.
- S. Xu, J. M. Nilles and K. H. Bowen, J. Chem. Phys., 2003, 119, 10696 CrossRef CAS.
- E. G. Diken, N. I. Hammer and M. A. Johnson, J. Chem. Phys., 2004, 120, 9899 CrossRef CAS PubMed.
- E. G. Diken, J. M. Headrick and M. A. Johnson, J. Chem. Phys., 2005, 122, 224317 CrossRef PubMed.
- M. Y. Choi, G. E. Douberly, T. M. Falconer, W. K. Lewis, C. M. Lindsay, J. M. Merritt, P. L. Stiles and R. E. Miller, Int. Rev. Phys. Chem., 2006, 25, 15–75 CrossRef CAS.
- F. Huisken, O. Werhahn, A. Y. Ivanov and S. A. Krasnokutski, J. Chem. Phys., 1999, 111, 2978–2984 CrossRef CAS.
- J. Chocholoušová, J. Vacek, F. Huisken, O. Werhahn and P. Hobza, J. Phys. Chem. A, 2002, 106, 11540–11549 CrossRef.
- K. von Haeften, S. Rudolph, I. Simanovski, M. Havenith, R. E. Zillich and K. B. Whaley, Phys. Rev. B: Condens. Matter Mater. Phys., 2006, 73, 54502 CrossRef.
- K. Hanke, M. Kaufmann, G. Schwaab, M. Havenith, C. T. Wolke, O. Gorlova, M. A. Johnson, B. P. Kar, W. Sander and E. Sanchez-Garcia, Phys. Chem. Chem. Phys., 2015, 17, 8518–8529 RSC.
- M. J. Frisch, et al., Gaussian 09, Revision D.01, Gaussian, Inc., Wallingford CT, 2009 Search PubMed.
- M. Head-Gordon, J. A. Pople and M. J. Frisch, Chem. Phys. Lett., 1988, 153, 503–506 CrossRef CAS.
- F. Weigend and R. Ahlrichs, Phys. Chem. Chem. Phys., 2005, 7, 3297–3305 RSC.
- A. D. Becke, Phys. Rev. A: At., Mol., Opt. Phys., 1988, 38, 3098–3100 CrossRef CAS.
- C. Lee, W. Yang and R. G. Parr, Phys. Rev. B: Condens. Matter Mater. Phys., 1988, 37, 785–789 CrossRef CAS.
- S. Grimme, J. Antony, S. Ehrlich and H. Krieg, J. Chem. Phys., 2010, 132, 154104 CrossRef PubMed.
- A. G. Csaszar, J. Am. Chem. Soc., 1992, 114, 9568–9575 CrossRef CAS.
- R. M. Balabin, Chem. Phys. Lett., 2009, 479, 195–200 CrossRef CAS.
- I. D. Reva, A. M. Plokhotnichenko, S. G. Stepanian, A. Y. Ivanov, E. D. Radchenko, G. G. Sheina and Y. P. Blagoi, Chem. Phys. Lett., 1995, 232, 141–148 CrossRef CAS.
- A. Y. Ivanov, G. Sheina and Y. P. Blagoi, Spectrochim. Acta, Part A, 1998, 55, 219–228 CrossRef.
- S. G. Stepanian, I. D. Reva, E. D. Radchenko, M. T. S. Rosado, M. L. T. S. Duarte, R. Fausto and L. Adamowicz, J. Phys. Chem. A, 1998, 102, 1041–1054 CrossRef CAS.
- K. Nauta and R. E. Miller, Science, 1999, 283, 1895–1897 CrossRef CAS PubMed.
- P. D. Godfrey and R. D. Brown, J. Am. Chem. Soc., 1995, 117, 2019–2023 CrossRef CAS.
- A. Metzelthin, E. Sánchez-García, Ö. Birer, G. Schwaab, W. Thiel, W. Sander and M. Havenith, ChemPhysChem, 2011, 12, 2009–2017 CrossRef CAS PubMed.
| This journal is © the Owner Societies 2016 |

