
 Open Access Article
 This Open Access Article is licensed under a Creative Commons Attribution-Non Commercial 3.0 Unported Licence
Accurate thermodynamic properties of gas phase hydrogen bonded complexes†
Anne S.
Hansen
,
Zeina
Maroun
,
Kasper
Mackeprang
,
Benjamin N.
Frandsen
and
Henrik G.
Kjaergaard
 *
*
Department of Chemistry, University of Copenhagen, Universitetsparken 5, DK-2100 Copenhagen Ø, Denmark. E-mail: hgk@chem.ku.dk; Fax: +45-35320322; Tel: +45-35320334
First published on 4th August 2016
Abstract
We have measured the infrared spectra of ethanol·dimethylamine and methanol·dimethylamine complexes in the 299–374 K temperature range, and have determined the enthalpy of complex formation (ΔH) to be −31.1 ± 2 and −29.5 ± 2 kJ mol−1, respectively. The corresponding values of the Gibbs free energy (ΔG) are determined from the experimental integrated absorbance and a calculated oscillator strength of the OH-stretching vibrational transition to be 4.1 ± 0.3 and 3.9 ± 0.3 kJ mol−1 at 302 and 300 K, respectively. The entropy, ΔS is determined from the values of ΔH and ΔG to be −117 ± 7 and −111 ± 10 J (mol K)−1 for the ethanol·dimethylamine and methanol·dimethylamine complexes, respectively. The determined ΔH, ΔG and ΔS values of the two complexes are similar, as expected by the similarity to their donor molecules ethanol and methanol. Values of ΔH, ΔG and ΔS in chemical reactions are often obtained from quantum chemical calculations. However, these calculated values have limited accuracy and large variations are found using different methods. The accuracy of the present ΔH, ΔG and ΔS values is such that the benchmarking of theoretical methods is possible.
1 Introduction
Infrared (IR) spectroscopy is an ideal technique for the detection of hydrogen bonds, which induce frequency shifts and changes in the band intensities.1–7 The importance of hydrogen bonds has long been acknowledged, as they play an essential role in many chemical and physical processes such as the formation and growth of aerosols.8–12 This nucleation is governed by the Gibbs free energy of complex formation (ΔG), and determination of accurate thermodynamic parameters of complexation is therefore crucial.13Quantum chemical calculations are often used to calculate ΔG of a process. However, the calculated ΔG values are associated with large variations based on the method used,14–18 and reliable ΔG values cannot be obtained from these calculations. The variation of ΔG originates from issues with the calculation of ΔH and ΔS, which can be associated with large uncertainties. Small differences in the optimised structure, obtained using different methods, generate variations in the calculated ΔH, which to some extent can be overcome by performing high level ab initio calculations. The issues related to the calculated ΔS are more problematic. The uncertainties in ΔG for weakly bound complexes arise from the very low frequency modes that appear in complexes, and the inherent harmonic treatment of these. These intrinsic problems with ΔS cannot be solved by using high level ab initio calculations. The standard ab initio calculated thermodynamic properties therefore lack accuracy and accurate experimental values of ΔG, ΔH and ΔS are necessary to facilitate improvements in the theoretical approach.3,18
The determination of thermodynamical properties is not new. However, a main issue is the accuracy with which these properties are determined. A variety of purely experimental techniques have been used to determine gas phase ΔH values. These include nuclear magnetic resonance spectroscopy,19,20 microwave spectroscopy,21 pressure measurements22–25 and IR spectroscopy.24,26–34 In most of these studies a van't Hoff type of equation is used to determine ΔH.35 For example, the ΔH value of the complex formation between methanol and trimethylamine has been determined in several different temperature studies.19,24,25,32 However, the variation in ΔH determined from these independent investigations is ∼14 kJ mol−1 for a ΔH value that is approximately −30 kJ mol−1. The reason for this discrepancy has not been resolved, and additional temperature experiments are required.
Recently, the Gibbs free energy of complex formation, ΔG, has been determined by combining theoretical calculations and experimental observations.32,34,36,37 In these studies, a calculated (e.g. OH-stretching) oscillator strength is used in combination with an experimental integrated absorbance of the corresponding transition. The calculated oscillator strength is less sensitive to the choice of computational method, compared to ΔS, and some of the issues in calculating the thermodynamic properties are circumvented.
Here, temperature controlled experiments from room temperature (RT) to 374 K are performed using an experimental setup and procedure aimed at minimising the experimental uncertainties in the determination of the thermodynamic parameters ΔH, ΔG and ΔS. The ethanol·dimethylamine (EtOH·DMA) and methanol·dimethylamine (MeOH·DMA) hydrogen bound complexes, Fig. 1, were chosen, as they have been successfully observed and characterised at room temperature and have KP values of ∼0.02, which facilitate the IR detection of the OH-stretching transition.34,38–41 The temperature study provides a ΔH value via the van't Hoff type equation. We combine the observed integrated absorbance of the OH-stretching vibration with a calculated OH-stretching oscillator strength to determine KP, and hence ΔG. The value of ΔS follows from the determined ΔH and ΔG values. The OH-stretching oscillator strength is calculated using a recently developed Local Mode Perturbation Theory (LMPT) model,42–44 which is an improvement to the previously used one dimensional (1D) local mode (LM) model.34,45
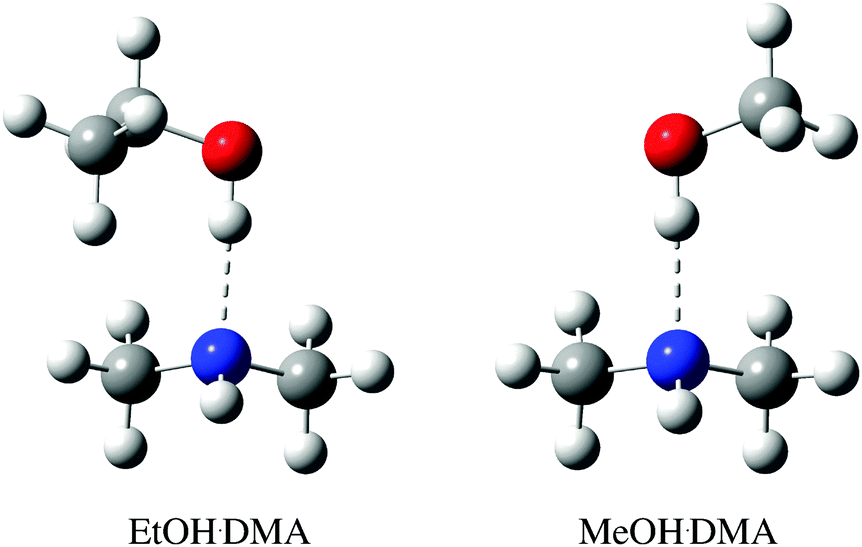 | ||
| Fig. 1 CCSD(T)-F12a/VDZ-F12 optimised structure of the lowest energy EtOH·DMA and MeOH·DMA conformers, with binding energies of −34.3 kJ mol−1 and −34.0 kJ mol−1, respectively. The higher energy conformers are shown in Fig. S9 (ESI†). | ||
2 Methods
2.1 Gas phase experiments
MeOH (Aldrich anhydrous, 99.8%) and EtOH (Kemetyl anhydrous, 99.9%) were purified by freeze, pump and thaw cycles. DMA (Aldrich anhydrous, 99+%) was used without further purification. Spectra were recorded using a VERTEX 70 or VERTEX 80 (Bruker) Fourier transform infrared (FTIR) spectrometer using a 1 cm−1 resolution and 500 scans. The spectrometers were fitted with a CaF2 beam splitter and an MCT detector. The mixture and monomer samples were prepared using a glass vacuum line (J. Young, base pressure of 1 × 10⁻⁴ Torr) equipped with several Varian and Agilent Technologies Pirani capacitance diaphragm pressure gauges (5 × 10⁻⁵–1500 mbar, PCG-750). Spectral subtraction and analyses were performed using OPUS 6.5 and OriginPro 2015. The observed OH-stretching band in each of the complexes was integrated from 3100 cm−1 to 3640 cm−1, Fig. S4 (ESI†). This might introduce a small error, as some of the intensity comes from the sidebands. However, the intensities of the sidebands are small compared to the intensity of the OH-stretching band, and part of their intensity probably originates from coupling to the strong fundamental OH-stretching transition. Additional experimental details are given in Section S1 (ESI†).The measurements were performed using a 2.4 m multireflection gas cell (Infrared Analysis, Inc.). The cell was equipped with a heating jacket connected to a Digi-Sense electronic temperature controller (Eutech Instruments Pte Ltd, Model 68900-03) and a Varian PCG-750 pressure gauge. The cell temperature and pressure were monitored throughout all experiments. We recorded spectra at different temperatures, from RT to 374 K. At each temperature, spectra of alcohol + DMA mixtures and the corresponding monomers were recorded and the average cell temperature and pressure were noted. The 2.4 m gas cell was filled with sample pressure at room temperature, placed in the spectrometer and heated. The cell was heated in steps of ∼10 K from 305 K to 374 K. This experimental procedure is less tedious than that in previous temperature studies, where a new mixture was prepared for each temperature measurement in an attempt to keep the product of the two monomer pressures fixed.30,32,34 To improve accuracy, repeated measurements were performed, see Section S1 (ESI†).
Spectra of the alcohol·DMA complexes were obtained by subtracting the individual monomer spectra from the spectrum of the alcohol + DMA mixture, see Fig. 2.46 The monomer spectra used in the subtraction were recorded at a slightly different pressure relative to the pressure of each monomer in the mixture. The monomer spectra were scaled and then subtracted from the spectrum of the alcohol + DMA mixture, and an accurate subtraction was found when a straight baseline was obtained in the regions with clearly assigned monomer absorbance features. The pressure of the individual monomers in the alcohol + DMA mixtures was obtained by multiplying the scaling factor from the spectral subtraction with the monomer pressure of the individual monomer spectra.
 | ||
| Fig. 2 Spectra of alcohol + DMA mixtures, alcohols, and DMA and the spectra of the EtOH·DMA and MeOH·DMA complexes obtained after spectral subtraction. The spectra have been offset. | ||
In non-RT experiments, the temperature and pressure fluctuations during each measurement were investigated. The cell temperature fluctuated with a maximum of 7 K, while the pressure fluctuations were limited to ≤0.5 Torr. A detailed description and analysis of the temperature and pressure fluctuations in the cell are given in the ESI,† Section S1.2.
2.2 Thermodynamics and calculations
The aim of the temperature controlled experiments is to determine ΔH. ΔG is related to ΔH and ΔS, and to KP by:| ΔG = ΔH − TΔS, | (1) |
ΔG = −RT![[thin space (1/6-em)]](https://www.rsc.org/images/entities/char_2009.gif) lnKP, lnKP, | (2) |
 | (3) |
KPversus T−1 should yield a straight line, from which ΔH and ΔS can be determined.35
The equilibrium investigated in the present study can be expressed as:
| A + B ⇌ C, | (4) |
 | (5) |
 | (6) |
 is the measured integrated absorbance of the characteristic OH-stretching band, fcalc is the corresponding calculated oscillator strength and l is the optical path length. The calculated oscillator strength used to determine PC will affect KP and hence ΔG (eqn (2)) but has no effect on ΔH, which is determined from the slope of lnKPversus T−1. Any change in the calculated oscillator strength can simply be expressed as an additional constant on the right hand side of eqn (3) (see the ESI,† Section S2).
The oscillator strength of the OH-stretching vibration in the complex is calculated using an LM approach.49–51 We use the LMPT model, which was originally developed to describe donor vibrations of hydrated complexes in which water is the donor unit.42,43 The model is based on a three dimensional LM model for the water unit,52 and the effect of each of the six intermolecular modes on the donor vibrational modes is included by Rayleigh–Schrödinger perturbation theory, where each intermolecular mode couples to each of the donor vibrational modes through the potential energy surface. The LMPT model has been found to calculate hydrogen bound OH-stretching frequencies that are within 10 cm−1 of experimental values of hydrated complexes, which is much better than the frequencies calculated using a LM model.42,53 The LMPT calculated oscillator strengths are also improved. However, the experimental intensities have large uncertainties, which makes it difficult to quantify the LMPT calculated oscillator strengths.43 Here, a modified LMPT version is used, in which a two dimensional LM model of the OH-stretching and the COH-bending oscillators is employed, and only the effect of the two most important intermolecular modes is included. Details on the modified LMPT model are given in the ESI,† Section S4.44
The structures of the complexes and corresponding monomers were optimised using density functional theory (DFT) with the B3LYP, B3LYP-D3, ωB97X-D and M06-2X functionals and the Møller Plesset (MP2) method in Gaussian0954,55 using the aug-cc-pVTZ basis set and the keywords: “opt = verytight” and “integral = ultrafine”. Subsequently, a harmonic frequency calculation was performed, with the same options as for the optimisation, to ensure that an energy minimum was found. From the frequency calculations, thermodynamic parameters were calculated using standard statistical mechanics.54,56 In addition, optimisations were performed using the CCSD(T)-F12a/VDZ-F12 method in Molpro2012 with the default optimisation threshold criteria and the correlation factor: (1/β)exp(−βr12), where β = 0.9.57,58 The oscillator strength of the OH-stretching vibration was calculated using the LMPT model, and potential energy and dipole moment surfaces were calculated using the CCSD(T)-F12a/VDZ-F12 method. The potential energy surface was calculated as described in Section S4 (ESI†) with all single point energies converged to 1 × 10⁻⁸ a.u.42,43 The dipole moments were calculated at the same geometries used to generate the potential energy surface. The finite field approach was used to determine the dipole moments with an applied field of ±0.0001 a.u.59 All integrals were evaluated numerically using the trapezoidal rule and the Matlab software package.60
3 Results and discussion
3.1 The OH-stretching vibration in the complexes
In Fig. 3, we show vibrational spectra in the OH-stretching region of the EtOH·DMA and MeOH·DMA complexes, recorded at different temperatures. The maximum of the OH-stretching vibration in the EtOH·DMA and MeOH·DMA complexes is temperature dependent. At RT, the maximum absorbances are observed at 3374 cm−1 and 3386 cm−1 for EtOH·DMA and MeOH·DMA, respectively, which shift to 3384 cm−1 and 3394 cm−1 at 374 K. The OH-stretching band maxima at RT are in agreement with previous observations.34,38–41 As the temperature increases, the band intensity decreases, which indicates the formation of less complex and a smaller equilibrium constant. At each temperature the integrated absorbance of the OH-stretching transition was determined and combined with a calculated oscillator strength to determine PC. In Fig. 4, PC determined at each temperature is plotted as a function of the multiplied monomer pressures. Fig. 4 includes the data from all experiments performed for the EtOH·DMA (three) and MeOH·DMA (two) complexes, see Section S1 (ESI†). | ||
| Fig. 3 The OH-stretching vibration in the EtOH·DMA and MeOH·DMA complexes recorded at different temperatures. The spectra have been offset. Experimental details are given in Section S1 (ESI†). | ||
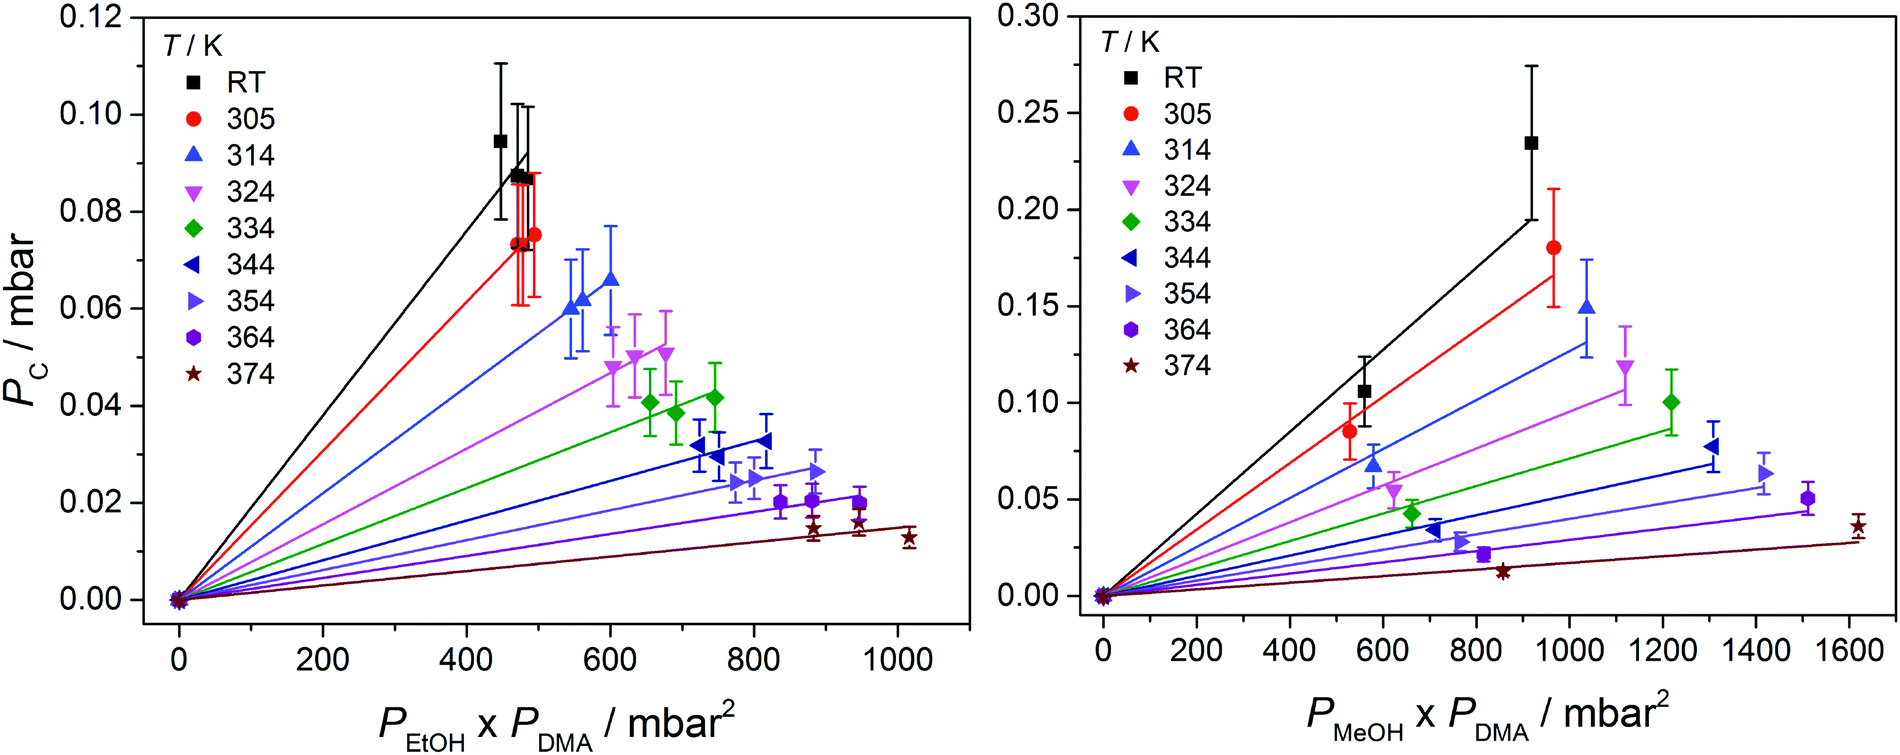 | ||
| Fig. 4 The pressure of the alcohol·DMA complexes as a function of the multiplied monomer pressures at different temperatures. At RT the values for EtOH·DMA were recorded at 301, 303 and 303 K, and for MeOH·DMA at 299 and 301 K. | ||
For each temperature a straight line passing through zero was fitted to the two or three data points, using the linear least squares fit with weighted error bars, see Sections S1.1 and S5 (ESI†). The equilibrium constants (KP) are obtained from the slopes of each fit multiplied by the standard pressure. In Table 1, we summarise the KP values determined. They range from ∼0.2 to ∼0.02 in the RT to 374 K temperature range, and decreases by ∼25% with every 10 K increase in temperature. Throughout the RT measurements, sample condensation and a continuous drop in pressure were observed (Fig. S5, ESI†), and we chose not to use this data point in the later fits.
| T | EtOH·DMAa | MeOH·DMAb | ||
|---|---|---|---|---|
| K P | ΔG | K P | ΔG | |
| a An LMPT fcalc value of 1.22 × 10⁻⁴ was used. The average RT value is 302 K. b An LMPT fcalc value of 1.27 × 10⁻⁴ was used. The average RT value is 300 K. | ||||
| RT | 19.0 × 10⁻² | 4.17 | 21.2 × 10⁻² | 3.87 |
| 305 | 15.3 × 10⁻² | 4.77 | 17.2 × 10⁻² | 4.47 |
| 314 | 11.0 × 10⁻² | 5.76 | 12.7 × 10⁻² | 5.39 |
| 324 | 7.79 × 10⁻² | 6.87 | 9.55 × 10⁻² | 6.33 |
| 334 | 5.76 × 10⁻² | 7.92 | 7.12 × 10⁻² | 7.33 |
| 344 | 4.09 × 10⁻² | 9.13 | 5.23 × 10⁻² | 8.44 |
| 354 | 3.08 × 10⁻² | 10.2 | 3.99 × 10⁻² | 9.48 |
| 364 | 2.27 × 10⁻² | 11.4 | 2.91 × 10⁻² | 10.7 |
| 374 | 1.49 × 10⁻² | 13.1 | 1.72 × 10⁻² | 12.6 |
The KP values of 0.19 and 0.21 determined at RT are in reasonable agreement with the value of 0.11 previously determined for the EtOH·DMA and MeOH·DMA complexes at 298 K and 300 ± 1 K, respectively.34,40 The discrepancy between our determined KP values and those previously determined arises primarily from differences in the calculated oscillator strengths. In the previous studies, 1D LM OH-stretching oscillator strengths of 2.2 × 10⁻⁴ (B3LYP/aug-cc-pVTZ) and 1.8 × 10⁻⁴ (CCSD(T)-F12a/VDZ-F12) were used for EtOH·DMA and MeOH·DMA, respectively.34,40 These oscillator strengths are expected to be overestimated compared to experimental values.42,53,61 Using the improved LMPT model the calculated OH-stretching oscillator strengths are 1.2 × 10⁻⁴ and 1.3 × 10⁻⁴ for EtOH·DMA and MeOH·DMA, respectively,44 which are smaller than the 1D LM calculated values. This decrease in fcalc will increase the determined PC, and thereby increase the determined KP values.
3.2 Enthalpy of hydrogen bond formation
In Fig. 5, lnKP from each data point in Fig. 4 is plotted as a function of T−1, and a straight line is fitted to the data. ΔH is determined from the slope of the linear fit, and is assumed to be temperature independent within this temperature range. We find ΔH values of −31.1 ± 2 kJ mol−1 and −29.5 ± 2 kJ mol−1 for the EtOH·DMA and MeOH·DMA complexes, respectively. If we include the room temperature data we get ΔH values of −31.5 kJ mol−1 and −29.4 kJ mol−1 for the EtOH·DMA and MeOH·DMA complexes, respectively (Fig. S14, ESI†). To check a possible temperature dependence of ΔH, we divided our data into two ranges, 305–334 K and 344–374 K (Section S6 and Fig. S15, ESI†). However, due to the small number of data points in each range, the standard error in each range is larger than the difference in the ΔH values and a temperature dependence of ΔH could not be concluded.
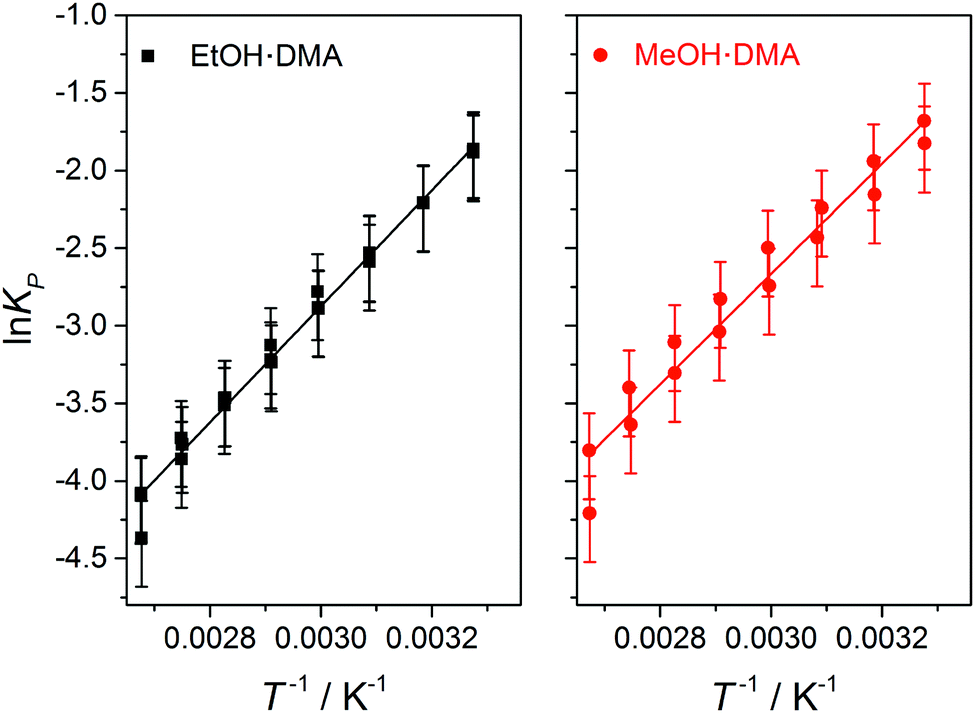 | ||
| Fig. 5 The lnKPversus T−1 plot for the EtOH·DMA (black squares, left) and MeOH·DMA (red circles, right) complexes. The slope of the fit is −ΔH/R, which is 3742 ± 247 K−1 and 3554 ± 300 K−1 for the EtOH·DMA and MeOH·DMA complexes, respectively. | ||
In Table 2, we summarise our determined ΔH values for the EtOH·DMA and MeOH·DMA complexes, and compare with those previously determined.25,34 Our determined ΔH values for the EtOH·DMA and MeOH·DMA complexes are roughly the same. This is not surprising as ΔH is essentially the binding strength of the complexes, and the calculated binding energy of the EtOH·DMA and MeOH·DMA complexes is similar.34,40 However, differences in ΔS might be expected, due to the larger number of vibrations in EtOH.
The result labelled “IR” in Table 2 refers to a previous temperature controlled experiment, which we have corrected for a missing temperature dependence. This changes the original value of −35.8 kJ mol−1 to −33.1 kJ mol−1 (see Section S7.1, ESI†).34 In these experiments, the PAPB product was attempted kept fixed at all temperatures, which makes the elevated temperature measurements much more complicated.34
The result labelled “Pressure” in Table 2 refers to a previous experiment where ΔH was determined from changes in pressure.25 Two chambers, equipped with mercury manometers, were connected with a valve.25 One container was filled with MeOH vapour and the other with DMA vapour. The valve connecting the two containers was opened, and the compounds were mixed, forming the MeOH·DMA complex. The decrease in pressure was assigned to complex formation, and KP was determined. This procedure was repeated at different temperatures, and the determined KP values were plotted against T−1. A ΔH value of −25.9 ± 1 kJ mol−1 was determined, where the standard deviation is related to the goodness of the fit without including the errors of the individual data points. The fact that condensation of the complex and monomers might occur at different rates is not taken into account, and would lead to an increased KP value. Any variation in condensation with temperature would lead to changes in the determined ΔH value.
3.3 Gibbs free energy and entropy of complexation
In Table 3, we compare our ΔG values, obtained with both 1D LM and LMPT calculated oscillator strengths, with those previously determined.34,40 The previous experimental results, given in brackets in Table 3, have been improved with better band integration and use of our present high level LMPT calculated oscillator strength (Section S7.2, ESI†). The use of the LMPT model reduces the 1D LM oscillator strength by about 30%, which for both complexes leads to a decrease in the determined ΔG values.44 Previously, both the fundamental OH-stretching and second overtone of the NHf-stretching vibrations were detected, and used to determine independent ΔG values.34,40 In the present study, we have calculated the 1D LM and LMPT XH-stretching oscillator strengths of both the fundamental OH-stretching and second overtone NHf-stretching vibrations using the CCSD(T)-F12a/VDZ-F12 method. The NHf-stretching vibration is relatively unaffected by the complexation, and therefore easier to calculate than the hydrogen bound OH-stretching vibration. This is reflected in the similar LM and LMPT NHf-stretching oscillator strengths. The LMPT oscillator strengths lead to ΔG values of 3.54 kJ mol−1 (299 K) and 4.50 kJ mol−1 (297 K) for EtOH·DMA and MeOH·DMA, respectively, from the second overtone NHf-stretching transitions (Table S7, ESI†). The small difference in temperature between the previous and present experiments will not affect ΔG more than a few percent (Table 1). With our LMPT oscillator strengths, the presently and the previously determined ΔG values for the alcohol·DMA complexes are within 0.8 kJ mol−1.34,40 We also find that the determined ΔG values for the alcohol·DMA complexes obtained from the OH- and NHf-stretching transitions are within approximately 0.6 kJ mol−1 of each other, which is significantly less than the variation obtained from purely quantum chemically calculated ΔG values.14–18,34,40| 1D LM | LMPTc | |
|---|---|---|
| a 1D LM and LMPT f values of 1.66 × 10⁻⁴ and 1.22 × 10⁻⁴ were used, respectively. b 1D LM and LMPT f values of 1.75 × 10⁻⁴ and 1.27 × 10⁻⁴ were used, respectively. c The values in parentheses are obtained using the experiments in ref. 34 and 40, with improved integration and oscillator strengths. | ||
| EtOH·DMAa | 4.93 | 4.17 (4.68) |
| MeOH·DMAb | 4.39 | 3.87 (4.64) |
We use the ΔH values given in Table 2 in combination with the ΔG values in Table 3 to determine the ΔS values given in Table 4. The uncertainty of ΔH gives an uncertainty of ±7 J (mol K)−1 and ±10 J (mol K)−1 in ΔS. Our ΔS value for the MeOH·DMA complex of −111 ± 10 J (mol K)−1 is significantly larger than the previous ΔS value of −83 J (mol K)−1, which has been determined from pressure experiments.25 Our determined ΔS value depends on the calculated oscillator strength. However, for our determined ΔS value to be 30 J (mol K)−1 lower, the fundamental OH-stretching oscillator strength would have to be 3.3 × 10⁻⁵. This value is a factor of 4 smaller than our LMPT calculated value of 1.3 × 10⁻⁴. This difference is much larger than the expected uncertainty of the LMPT model. For example, the LMPT calculated oscillator strength of the fundamental bound OHb-stretching transition in the water dimer is 4.1 × 10⁻⁵, which compares well with experimental values of 2.7–4.3 × 10⁻⁵ and a full dimensional (VPT2) calculated value of 2.8 × 10−5.43,53,61,62 We believe that the previous ΔS value for MeOH·DMA has significantly larger uncertainty than stated. Our determined ΔS values are similar to the entropy of vaporisation (ΔvapS) for MeOH and EtOH, which is perhaps not surprising.35
3.4 Calculated thermodynamic properties
In Table 5, calculated thermodynamic parameter, using a few common ab initio and DFT methods, are summarised for the lowest energy EtOH·DMA and MeOH·DMA conformers. The CCSD(T)-F12a/VDZ-F12 electronic energy and the DFT thermodynamic corrections were combined to calculate thermodynamic parameters, denoted F12//DFT. The B3LYP calculated ΔH values are substantially higher than those calculated using all other methods due to its lack of dispersion. For all other methods the variation in ΔH is 4.5 kJ mol−1 or about 15%. The variations in calculated ΔS are less than 10%, if we exclude the B3LYP results, which lead to a TΔS variation of up to 4 kJ mol−1 at 374 K. The variation in ΔG, excluding the B3LYP results, is 7.5 kJ mol−1 and 4.3 kJ mol−1 for EtOH·DMA and MeOH·DMA, respectively. The measured and calculated ΔS values of the EtOH·DMA complex are larger than those of the MeOH·DMA complex. This probably arises from the larger number of vibrations and larger flexibility in EtOH; however, the uncertainties are larger than the differences. Overall, we find that the MP2 method predicts the experimentally determined thermodynamic parameters best.| EtOH·DMA | MeOH·DMA | |||||||
|---|---|---|---|---|---|---|---|---|
| ΔG | −ΔH | −ΔS | K P | ΔG | −ΔH | −ΔS | K P | |
| a All calculations were performed using the aug-cc-pVTZ basis set, except for F12 (CCSD(T)-F12a/VDZ-F12) where the VDZ-F12 basis set was used. b LMPT fcalc values of 1.2 × 10⁻⁴ and 1.3 × 10⁻⁴ were used for the EtOH·DMA and MeOH·DMA complexes, respectively. c Pressure measurements at 298 K from ref. 25. | ||||||||
| B3LYP | 12.4 | 18.2 | 102 | 6.77 × 10⁻³ | 10.5 | 19.8 | 102 | 1.42 × 10⁻² |
| B3LYP-D3 | 5.72 | 29.3 | 118 | 9.97 × 10⁻² | 3.56 | 29.2 | 110 | 2.38 × 10⁻¹ |
| ωB97X-D | 6.73 | 29.3 | 120 | 6.62 × 10⁻² | 5.52 | 28.3 | 113 | 1.08 × 10⁻¹ |
| M06-2X | 11.6 | 27.4 | 131 | 9.32 × 10⁻³ | 7.27 | 27.3 | 116 | 5.33 × 10⁻² |
| MP2 | 4.00 | 31.6 | 120 | 2.00 × 10⁻¹ | 3.01 | 30.7 | 113 | 2.97 × 10⁻¹ |
| F12//B3LYP | 3.22 | 27.3 | 102 | 2.72 × 10⁻¹ | 3.40 | 27.0 | 102 | 2.53 × 10⁻¹ |
| F12//B3LYP-D3 | 7.91 | 27.1 | 118 | 4.12 × 10⁻² | 5.93 | 26.8 | 110 | 9.13 × 10⁻² |
| F12//ωB97X-D | 8.74 | 27.3 | 121 | 2.94 × 10⁻² | 6.92 | 26.9 | 113 | 6.14 × 10⁻² |
| F12//M06-2X | 11.5 | 27.5 | 131 | 9.54 × 10⁻³ | 7.27 | 27.3 | 116 | 5.31 × 10⁻² |
| Experimentalb | 4.17 | 31.1 | 117 | 1.90 × 10⁻¹ | 3.87 | 29.5 | 111 | 2.12 × 10⁻¹ |
| Experimentalc | — | — | — | — | 1.25 | 25.9 | 83 | 5.9 × 10⁻¹ |
4 Conclusions
Thermodynamic parameters of the EtOH·DMA and MeOH·DMA hydrogen bound complexes were determined from measurements of IR spectra in the room temperature (299–303 K) to 374 K temperature range. The OH-stretching vibration in the complexes was recorded and identified. By relying on spectroscopic techniques to determine the pressure of each of the three compounds in the mixture, we limit the effect that condensation has on the results. From the temperature measurements, purely experimental ΔH values were determined for the EtOH·DMA and MeOH·DMA complexes. We combine the observed integrated absorbance and a calculated oscillator strength to determine ΔG at each temperature. As the temperature increases, the OH-stretching band intensity decreases, which indicates the formation of less complex and a decrease in the equilibrium constant. From the determined ΔH and ΔG values, ΔS was determined. The observed differences in thermodynamic parameters between the EtOH and MeOH complexes are small and within their uncertainty. The accuracy in the parameters is significantly better than that achieved using typical quantum chemical methods, and the presented results serve as a theoretical benchmark.Acknowledgements
We thank Jan H. Jensen and Jimmy C. Kromann for helpful discussions. We acknowledge the financial support from the Danish Council for Independent Research – Natural Sciences, the Danish Center for Scientific Computing, the Center for Exploitation of Solar Energy funded by the University of Copenhagen and the Department of Chemistry at University of Copenhagen.References
- E. Arunan, G. R. Desiraju, R. A. Klein, J. Sadlej, S. Scheiner, I. Alkorta, D. C. Clary, R. H. Crabtree, J. J. Dennenberg, P. Hobza, H. G. Kjaergaard, A. C. Legon, B. Mennucci and D. J. Nesbitt, Pure Appl. Chem., 2011, 83, 1619–1636 CAS.
- S. Aloisio and J. S. Francisco, Acc. Chem. Res., 2000, 33, 825–830 CrossRef CAS PubMed.
- V. Vaida and J. E. Headrick, J. Phys. Chem. A, 2000, 104, 5401–5412 CrossRef CAS.
- H. G. Kjaergaard, T. W. Robinson, D. L. Howard, J. S. Daniel, J. E. Headrick and V. Vaida, J. Phys. Chem. A, 2003, 107, 10680–10686 CrossRef CAS.
- V. Vaida, H. G. Kjaergaard and K. J. Feierabend, Int. Rev. Phys. Chem., 2003, 22, 203–219 CrossRef CAS.
- J. S. Daniel, S. Solomon, H. G. Kjaergaard and D. P. Schofield, Geophys. Res. Lett., 2004, 31, L06118 Search PubMed.
- W. Klemperer and V. Vaida, Proc. Natl. Acad. Sci. U. S. A., 2006, 103, 10584–10588 CrossRef CAS PubMed.
- J. Kazil, P. Stier, K. Zhang, J. Quaas, S. Kinne, D. O'Donnell, S. Rast, M. Esch, S. Ferrachat, U. Lohmann and J. Feichter, Atmos. Chem. Phys., 2010, 10, 10733–10752 CrossRef CAS.
- J. Kirkby, J. Curtius, J. Almeida, E. Dunne, J. Duplissy, S. Ehrhart, A. Franchin, S. Gagné, L. Ickes, A. Kürten, A. Kupc, A. Metzger, F. Riccobono, L. Rondo, S. Schobesberger, G. Tsagkogeorgas, D. Wimmer, A. Amorim, F. Bianchi, M. Breitenlechner, A. David, J. Dommen, A. Downard, M. Ehn, R. C. Flagan, S. Haider, A. Hansel, D. Hauser, W. Jud, H. Junninen, F. Kreissl, A. Kvashin, A. Laaksonen, K. Lehtipalo, J. Lima, E. R. Lovejoy, V. Makhmutov, S. Mathot, J. Mikkilä, P. Minginette, S. Mogo, T. Nieminen, A. Onnela, P. Pereira, T. Petäjä, R. Schnitzhofer, J. H. Seinfeld, M. Sipilä, Y. Stozhkov, F. Stratmann, A. Tomé, J. Vanhanen, Y. Viisanen, A. Vrtala, P. E. Wagner, H. Walther, E. Weingartner, H. Wex, P. M. Winkler, K. S. Carslaw, D. R. Worsnop, U. Baltensperger and M. Kulmala, Nature, 2011, 476, 429–433 CrossRef CAS PubMed.
- R. Zhang, A. Khalizov, L. Wang, M. Hu and W. Xu, Chem. Rev., 2012, 112, 1957–2011 CrossRef CAS PubMed.
- M. Kulmala, J. Kontkanen, H. Junninen, K. Lehtipalo, H. E. Manninen, T. Nieminen, T. Petäjä, M. Sipiä, S. Schobesberger, P. Rantala, A. Franchin, T. Jokinen, E. Järvinen, M. Äijälä, J. Kangasluoma, J. Hakala, P. P. Aalto, P. Paasonen, J. Mikkilä, J. Vanhanen, J. Aalto, H. Hakola, U. Makkonen, T. Ruuskanen, R. L. Mauldin, J. Duplissy, H. Vehkamäki, J. Bäck, A. Kortelainen, I. Riipinen, T. Kurtén, M. V. Johnston, J. N. Smith, M. Ehn, T. F. Mentel, K. E. J. Lehtinen, A. Laaksonen, V.-M. Kerminen and D. R. Worsnop, Science, 2013, 339, 943–946 CrossRef CAS PubMed.
- J. Almeida, S. Schobesberger, A. Kürten, I. K. Ortega, O. Kupiainen-Määttä, A. P. Praplan, A. Adamov, A. Amorim, F. Bianchi, M. Breitenlechner, A. David, J. Dommen, N. M. Donahue, A. Downard, E. Dunne, J. Duplissy, S. Ehrhart, R. C. Flagan, A. Franchin and R. Guida, Nature, 2013, 502, 359–363 CrossRef CAS PubMed.
- I. K. Ortega, O. Kupiainen, T. Kurtén, T. Olenius, O. Wilkman, M. J. McGrath, V. Loukonen and H. Vehkamäki, Atmos. Chem. Phys., 2012, 12, 225–235 CAS.
- F. C. P. IV, M. E. Dunn and G. C. Shields, J. Phys. Chem. A, 2005, 109, 4905–4910 CrossRef PubMed.
- T. Kurtén, M. R. Sundberg, H. Vehkamäki, M. Noppel, J. Blomqvist and M. Kulmala, J. Phys. Chem. A, 2006, 110, 7178–7188 CrossRef PubMed.
- A. B. Nadykto and F. Yu, Chem. Phys. Lett., 2007, 435, 14–18 CrossRef CAS.
- J. Elm, M. Bilde and K. V. Mikkelsen, J. Chem. Theory Comput., 2012, 8, 2071–2077 CrossRef CAS PubMed.
- N. Bork, L. Du, H. Reiman, T. Kurtén and H. G. Kjaergaard, J. Phys. Chem. A, 2014, 118, 5316–5322 CrossRef CAS PubMed.
- A. D. H. Clague, G. Govil and H. J. Bernstein, Can. J. Chem., 1969, 47, 625–629 CrossRef CAS.
- G. Govil, A. D. H. Clague and H. J. Bernstein, J. Chem. Phys., 1968, 49, 2821–2825 CrossRef CAS.
- C. C. Costain and G. P. Srivastava, J. Chem. Phys., 1964, 41, 1620–1627 CrossRef CAS.
- C. Ling, S. D. Christian and H. E. Affsprung, J. Phys. Chem., 1966, 70, 901–904 CrossRef CAS.
- C. Ling, S. D. Christian, H. E. Affsprung and R. W. Gray, J. Chem. Soc. A, 1966, 293–296 RSC.
- M. Fild, M. F. Swiniarski and R. R. Holmes, Inorg. Chem., 1970, 9, 839–843 CrossRef CAS.
- D. J. Millen and G. W. Mines, J. Chem. Soc., Faraday Trans. 2, 1974, 70, 693–699 RSC.
- R. G. Inskeep, F. E. Dickson and J. M. Kelliher, J. Mol. Spectrosc., 1960, 4, 477–479 CrossRef CAS.
- E. Hirano and K. Kozima, Bull. Chem. Soc. Jpn., 1966, 39, 1216–1220 CrossRef CAS.
- S. D. Christian and E. E. Tucker, J. Phys. Chem., 1970, 74, 214–216 CrossRef CAS.
- R. K. Thomas, Proc. R. Soc. A, 1971, 322, 137–146 CrossRef CAS.
- D. L. Howard and H. G. Kjaergaard, Phys. Chem. Chem. Phys., 2008, 10, 4113–4118 RSC.
- B. Michielsen, W. A. Herrebout and B. J. van der Veken, ChemPhysChem, 2007, 8, 1188–1198 CrossRef CAS PubMed.
- L. Du and H. G. Kjaergaard, J. Phys. Chem. A, 2011, 115, 12097–12104 CrossRef CAS PubMed.
- B. Michielsen, J. J. J. Dom, B. J. van der Veken, S. Hesse, M. A. Suhm and W. A. Herrebout, Phys. Chem. Chem. Phys., 2012, 14, 6469–6478 RSC.
- L. Du, K. Mackeprang and H. G. Kjaergaard, Phys. Chem. Chem. Phys., 2013, 15, 10194–10206 RSC.
- P. Atkins and J. de Paula, Physical Chemistry, Oxford University Press, 9th edn, 2010 Search PubMed.
- S. Chung and M. Hippler, J. Chem. Phys., 2006, 124, 214316 CrossRef PubMed.
- M. Hippler, J. Chem. Phys., 2007, 127, 084306 CrossRef PubMed.
- D. J. Millen and J. Zabicky, J. Chem. Soc., 1965, 3080–3085 RSC.
- M. A. Hussein and D. J. Millen, J. Chem. Soc., Faraday Trans. 2, 1974, 70, 685–692 RSC.
- A. S. Hansen, L. Du and H. G. Kjaergaard, Phys. Chem. Chem. Phys., 2014, 16, 22882–22891 RSC.
- D. L. Howard and H. G. Kjaergaard, J. Phys. Chem. A, 2006, 110, 9597–9601 CrossRef CAS PubMed.
- K. Mackeprang, H. G. Kjaergaard, T. Salmi, V. Hänninen and L. Halonen, J. Chem. Phys., 2014, 140, 184309 CrossRef PubMed.
- K. Mackeprang, V. Hänninen, L. Halonen and H. G. Kjaergaard, J. Chem. Phys., 2015, 142, 094304 CrossRef PubMed.
- K. Mackeprang and H. G. Kjaergaard, Unpublished results.
- B. R. Henry and H. G. Kjaergaard, Can. J. Chem., 2002, 80, 1635–1642 CrossRef CAS.
- L. Du, J. R. Lane and H. G. Kjaergaard, J. Chem. Phys., 2012, 136, 184305 CrossRef PubMed.
- P. Atkins, J. de Paula and R. Friedman, Quanta, Matter, and Change: a molecular approach to physical chemistry, Oxford University Press, 2009 Search PubMed.
- B. I. Niefer, H. G. Kjaergaard and B. R. Henry, J. Chem. Phys., 1993, 99, 5682–5700 CrossRef CAS.
- B. R. Henry, Acc. Chem. Res., 1977, 10, 207–213 CrossRef CAS.
- B. R. Henry, Acc. Chem. Res., 1987, 20, 429–435 CrossRef CAS.
- B. R. Henry and H. G. Kjaergaard, Can. J. Chem., 2002, 80, 1635–1642 CrossRef CAS.
- H. G. Kjaergaard, B. R. Henry, H. Wei, S. Lefebvre, T. Carrington, O. S. Mortensen and M. L. Sage, J. Chem. Phys., 1994, 100, 6228–6239 CrossRef CAS.
- H. G. Kjaergaard, A. L. Garden, G. M. Chaban, R. B. Gerber, D. A. Matthews and J. F. Stanton, J. Phys. Chem. A, 2008, 112, 4324–4335 CrossRef CAS PubMed.
- M. J. Frisch, G. W. Trucks, H. B. Schlegel, G. E. Scuseria, M. A. Robb, J. R. Cheeseman, G. Scalmani, V. Barone, B. Mennucci, G. A. Petersson, H. Nakatsuji, M. Caricato, X. Li, H. P. Hratchian, A. F. Izmaylov, J. Bloino, G. Zheng, J. L. Sonnenberg, M. Hada, M. Ehara, K. Toyota, R. Fukuda, J. Hasegawa, M. Ishida, T. Nakajima, Y. Honda, O. Kitao, H. Nakai, T. Vreven, J. A. Montgomery, Jr., J. E. Peralta, F. Ogliaro, M. Bearpark, J. J. Heyd, E. Brothers, K. N. Kudin, V. N. Staroverov, R. Kobayashi, J. Normand, K. Raghavachari, A. Rendell, J. C. Burant, S. S. Iyengar, J. Tomasi, M. Cossi, N. Rega, J. M. Millam, M. Klene, J. E. Knox, J. B. Cross, V. Bakken, C. Adamo, J. Jaramillo, R. Gomperts, R. E. Stratmann, O. Yazyev, A. J. Austin, R. Cammi, C. Pomelli, J. W. Ochterski, R. L. Martin, K. Morokuma, V. G. Zakrzewski, G. A. Voth, P. Salvador, J. J. Dannenberg, S. Dapprich, A. D. Daniels, Ã. Farkas, J. B. Foresman, J. V. Ortiz, J. Cioslowski and D. J. Fox, Gaussian 09 Revision D.01, Gaussian Inc., Wallingford CT, 2009 Search PubMed.
- R. Dennington, T. Keith and J. Millam, GaussView Version 5, Semichem Inc., Shawnee Mission KS, 2009 Search PubMed.
- V. Vaida and J. E. Headrick, J. Phys. Chem. A, 2000, 104, 5401–5412 CrossRef CAS.
- H.-J. Werner, P. J. Knowles, G. Knizia, F. R. Manby, M. Schütz, P. Celani, T. Korona, R. Lindh, A. Mitrushenkov, G. Rauhut, K. R. Shamasundar, T. B. Adler, R. D. Amos, A. Bernhardsson, A. Berning, D. L. Cooper, M. J. O. Deegan, A. J. Dobbyn, F. Eckert, E. Goll, C. Hampel, A. Hesselmann, G. Hetzer, T. Hrenar, G. Jansen, C. Köppl, Y. Liu, A. W. Lloyd, R. A. Mata, A. J. May, S. J. McNicholas, W. Meyer, M. E. Mura, A. Nicklass, D. P. O'Neill, P. Palmieri, D. Peng, K. Pflüger, R. Pitzer, M. Reiher, T. Shiozaki, H. Stoll, A. J. Stone, R. Tarroni, T. Thorsteinsson and M. Wang, MOLPRO, version 2012.1, a package of ab initio programs, 2012, see http://www.molpro.net Search PubMed.
- H.-J. Werner, P. J. Knowles, G. Knizia, F. R. Manby and M. Schütz, Wiley Interdiscip. Rev.: Comput. Mol. Sci., 2012, 2, 242–253 CrossRef CAS.
- B. J. Miller, J. R. Lane and H. G. Kjaergaard, Phys. Chem. Chem. Phys., 2011, 13, 14183–14193 RSC.
- MATLAB and Statistics Toolbox Release R2013a, The MathWorks Inc., Natick, Massachusetts, United States.
- K. Kuyanov-Prozument, M. Y. Choi and A. F. Vilesov, J. Chem. Phys., 2010, 132, 014304 CrossRef PubMed.
- J. Ceponkus, P. Uvdal and B. Nelander, J. Phys. Chem. A, 2008, 112, 3921–3926 CrossRef CAS PubMed.
Footnote |
| † Electronic supplementary information (ESI) available: Experimental details; temperature and pressure fluctuations; pressures determined from the ideal gas law; KP and ΔH values from the individual experiments; optimised structures of the higher energy conformers; calculated thermodynamic parameters; thermodynamic equations; discussion of previous studies. See DOI: 10.1039/c6cp04648g |
| This journal is © the Owner Societies 2016 |