Self-assembly of like-charged nanoparticles into Voronoi diagrams†
Received
20th June 2016
, Accepted 22nd August 2016
First published on 22nd August 2016
Abstract
The self-assembly of nanoscopic building blocks into higher order macroscopic patterns is one possible approach for the bottom-up fabrication of complex functional systems. Macroscopic pattern formation, in general, is determined by the reaction and diffusion of ions and molecules. In some cases macroscopic patterns emerge from diffusion and interactions existing between nanoscopic or microscopic building blocks. In systems where the distribution of the interaction-determining species is influenced by the presence of a diffusion barrier, the evolving macroscopic patterns will be determined by the spatiotemporal evolution of the building blocks. Here we show that a macroscopic pattern can be generated by the spatiotemporally controlled aggregation of like-charged carboxyl-terminated gold nanoparticles in a hydrogel, where clustering is induced by the screening effect of the sodium ions that diffuse in a hydrogel. Diffusion fronts of the sodium ions and the induced nanoparticle aggregation generate Voronoi diagrams, where the Voronoi cells consist of aggregated nanoparticles and their edges are aggregation-free and nanoparticle-free zones. We also developed a simple aggregation–diffusion model to adequately describe the evolution of the experimentally observed Voronoi patterns.
Introduction
The self-assembly of nanoscopic and colloidal building blocks into higher order patterns and structures on the nanoscale, the microscale and even on the macroscale has gained much interest in the past few decades because of providing new bottom-up design routes. The recent interest in nanoscience is focused on designing and engineering nanostructured materials from nanoscopic building blocks, e.g., nanoparticles (NPs), because these materials can have unique optical, chemical, electronic and magnetic properties, and they can be used in various fields of science and technology.1–5 Self-assembly utilizes interactions existing at the nanoscale and the colloidal scale between building blocks. Both understanding and having control of these interactions can help to rationally design higher order structural elements.6–8 Most studies investigate the assembly of nanoscopic building blocks into structures and patterns at the nanoscale or the assembly of nanoparticles and colloids into microstructures (e.g., nanocrystals).9–18 Solvent evaporation induced self-assembly techniques are also commonly used to prepare assemblies at desired solid substrates with macroscopic dimensions.19–21 However, from the technological point of view an important aspect would be to extend it to drive the assembly of small building blocks into macroscopic patterns, where five or six orders of magnitude difference can exist between the characteristic length scales of the building blocks and the emerging structures. There are just a few trials to use nanoscopic and colloidal building blocks for generating patterns at the macroscale, examples incorporate periodic precipitation from charged NPs existing at the millimeter scale22 or the self-assembly of micrometer sized spherulites into centimeter sized helicoidal patterns.23 There are several patterns that exist in the nature as well as in the laboratory, in which the interaction of the transport of chemical species (such as diffusion) with their reactions can lead to pattern formation.24,25 One of them is the Voronoi diagram, which is a way of dividing (usually 2D) space into a number of regions. A set of points (called seeds) is specified beforehand and for each seed there will be a corresponding region consisting of all points closer to that seed than to any other. These regions are called Voronoi cells and these diagrams can be observed in various natural systems and used in many fields of science to solve variety of problems such as the modeling self-organization of tissues,26 competition in ecological systems,27 solving nearest neighbor problems28 and the generation of unstructured grids for spatial discretization.29 Voronoi diagrams can be generated using various ways. Chemistry offers a robust approach to generate Voronoi patterns using precipitation reactions of ionic species coupled to their diffusion that has been well explored in the past few years.30–35 In this paper we show that the aggregation process of like-charged NPs induced by a monovalent cation can be used to generate Voronoi diagrams, where the Voronoi cells are built of aggregated NPs and the boundary of these cells consists of NP-free regions.
Experimental
We used negatively charged gold NPs (an average metal core diameter of 6.5 nm and standard deviation σ = 15%) stabilized with self-assembled monolayers of mercaptoundecanoic acid (MUA; fully deprotonated at pH ∼ 11). In a typical experiment, an agarose (Sigma-Aldrich, Type I) solution of 1 wt% was prepared using distilled water, and the pH was set to 11 with tetramethylammonium hydroxide (Sigma-Aldrich). Then the solution was stirred continuously and heated up to 90 °C until the solution became clear. The hot solution was removed from the hot plate and stirred until its temperature reached 40–45 °C. After then we added AuMUA to the agarose solution to obtain a 2 mM concentration of AuMUA in the hydrogel. We used this temperature range to avoid the dissociation of protective thiol groups from the surface of NPs and maintain the solution to be non-viscous liquid. We poured the solution into a Petri dish to obtain a 2 mm thick homogeneous gel film and waited until the gelation process was completed (2 h). In a typical experiment to induce NP aggregation and generate patterns, sodium chloride (NaCl, Sigma-Aldrich) crystals were randomly placed on top of the solid hydrogel, we used both bigger (an average diameter of 4 mm) and smaller (an average diameter of 0.2 mm) crystals as well. Pattern formation was monitored using an image processing system for 30 min and all experiments were carried out at room temperature (22 ± 3 °C).
Results and discussion
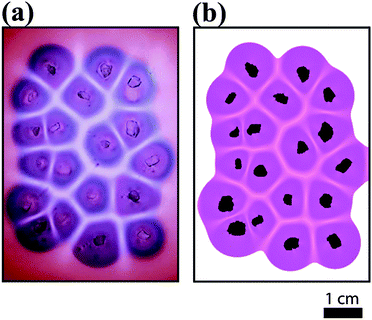
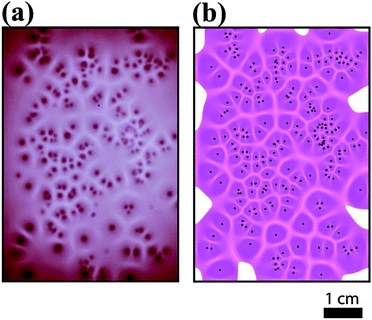
Originally, the color of the hydrogel was red originated from the surface plasmon resonance (SPR) of dispersed NPs in the gel. MUA coated AuNPs in the gel are dispersed and free under strong alkaline conditions (pH ∼ 11) because the apparent pKa of MUA is ∼8.3,36 which provides that all carboxylate groups are deprotonated (charged) at the head groups of stabilizing ligands attached to the surface of NPs. Electrostatic repulsion between NPs overcomes the van der Waals (vdW) attraction, thus providing the stability of NPs in the medium. Immediately when we placed sodium chloride crystals on the surface of the solid hydrogel, the crystals started to dissolve at the contact with the gel interface and a liquid layer formed around the crystals containing saturated sodium chloride (6.14 M at 22 °C). Parallel to this process, sodium ions diffused in the gel and diffusively moving fronts evolved radially around the small crystal pieces. Near the edges of the crystals the aggregation of free NPs started, this process was manifested by the pronounced color change from red to blue, which is due to the plasmon coupling between the aggregated NPs and the lack of such coupling between dispersed particles. The aggregation process of carboxylate terminated like-charged NPs induced by sodium cations is mostly governed by the electrostatic screening effect, which means that the cations weaken the electrostatic repulsion between NPs. Finally, the attractive vdW interactions overcome the electrostatic repulsion so that the NPs lose their stability and they aggregate. As diffusion fronts of sodium ions proceed, the size of the domains containing aggregated NPs increased. In this region the concentration of the free NPs is low due to the aggregation process induced by the NP-cation interaction. This implies that dispersed NPs diffuse from the regions, where the concentration of the sodium ions is too low to induce the aggregation, to regions where all NPs are aggregated. This process maintains a diffusion flux of free NPs between regions located farther and closer to the crystals. After a certain time period (depending on the distance of the crystal seeds, in our experiments it was ∼30 min) the Voronoi cells are formed and the patterns became well developed. Fig. 1 shows the evolution of Voronoi cells in the case of using bigger and smaller pieces of sodium chloride crystals. It can be clearly observed that in regions between the salt crystal seeds aggregation-free zones (white domains) evolved and their thickness depends on the distance between sodium chloride crystals. The formation of this aggregation-free zone is due to the cross diffusion of sodium ions and dispersed NPs. This cross diffusion and aggregation of NPs produces depleted zones for dispersed NPs, because dispersed NPs tend to diffuse toward aggregated NPs, where their concentration is low. When two oppositely moving diffusion fronts of sodium ions meet, the concentration of dispersed NPs is already low (practically zero) and no aggregation occurs, thus chemically generated Voronoi cells consist of aggregated NPs and their boundaries are a set of aggregation-free and NP-free zones. To support this hypothesis, we took UV-vis spectra from different regions of the hydrogel (Fig. 2). Native (non-aggregated) NPs have maximum absorbance at ∼530 nm (region 1 in Fig. 2) providing characteristic red color to the hydrogel. When the front of sodium ions passes a given region, NPs start to aggregate resulting in a distinct color change from red to blue (purple). This aggregation process manifests itself in the spectrum, the wavelength for maximum absorbance shifts towards higher wavelength and the maximum of the absorbance decreases (region 2 in Fig. 2). Analyzing the spectrum from region 3 in Fig. 2 clearly provides the information that compared to the cell regions of the Voronoi diagram, the edges of Voronoi cells are strongly depleted. The presence of a small amount of larger aggregates in this region cannot be excluded, since the spectrum indicates a very low intensity peak at around 620 nm. But the original localized plasmon resonance peak corresponding to the native NPs cannot be observed. The chemically generated Voronoi diagram is in good accordance with a geometrically generated diagram (see the ESI,† Fig. S1).
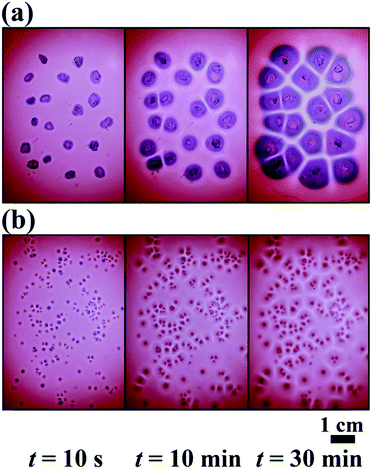 |
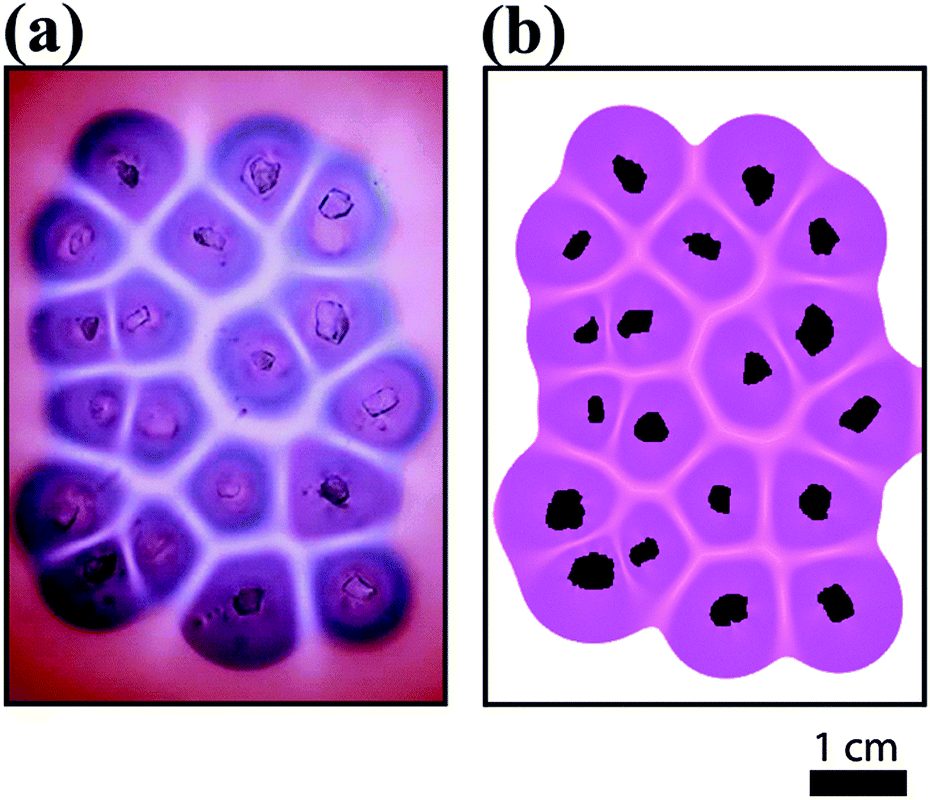
| | Fig. 1 Formation of Voronoi diagrams in an agarose gel (1 wt%) containing dispersed AuMUA NPs (pH = 11) of 2 mM (in terms of gold atoms) using (a) bigger (∼4 mm) and (b) smaller (∼0.2 mm) sodium chloride crystals placed randomly on top of the solid hydrogel. Blue (purple) and red colors correspond to the aggregation states of the particles (red – dispersed NPs; blue (purple) – aggregated NPs). | |
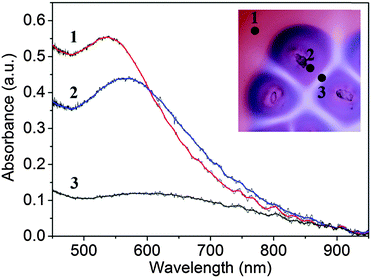 |
| | Fig. 2 UV-vis spectra of different regions in the agarose gel: (1) dispersed NPs; (2) aggregated NPs; (3) aggregation-free zone. Inset shows the measured regions in the microscopic image. | |
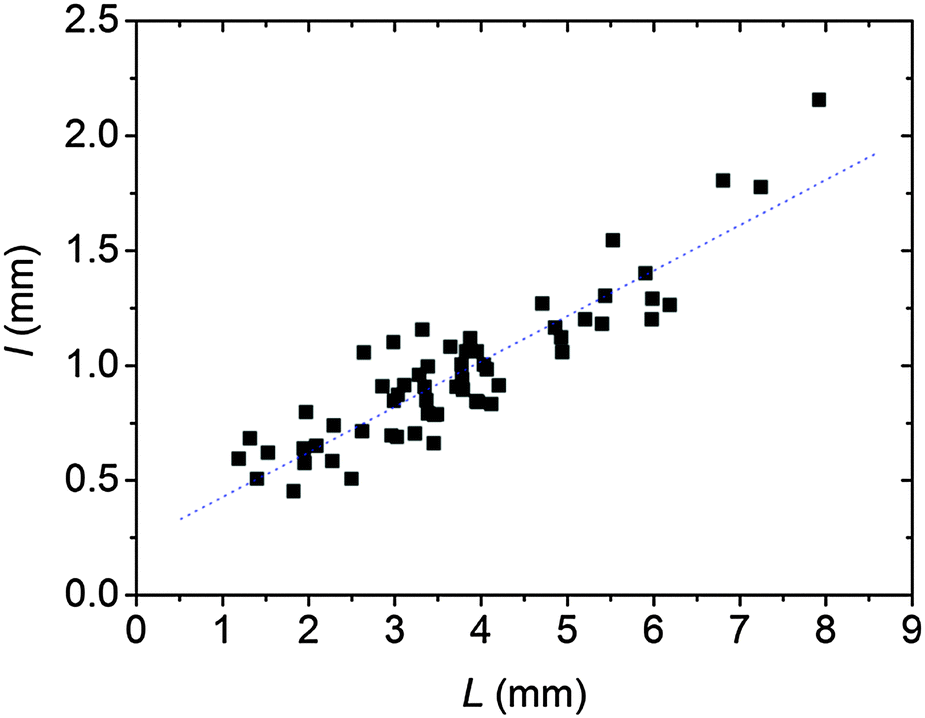
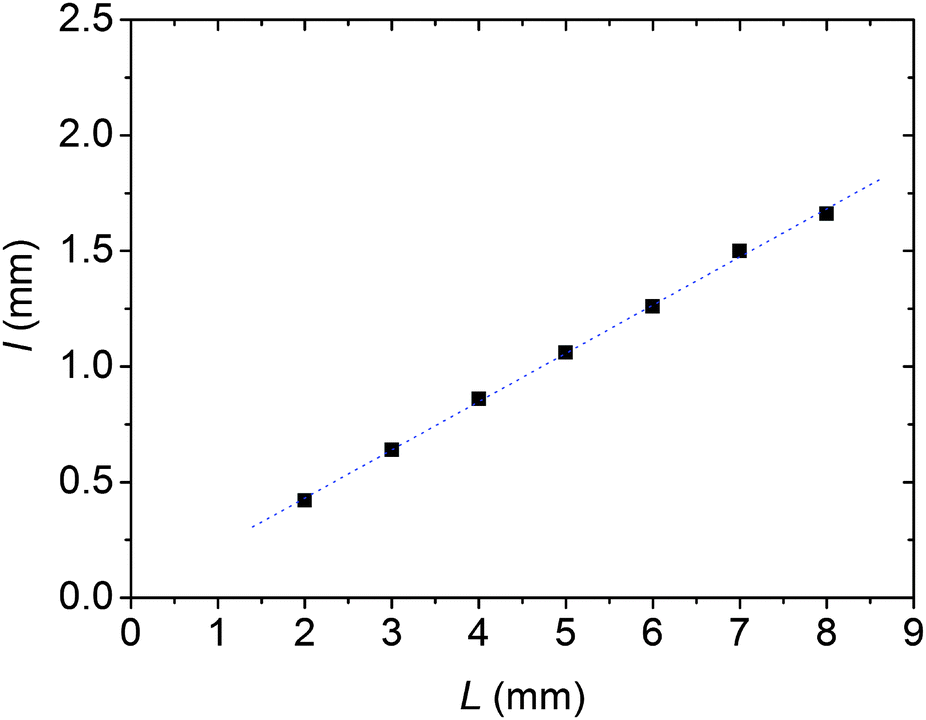
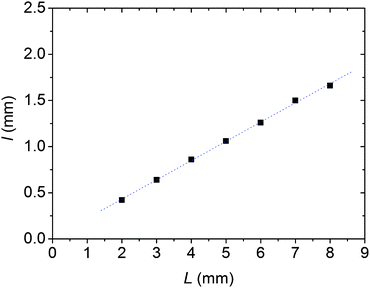
We analyzed the dependence of the thickness of aggregation-free gaps (white regions in Fig. 1, which determine the edges of the Voronoi cells) on the distance between two pieces of crystals/seeds. We obtained the thickness of aggregation-free gaps by analyzing grayscale values of the pixels along a line between two seeds, and the edges of the gaps were identified where the spatial gradients of the grayscale had extremes (Fig. S2 and S3, ESI†). From these data we obtained linear dependence between the thickness of aggregation-free gaps and the distance between two seeds (Fig. 3).
 |
| | Fig. 3 Dependence of the thickness of aggregation-free gaps (l) on the distance between two pieces of crystals/seeds (L) obtained from Fig. 1. The slope of the linear fit is 0.197 with the standard deviation of 0.144. | |
In order to model this phenomenon, we developed a 2D reaction–diffusion model based on the supersaturation theory for aggregation. The model consists of three partial differential equations that describe the diffusion of sodium ions and dispersed (free) NPs and their aggregation process:
| |  | (1) |
| | 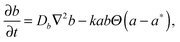 | (2) |
| |  | (3) |
where
a,
b and
c are the concentration of sodium ions, dispersed NPs and aggregated NPs, respectively.
Da and
Db are diffusion coefficients for sodium ions and disaggregated NPs.
Da was set to a typical value for small hydrated ions in water (
Da = 10
−9 m
2 s
−1). The diffusion coefficient of dispersed (free) NPs was obtained from the dynamic light scattering measurement and it was found to be
Db = 5 × 10
−11 m
2 s
−1. The chemical rate constant
k for aggregation was set to
k = 1 M
−1 s
−1.
a* is the threshold concentration of sodium ions where the aggregation process of like-charged NPs starts.
Θ is the Heaviside step function, and it has a form
Θ (
a −
a*) = 0, if
a <
a* (the concentration of sodium ions is lower than a threshold value), and
Θ(
a −
a*) = 1, if
a ≥
a* (the concentration of sodium ions is greater than a threshold value). Partial differential
eqn (1)–(3) were solved on a rectangular mesh using a method of lines technique. We used a finite difference method for space discretization with a grid spacing of 0.1 mm and the forward Euler method for time integration with a time step of 0.1 s. We applied no-flux boundary conditions for all three chemical species. The following initial conditions were applied:
a(
t = 0,
x,
y) = 0,
b(
t = 0,
x,
y) = 2 mM and
c(
t = 0,
x,
y) = 0, however, we kept the concentration of sodium ions in time at
a = 6.14 M (saturated concentration at 22 °C) in regions where sodium chloride crystals were attached to the gel interface. These regions were identified by finding contours of the crystals from experimental images. In the model we suppose that the aggregated NPs cannot diffuse, this arises from the observation that the characteristic size of aggregated NPs is between 100 nm–1 μm, which provides diffusion coefficients (using the Stokes–Einstein equation) in the range of 10
−12 and 10
−13 m
2 s
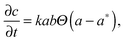
−1. In order to determine the threshold concentration of sodium ions for aggregation (
a*), we consider two main interactions between NPs, namely the attractive vdW and repulsive electrostatic interactions, and we calculated the overall potential of these interactions as a function of concentration of sodium ions (for details see the ESI
†). Value of
a* was taken when the maximum of overall potential was positive and it is in the order of a few
kBT (
kB is the Boltzmann constant and
T is the thermodynamic temperature).
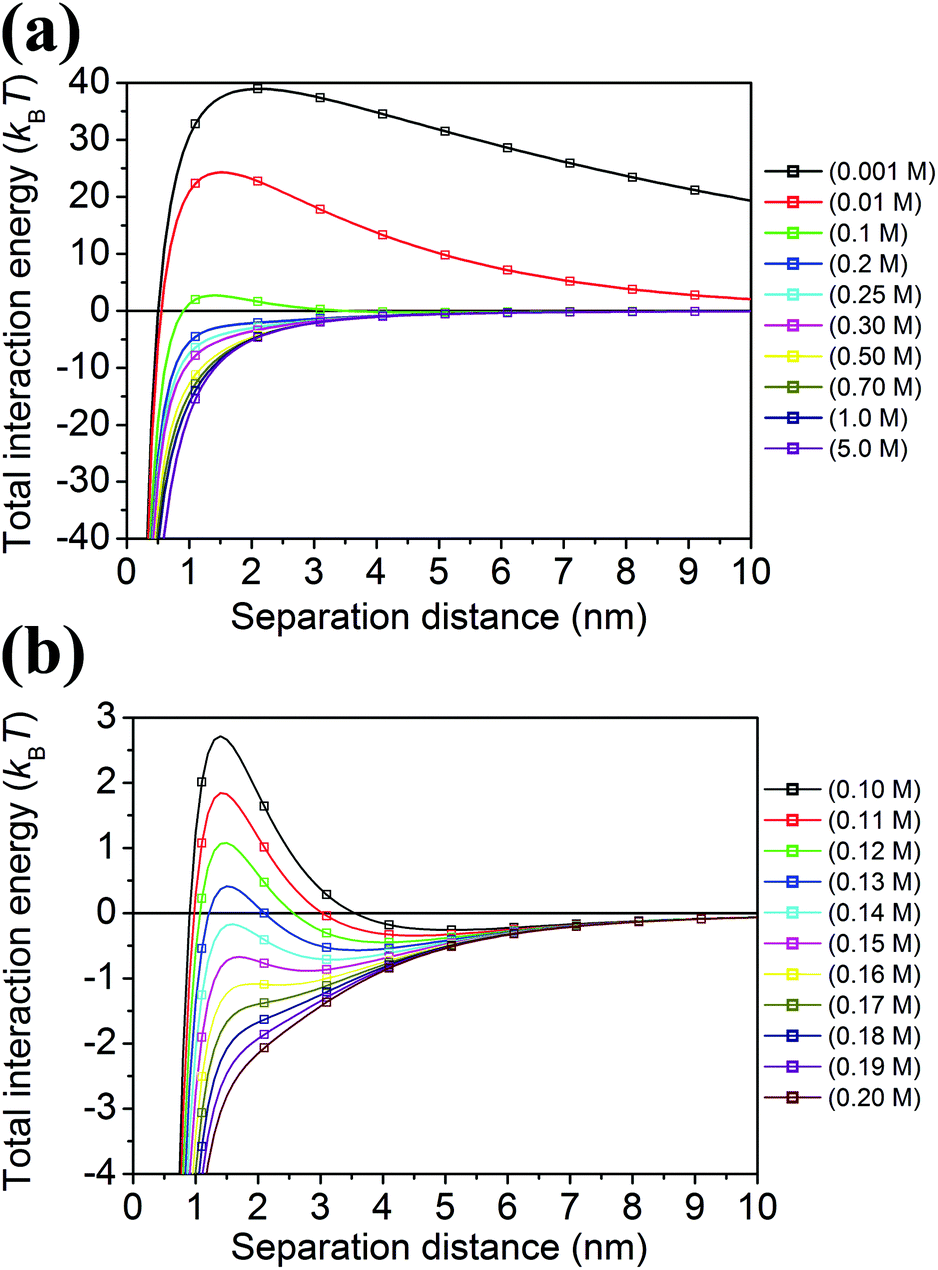
Fig. 4 shows the total interaction energy curves which were calculated for different concentrations of the electrolyte (NaCl) in the range of 0.001 M–5 M. We chose a value of 0.11 M for the threshold concentration of sodium ions for aggregation (a*) in our numerical simulations. This value determined from a theoretical model is in a good agreement with the value obtained from a titration of AuMUA NPs with sodium chloride, which is ∼0.08 M.37 This titration experiment also shows that the aggregation of like-charged NPs induced by a monovalent salt is a critical phenomenon with a well-defined threshold concentration. In the model the aggregation is represented by a step function reflecting the above mentioned behavior.
 |
| | Fig. 4 Total interaction potential for nanoparticle-nanoparticle interactions for different concentrations of sodium chloride from 0.001 M to 5.0 M (a) and between 0.10 M and 0.20 M (b) taking into account attractive van der Waals and repulsive electrostatic interactions. | |
Fig. 5 and 6 present a comparison of Voronoi patterns generated in experiments and obtained from numerical model simulations. It can be seen that the reaction–diffusion–aggregation model captures all findings observed in experiments, namely the formation of Voronoi cells and the thickness of aggregation-free gaps increases with the distance between two pieces of crystals. The model also provides linear dependence between the thickness of the gaps and the distance between two corresponding seeds (Fig. 7). There is an excellent agreement between the experimental results and the results obtained from the numerical simulations (including the stationary patterns and the slopes of the linear fits in Fig. 3 and 7, where the relative error between the slopes is 6%). In the model all parameters were determined from either experiments (diffusion coefficients) or theoretical assumptions (potential calculation of the threshold concentration for aggregation) except one, namely the chemical rate constant for aggregation, which was chosen arbitrary and has a value of unity. This good agreement between experiments and numerical model simulations shows that the formation of Voronoi diagrams from charged NPs is driven by the diffusion of ions and NPs and ion induced aggregation. This phenomenon can be described as a reaction–diffusion process, and these two components play crucial roles in pattern formation.
 |
| | Fig. 5 Voronoi diagrams formed in an experiment after 30 min (a) and in a numerical simulation (b) using bigger (∼4 mm) sodium chloride crystals placed randomly on top of the solid hydrogel. Black regions in (b) correspond to the positions and shape of the crystals. | |
 |
| | Fig. 6 Voronoi diagrams formed in an experiment after 30 min (a) and in a numerical simulation (b) using smaller (∼0.2 mm) sodium chloride crystals placed randomly on top of the solid hydrogel. Black dots in (b) correspond to the positions of the crystals. | |
 |
| | Fig. 7 Dependence of the thickness of aggregation-free gaps (l) on the distance between two pieces of crystals/seeds (L) obtained from the numerical simulations. The slope of the linear fit is 0.209 with a standard deviation of 0.017. | |
The evolution of Voronoi diagrams is driven by the diffusion front of sodium ions and the aggregation of initially homogeneously distributed dispersed NPs. Pattern formation evolves to the point when all dispersed NPs are aggregated, from this point no further aggregation occurs and the pattern becomes stationary, because aggregated NPs cannot diffuse (Fig. S4 and S5, ESI†).
We performed a simple model sensitivity analysis to investigate the effect of the threshold concentration on the pattern structure. We found that changing a* from 0.03 M to 0.15 M has a negligible effect (less than 2%) on the calculated pattern (Fig. S6, ESI†). These two values were chosen from the literature providing the lowest and the highest threshold concentrations for the aggregation of AuMUA induced by salts,37 and this analysis supports the experimental observation that we found qualitatively similar Voronoi diagrams using different monovalent salts (such as LiCl, KCl).
Conclusions
In summary, we have showed a simple concept to generate Voronoi diagrams using diffusion and aggregation processes of like-charged NPs as building blocks by controlling the interactions between NPs in a hydrogel (agarose). The aggregation process of NPs was triggered by the electrostatic screening of negatively charged carboxyl protecting groups by sodium ions. The coupling diffusion of NPs and sodium ions and the aggregation of NPs generate Voronoi diagrams, where the Voronoi cells consist of aggregated NPs and their edges are aggregation-free and NP-free zones due to diffusion and fast aggregation processes. Our research provides an idea how to control spatiotemporally the self-assembly of nanoscopic building blocks by a diffusion front. Control of nanoscale systems by propagating reaction fronts could open up new avenues for research on nanostructured materials.22,38
Acknowledgements
Authors acknowledge the financial support of the Hungarian Scientific Research Fund (OTKA K104666 and OTKA PD105173) and the National Research, Development and Innovation Office of Hungary (TÉT_12_JP-1-2014-0005). H. N. and I. L. acknowledge support from the Project for Enhancing Research and Education in Polymer and Fiber Science at KIT. H. N. acknowledges funding support from JSPS KAKENHI Grant Numbers JP15H05410 and JP16K13627. D. U. acknowledges the financial support from JSPS KAKENHI Grant Number JP26400213. A. D. acknowledges the support of the János Bolyai Research Fellowship from the Hungarian Academy of Sciences.
Notes and references
- J. H. Fendler, Chem. Mater., 1996, 8, 1616–1624 CrossRef CAS.
- S. Eustis and M. A. El-Sayed, Chem. Soc. Rev., 2006, 35, 209 RSC.
- M. Goldberg, R. Langer and X. Jia, J. Biomater. Sci., Polym. Ed., 2007, 18, 241–268 CrossRef CAS PubMed.
- M. Grzelczak, J. Vermant, E. M. Furst and L. M. Liz-Marzán, ACS Nano, 2010, 4, 3591–3605 CrossRef CAS PubMed.
- A. Biswas, I. S. Bayer, A. S. Biris, T. Wang, E. Dervishi and F. Faupel, Adv. Colloid Interface Sci., 2012, 170, 2–27 CrossRef CAS PubMed.
- A. Sánchez-Iglesias, M. Grzelczak, T. Altantzis, B. Goris, J. Pérez-Juste, S. Bals, G. Van Tendeloo, S. H. Donaldson, B. F. Chmelka, J. N. Israelachvili and L. M. Liz-Marzán, ACS Nano, 2012, 6, 11059–11065 CrossRef PubMed.
- D. Zámbó, G. Z. Radnóczi and A. Deák, Langmuir, 2015, 31, 2662–2668 CrossRef PubMed.
- D. Zámbó, S. Pothorszky, D. F. Brougham and A. Deák, RSC Adv., 2016, 6, 27151–27157 RSC.
- C. A. Mirkin, R. L. Letsinger, R. C. Mucic and J. J. Storhoff, Nature, 1996, 382, 607–609 CrossRef CAS PubMed.
- A. M. Kalsin, M. Fialkowski, M. Paszewski, S. K. Smoukov, K. J. M. Bishop and B. A. Grzybowski, Science, 2006, 312, 420–424 CrossRef CAS PubMed.
- E. V. Shevchenko, D. V. Talapin, N. A. Kotov, S. O’Brien and C. B. Murray, Nature, 2006, 439, 55–59 CrossRef CAS PubMed.
- R. J. Macfarlane, B. Lee, M. R. Jones, N. Harris, G. C. Schatz and C. A. Mirkin, Science, 2011, 334, 204–208 CrossRef CAS PubMed.
- Q. Zhou, B. Wang, P. Wang, C. Dellago, Y. Wang and Y. Fang, CrystEngComm, 2013, 15, 5114 RSC.
- L. Xu, W. Ma, L. Wang, C. Xu, H. Kuang and N. A. Kotov, Chem. Soc. Rev., 2013, 42, 3114 RSC.
- G. Singh, H. Chan, A. Baskin, E. Gelman, N. Repnin, P. Kral and R. Klajn, Science, 2014, 345, 1149–1153 CrossRef CAS PubMed.
- Y. Zhang, S. Pal, B. Srinivasan, T. Vo, S. Kumar and O. Gang, Nat. Mater., 2015, 14, 840–847 CrossRef CAS PubMed.
- P. P. Pillai, B. Kowalczyk and B. A. Grzybowski, Nanoscale, 2016, 8, 157–161 RSC.
- Y. Zhou, R. L. Marson, G. van Anders, J. Zhu, G. Ma, P. Ercius, K. Sun, B. Yeom, S. C. Glotzer and N. A. Kotov, ACS Nano, 2016, 10, 3248–3256 CrossRef CAS PubMed.
- J. Fontana, J. Naciri, R. Rendell and B. R. Ratna, Adv. Opt. Mater., 2013, 1, 100–106 CrossRef.
- C. Hamon, S. Novikov, L. Scarabelli, L. Basabe-Desmonts and L. M. Liz-Marzán, ACS Nano, 2014, 8, 10694–10703 CrossRef CAS PubMed.
- P. Li, Y. Li, Z.-K. Zhou, S. Tang, X.-F. Yu, S. Xiao, Z. Wu, Q. Xiao, Y. Zhao, H. Wang and P. K. Chu, Adv. Mater., 2016, 28, 2511–2517 CrossRef CAS PubMed.
- I. Lagzi, B. Kowalczyk and B. A. Grzybowski, J. Am. Chem. Soc., 2010, 132, 58–60 CrossRef CAS PubMed.
- S. Thomas, I. Lagzi, F. Molnár Jr. and Z. Rácz, Phys. Rev. Lett., 2013, 110, 078303 CrossRef PubMed.
- I. R. Epstein and K. Showalter, J. Phys. Chem., 1996, 100, 13132–13147 CrossRef CAS.
- J. Horvath, I. Szalai and P. De Kepper, Science, 2009, 324, 772–775 CrossRef CAS PubMed.
- D. Sanchez-Gutierrez, M. Tozluoglu, J. D. Barry, A. Pascual, Y. Mao and L. M. Escudero, EMBO J., 2016, 35, 77–88 CrossRef CAS PubMed.
- J. A. Byers, J. Anim. Ecol., 1992, 61, 759 CrossRef.
- R. Graham and F. Yao, Am. Math. Monthly, 1990, 97, 687 CrossRef.
-
Handbook of grid generation, ed. J. F. Thompson, B. K. Soni and N. P. Weatherill, CRC Press, Boca Raton, Fla, 1999 Search PubMed.
- I. T. Bensemann, M. Fialkowski and B. A. Grzybowski, J. Phys. Chem. B, 2005, 109, 2774–2778 CrossRef CAS PubMed.
- B. P. J. de Lacy Costello, P. Hantz and N. M. Ratcliffe, J. Chem. Phys., 2004, 120, 2413 CrossRef CAS PubMed.
- B. P. J. De Lacy Costello, I. Jahan, P. Hambidge, K. Locking, D. Patel and A. Adamatzky, Int. J. Bifurcation Chaos Appl. Sci. Eng., 2010, 20, 2241–2252 CrossRef.
- B. P. J. De Lacy Costello, I. Jahan, A. Adamatzky and N. M. Ratcliffe, Int. J. Bifurcation Chaos Appl. Sci. Eng., 2009, 19, 619–622 CrossRef.
- B. De Lacy Costello, Parallel Process. Lett., 2015, 25, 1540003 CrossRef.
- A. Adamatzky, B. De Lacy Costello, J. Holley, J. Gorecki and L. Bull, Chaos, Solitons Fractals, 2011, 44, 480–489 CrossRef CAS.
- D. Wang, R. J. Nap, I. Lagzi, B. Kowalczyk, S. Han, B. A. Grzybowski and I. Szleifer, J. Am. Chem. Soc., 2011, 133, 2192–2197 CrossRef CAS PubMed.
- D. Wang, B. Tejerina, I. Lagzi, B. Kowalczyk and B. A. Grzybowski, ACS Nano, 2011, 5, 530–536 CrossRef CAS PubMed.
- B. Bohner, G. Schuszter, H. Nakanishi, D. Zámbó, A. Deák, D. Horváth, Á. Tóth and I. Lagzi, Langmuir, 2015, 31, 12019–12024 CrossRef CAS PubMed.
Footnote |
| † Electronic supplementary information (ESI) available: Comparison of a chemically generated Voronoi diagram based on nanoparticle aggregation and a geometrically generated Voronoi diagram (Fig. S1). Details of the image analysis (Fig. S2 and S3). Evolution of Voronoi diagrams in experiments and numerical simulations (Fig. S4 and S5). Calculated Voronoi patterns with different threshold concentrations for aggregation (Fig. S6). Calculation of nanoparticle interaction potentials. See DOI: 10.1039/c6cp04297j |
|
| This journal is © the Owner Societies 2016 |
Click here to see how this site uses Cookies. View our privacy policy here. 
 Open Access Article
 This Open Access Article is licensed under a Creative Commons Attribution-Non Commercial 3.0 Unported Licence