
 Open Access Article
 This Open Access Article is licensed under a
 Creative Commons Attribution 3.0 Unported Licence
Dynamic behaviour of the silica-water-bio electrical double layer in the presence of a divalent electrolyte†
B. M.
Lowe
 a,
Y.
Maekawa‡
b,
Y.
Shibuta‡
b,
T.
Sakata‡
b,
C.-K.
Skylaris‡
c and
N. G.
Green‡
*d
a,
Y.
Maekawa‡
b,
Y.
Shibuta‡
b,
T.
Sakata‡
b,
C.-K.
Skylaris‡
c and
N. G.
Green‡
*d
aInstitute for Complex Systems Simulation and the Electronics and Computer Science Department, University of Southampton, UK. E-mail: ben.lowe.uk@googlemail.com
bDepartment of Materials Engineering School of Engineering, The University of Tokyo, 7-3-1 Hongo, Bunkyo, Tokyo 113-8656, Japan. E-mail: sakata@biofet.t.u-tokyo.ac.jp
cSchool of Chemistry, University of Southampton, UK
dDepartment of Electronics and Computer Science, Nano Research Group, University of Southampton, UK. E-mail: ng2@ecs.soton.ac.uk
First published on 19th October 2016
Abstract
Electronic devices are becoming increasingly used in chemical- and bio-sensing applications and therefore understanding the silica-electrolyte interface at the atomic scale is becoming increasingly important. For example, field-effect biosensors (BioFETs) operate by measuring perturbations in the electric field produced by the electrical double layer due to biomolecules binding on the surface. In this paper, explicit-solvent atomistic calculations of this electric field are presented and the structure and dynamics of the interface are investigated in different ionic strengths using molecular dynamics simulations. Novel results from simulation of the addition of DNA molecules and divalent ions are also presented, the latter of particular importance in both physiological solutions and biosensing experiments. The simulations demonstrated evidence of charge inversion, which is known to occur experimentally for divalent electrolyte systems. A strong interaction between ions and DNA phosphate groups was demonstrated in mixed electrolyte solutions, which are relevant to experimental observations of device sensitivity in the literature. The bound DNA resulted in local changes to the electric field at the surface; however, the spatial- and temporal-mean electric field showed no significant change. This result is explained by strong screening resulting from a combination of strongly polarised water and a compact layer of counterions around the DNA and silica surface. This work suggests that the saturation of the Stern layer is an important factor in determining BioFET response to increased salt concentration and provides novel insight into the interplay between ions and the EDL.
1 Introduction
Silica and water form some of the most abundant chemical systems and understanding the interface between the two is important for a large range of applications such as biosensing,1–3 drug-delivery,4 prebiotic chemistry,5 improved fundamental understanding of geochemical processes (e.g. dissolution reactions6) and chemical engineering (e.g. water-desalination7). The precise structure and dynamics of this interfacial region, including the Electrical Double Layer (EDL) remains elusive, despite over a century of extensive study.8–12Addition of charged macromolecules to oxide surfaces results in a perturbation of the EDL which cannot be accurately described by conventional mean-field models. In this work, electrolyte and biomolecule dynamics were studied with atomistic resolution, providing a detailed description of the electric field generated at the interface. DNA was chosen as an example of a highly-charged macromolecular polyelectrolyte which is both well-characterised and has relevance to a range of biotechnology applications. In addition, divalent ions were included, which are known to have a strong influence on the structure of the EDL, important to silica dissolution processes13 and prominent in physiological solutions14 but despite this, have received surprisingly little attention in the atomistic simulation literature.
One application of this work is in improving understanding of the mechanism-of-action of a promising class of biosensors, termed biologically-sensitive field-effect transistors (BioFETs). These sensors operate by detecting changes in the electric field within the EDL as a result of biomolecule binding, as shown schematically in Fig. 1. Reliable and quantitative prediction of changes in the electric field due to biomolecule adsorption, and hence BioFET response, is currently difficult primarily due to the complexity of the EDL.
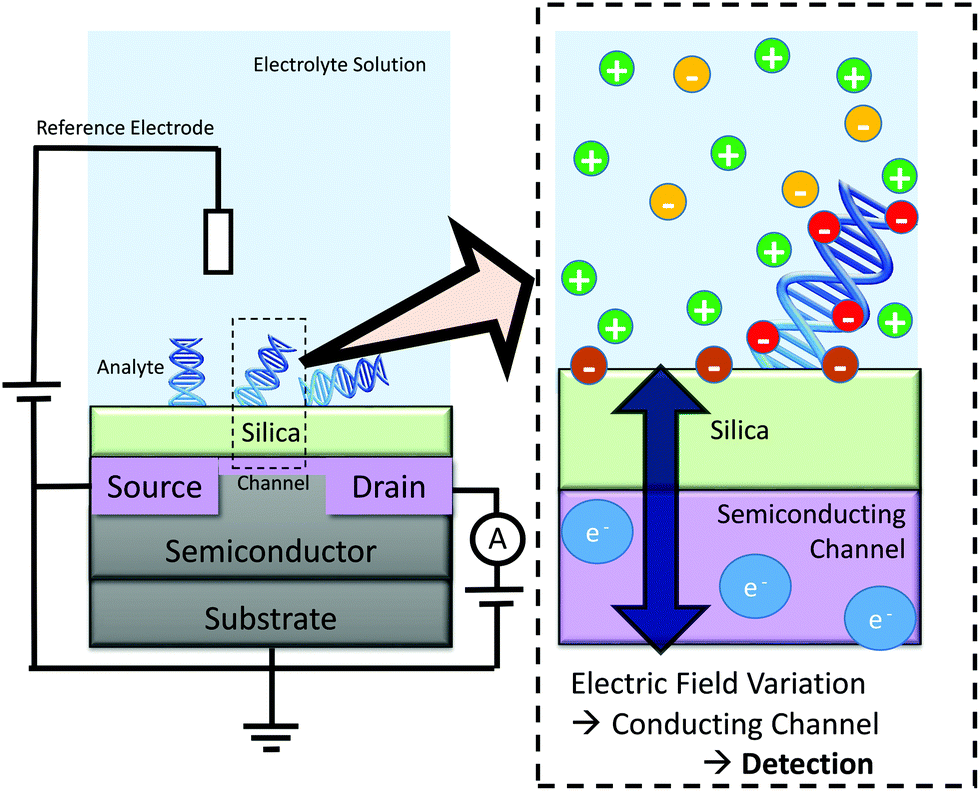 | ||
| Fig. 1 Schematic of BioFET operation. Biomolecules can alter the electric field at the interface, resulting in a measurable change in conductance of the channel. Many factors: surface charge; biomolecule charge; biomolecule orientation; surface dipole; ionic strength; and pH, can affect the interfacial electric field. | ||
Not only has the presence of divalent ions recently been shown to increase BioFET sensitivity,15–17 but the electric field and ion-dynamics at the interface are thought to be crucial in determining field effect biosensor response.
1.1 Importance of EDL structure and ion dynamics in the interfacial region
The most commonly discussed hypothesis for BioFET response is via detecting changes in the electric field due to changes in the “surface” concentration of ionised groups forming the EDL or charges around biomolecules.§18 The interfacial region is thought to be significantly affected by biomolecules; for example the orientation of biomolecules is thought to be important in determining sensor response.3,21 The EDL structure in turn can be affected by dense biomolecule layers through ion-exclusion; mathematical models incorporating ion-exclusion effects have been shown to describe experimental signal measurements of DNA hybridisation better than more conventional EDL models.15Recent experimental work recognises the importance of ion dynamics in BioFET engineering, with deterministic information extracted from BioFET signals in the frequency domain of the response15,22,23 which has been explained as a result of adsorption–desorption noise of biomolecules24 and perturbed charge fluctuations in the EDL.25 Experiments have shown a decrease in low frequency noise with increased ionic strength due to increased screening competition between the EDL and the semiconductor device.26 Heitzinger et al. suggested a different trend for DNA-sensing, in which they calculated an increase in the standard deviation of the FET channel current with ionic concentration due to an increasingly variable orientation of the DNA.21 These studies show that addition of a biomolecule, such as DNA, can affect EDL dynamics to the extent that a response can be observed in the frequency domain that is not apparent in the time-domain, even under high ionic strength conditions.
Experiments are not able to unambiguously decouple the signal noise originating from the semiconductor device and the EDL region in the electrolyte solution. Most current EDL theories used in the BioFET engineering field are based on equilibrium, mean-field solutions of the Poisson–Boltzmann equation. These models offer the advantage of low computational cost and can be accurate for low ionic strength and low surface-charge systems. However, for BioFET systems, this is rarely the case and finite-size steric effects render the Poisson–Boltzmann equation inaccurate without modification. Modern advances in computational power have enabled the exploration of more detailed atomistic models of the structure and dynamics of the silica-water(-bio) interface27via both classical28–36 and ab initio Molecular Dynamics (MD).37–41
This work presents MD simulations of EDL structure and ion dynamics in the interfacial region to investigate how (a) increased ionic strength and (b) addition of DNA perturbs the electric field and charge density at the silica-water interface.
1.2 Divalent ions
Physiological samples often contain divalent cations such as Mg2+ and Ca2+ which serve important biological functions. For example, diffusely associated divalent cations are thought to have a significant effect on reducing the internal stress in DNA/RNA due to screening of the negative charges on the phosphate backbone, as evidenced by experiment14,42 and simulation.43,44Divalent ions are also known to be important in the phenomenon of charge inversion, in which the first diffuse layer in the EDL contains more counterions than needed to compensate for surface charge, which is then balanced by a second co-ion layer. This phenomenon has been attributed to two (non mutually-exclusive) mechanisms. One mechanism is via ‘specific adsorption’ of ions, caused by forces such as chemical bonding or water-mediated interactions.45 The other mechanism is via many-body ion–ion correlations, in which the chemical potential near the surface is reduced due to spatial correlations between discrete ions, with the electrostatic interactions outweighing the entropic cost of forming such a highly correlated system.45,46 Atomic Force Microscopy (AFM) has measured the effects of charge inversion at the silica-water interface using trivalent and quadrivalent ions at low concentrations (≤1 μM).47 These experiments did not demonstrate charge inversion for Mg2+; however, it would be expected that divalent ions would require a higher concentration than trivalent ions. Edel and de Mello have measured the streaming current for silica nanochannels and Mg2+ counterions, observing charge inversion for concentrations exceeding approximately 400 mM.48
From the perspective of BioFET biosensing, the importance of adding divalent and multivalent salts has also been shown. Jayant et al. have recently shown a significant enhancement in DNA-hybridisation sensitivity upon addition of trace amounts of multivalent salt (Mg2+ or Co3+) to a low-concentration NaCl background buffer.15,49,50 In their work, a background of 1 mM NaCl was used for hybridisation of ssDNA, and it was found that addition of the complementary strand in 1 mM NaCl with 100 μM Mg2+ produced a 350 ± 150% increase in potential shift relative to the control. They found that this effect was only significant when the initial concentration of monovalent salt was low, which supports an ion-competition mechanism. Modeling the DNA as a membrane, they putatively assigned the signal to a combination of (a) increased ion-exclusion of multivalent ions and (b) increased DNA-condensation in the presence of multivalent ions.15
Other authors support the notion that multivalent salts can have a significant effect on BioFET signal, for example, Rica et al. have observed an increase in DNA hybridisation on addition of multivalent salt (spermidine) and observed a corresponding FET signal indicative of charge inversion at 10 μM spermidine. The signal changed polarity at higher concentrations of spermidine, which they attribute to increased screening of the charge inverted DNA molecule.16 Shul'ga et al. have reported an almost 100% increase in glucose-sensitive enzyme-FET signal on addition of 0.1 M MgCl2 which they attribute to divalent cations affecting the rate of charge transfer of the enzyme substrate oxidation.17
Despite the importance of divalent ions, a monovalent electrolyte is typically assumed in MD simulations of hydrated surface-biomolecule systems or mathematical modelling of BioFET signals. Sakata et al.28–31 have recently used MD simulations to investigate the EDL structure and dynamics for hydrated silica-water28,29 and hydrated silica-DNA systems.31 This paper extends this work to investigate the effect of divalent Mg2+ ions upon the structure and dynamics of the EDL at this technologically important interface.
2 Computational methods
Fig. 2(a) shows a schematic diagram of the simulation domain used in this work. The solid base was modelled as the (100) surface of alpha-quartz (SiO2) with dimensions of 49.130 Å × 54.050 Å, and a depth of 16.5 Å. At open-circuit potential and biosensing conditions (usually 5 ≲ pH ≲ 9), silica-water interfaces are negatively charged and therefore the upper surface was defined with a ratio of one fifth SiO−/SiOH (0.2 C m−2), as discussed further in the ESI 1.† The surface charge was then neutralised with Na+ to produce an electroneutral unit-cell and a solvent box was put into contact with this surface, similar to the method of Zhang et al.36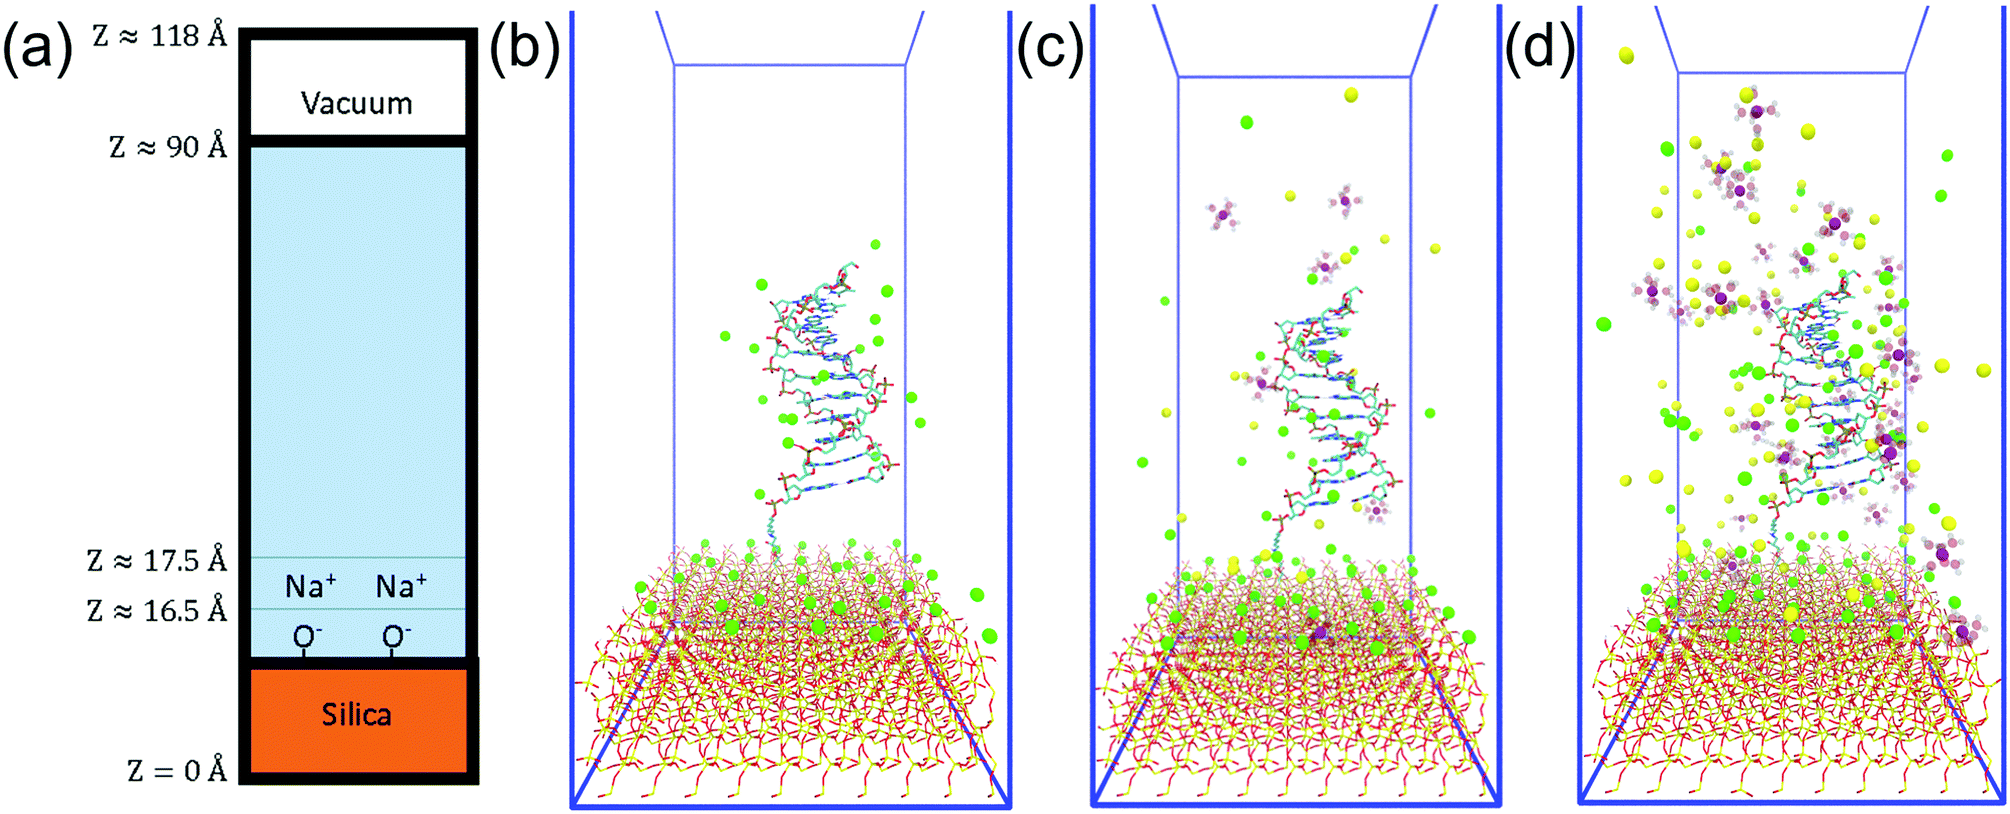 | ||
| Fig. 2 System summary. (a) Side-on schematic of the simulation cell. (b–d) Initial configuration of the 0 mM, 200 mM and 1 M ionic strength systems with DNA. Mg2+ = purple, Na+ = green, Cl− = yellow, O = red, Si = gold. Mg-coordinated water drawn as transparent. DNA drawn as stick representation. Videos of each trajectory can be found in the ESI.† | ||
Solvent boxes were prepared with an initial density of 1 g cm−3 and a vertical height of approximately 73 Å. Three different solvent boxes were considered: 0 M electrolyte (salt free, corresponding to deionised water); approximately 0.2 M ionic strength electrolyte; and approximately 1 M ionic strength electrolyte, each containing a 1![[thin space (1/6-em)]](https://www.rsc.org/images/entities/char_2009.gif) :1 molar ratio of NaCl to MgCl2. The system was geometry optimised for 5000 steps and then NVT dynamics51 were performed at 300 K for 3 ns. Dynamics were performed with the Nosé–Hoover thermostat using a Q ratio of 0.01.51
:1 molar ratio of NaCl to MgCl2. The system was geometry optimised for 5000 steps and then NVT dynamics51 were performed at 300 K for 3 ns. Dynamics were performed with the Nosé–Hoover thermostat using a Q ratio of 0.01.51
For comparison, three further systems were prepared at each ionic strength, incorporating DNA neutralised with Na+. DNA was constructed and chemically bonded to the surface following the method of Maekawa et al.31 and consisted of a d(AAAAAAAAAA) decamer with a complementary base-T strand and a net charge of −19e. The DNA was superimposed onto the solvent box, the DNA was kept fixed and a 5000 step geometry optimisation was performed for the three cases. Then, water molecules within the DNA were removed and electrolyte ions from inside to outside of the DNA. A further 5000 step geometry optimisation and 100 ps of NVT dynamics were performed in order to further relax the system. Similarly to Luan et al.,52 ionic strengths were calculated using the number of electrolyte ions counted beyond those required to neutralise the silica and DNA. The volume of the liquid system (without DNA and after geometry optimisation) was used for this calculation with the result that stated ionic strengths (0.2 M/1 M) are only estimates. Systems referred to as 0 M contain no added electrolyte in the solvent box, but are electroneutral due to Na+ associated with the surface layer and DNA. A summary of each the composition of each model is given in Table 1 and images of the initial configurations of the DNA systems at varying ionic strength are shown in Fig. 2.
| Element | 0 mM | 200 mM | 1000 mM | 0 mM & DNA | 200 mM & DNA | 1000 mM & DNA |
|---|---|---|---|---|---|---|
| O | 8902 | 8850 | 8654 | 8724 | 8653 | 8494 |
| H | 13171 |
13067 |
12675 |
12830 |
12688 |
12370 |
| Si | 1200 | 1200 | 1200 | 1200 | 1200 | 8494 |
| Cl | 0 | 18 | 87 | 0 | 6 | 87 |
| Mg | 0 | 6 | 29 | 0 | 6 | 29 |
| Na | 0 (33) | 6 (33) | 29 (33) | 0 (33)[19] | 6 (33)[19] | 29 (33)[19] |
In the simulations, the COMPASS II 1.2 forcefield was used. This forcefield has been parameterised predominately using ab initio data for a wide range of condensed systems; both organic and inorganic systems and on a range of ionic liquids.53,54 In this forcefield, the charges are the same as in the COMPASS I forcefield (see for reference the previous work by Maekawa et al.28,30,31), with the exception of the phosphate group on DNA molecules. For this functional group, the COMPASS II defaults were used; −0.3 for the sugar-linking oxygens, −0.822 for the non-linking oxygens (![[double bond, length as m-dash]](https://www.rsc.org/images/entities/char_e001.gif) O and –O−) and +0.9246 for phosphorus atoms resulting in a total charge of −1 for each [RCH2PO4C(H)R]− substructure. Ewald summation was used for the electrostatic interactions with a 4.184 J mol threshold and an atom-based summation with a 12.5 Å cutoff for the van der Waals interactions. Unless otherwise specified, all analysis was performed over the mean of the last 1 ns with 1 ps windows.
O and –O−) and +0.9246 for phosphorus atoms resulting in a total charge of −1 for each [RCH2PO4C(H)R]− substructure. Ewald summation was used for the electrostatic interactions with a 4.184 J mol threshold and an atom-based summation with a 12.5 Å cutoff for the van der Waals interactions. Unless otherwise specified, all analysis was performed over the mean of the last 1 ns with 1 ps windows.
The diffusion coefficient, D, was calculated using the Einstein relation (1), from the Mean Squared Displacement (MSD) as a function of time, t:
 | (1) |
The residence times of molecules coordinated with ions was calculated as per the definition of Impey et al.,55 based on the rate of decay of the time-correlation function with the parameter t* = 0.
The electric field was calculated in this work from the electrostatic forces on a test charge evaluated using two methods: coulomb summation and Ewald summation. In the Ewald sum, the calculation is periodic in x, y and z, whereas in the coulomb summation method, a finite supercell is used. Details of these methodologies can be found in the ESI 2,† each of which have advantages and disadvantages. Briefly, the coulombic sum method has error from truncation of the full periodicity of the system to a finite sum, and the Ewald sum has error from the contribution of periodic interactions in the z-direction and from the introduction of a non-uniform compensating background charge for orthorhombic unit-cells.56
3 Forcefield verification
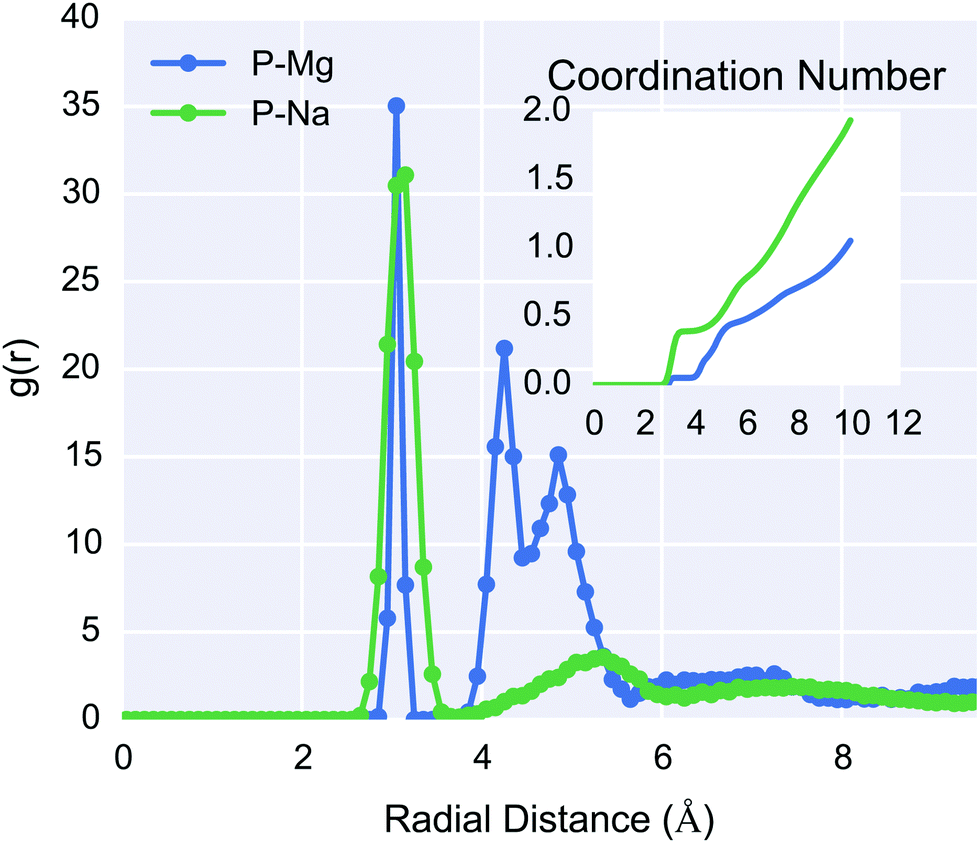
An accurate description of ion dynamics and structure is fundamental to simulations of charge dynamics in the EDL. The COMPASS II forcefield53 was utilised in this study as it has been parameterised using a wide range of experimental data, including both organic compounds and biochemically relevant ions in the condensed phase. One important requirement of the forcefield is that it describes the solvation of ions accurately. In order to validate the forcefield, initial simulations of the interaction between the Mg2+ and Na+ cations, and water were performed.Fig. 3 shows a plot of the coordination number for each ion with respect to pure water (oxygen atoms), as well as snapshots of the equilibrium solvation sphere around the (a) Mg2+ and (b) Na+ cations. The calculated coordination number of Mg2+ was approximately 6, in good agreement with neutron scattering data,57 whereas for Na+ the coordination number was approximately 5 which is in agreement with neutron scattering of 4.9 ± 158 and ab initio MD of 4.6.59 The Mg2+ cation showed a more ordered solvation sphere than Na+, demonstrated by the initial steep rise and flat region of the curve for the first compared to the second. The secondary peak in the curve shows evidence of a structured secondary solvation sphere. The difference in structure between the ions is due to the smaller ionic radii and stronger coulombic attraction of Mg2+ resulting in a much tighter, more ordered solvation sphere.
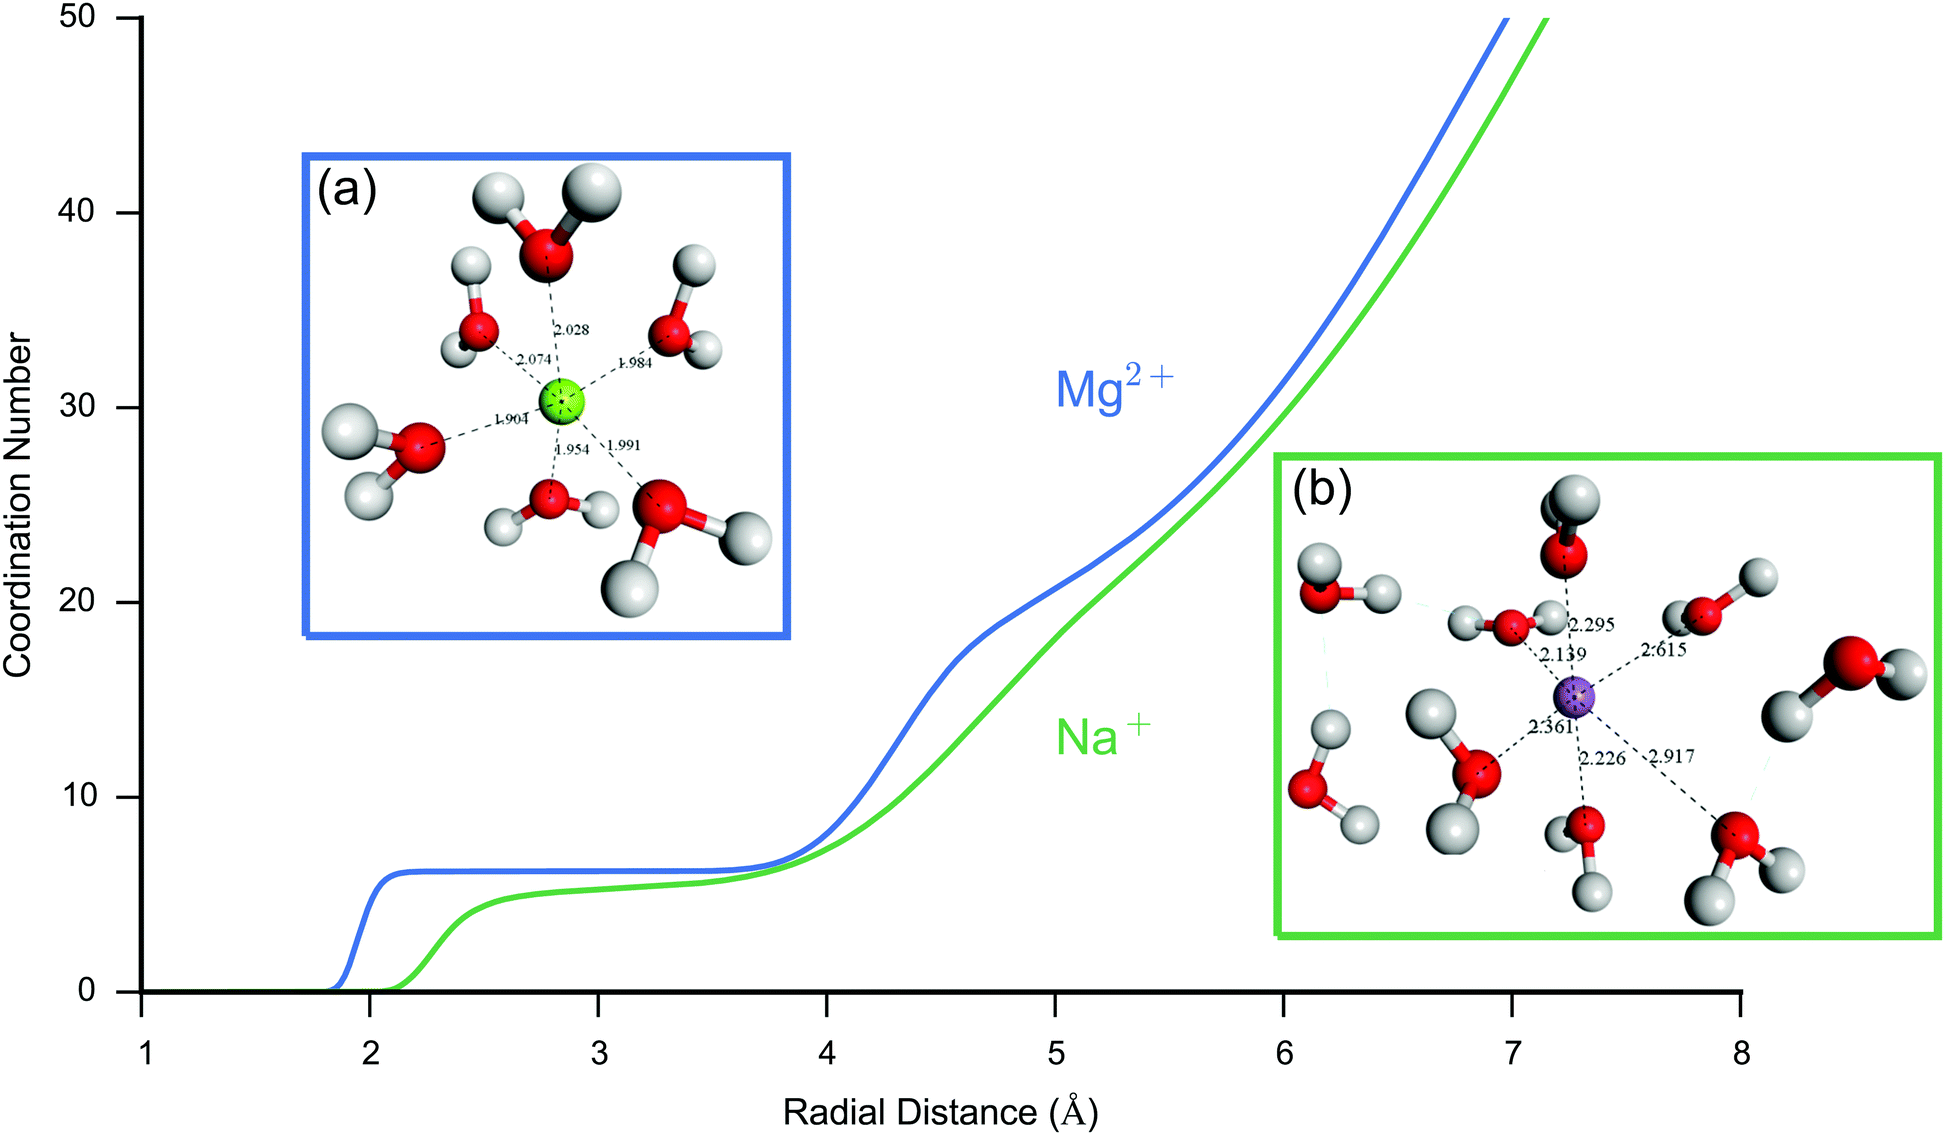 | ||
| Fig. 3 Comparison of the water structure around Mg2+ and Na+ in pure water. Ion–O coordination number (cumulative number of oxygen atoms) for a single Mg2+ (blue) and Na+ (green) in pure water. There is an initially steep rise for Mg2+ followed by an extended flat region, indicating that there is a highly ordered first solvation shell resulting in a radial region where oxygen is absent. Na+ by comparison has a more labile first solvation shell, with less distinct regions occupied by the oxygen atoms. The coordination number for Mg2+ is 6.2 in agreement with the expected octahedral coordination. For Na+ the coordination number is in the range 4.8–5.5, the lower coordination to Na+ is expected due to the less efficient packing around the molecule. The curves also show evidence of a second ordered region for Mg2+ compared to Na+. Shown insets are representative snapshots of the first hydration shell of Mg2+ (a) and Na+ (b) also demonstrating the difference in ordering of the water molecules. Mg2+ shows a tighter binding octahedral structure, as opposed to the more diffuse Na+ ion. Snapshots were taken from the system after 2 ns of NVT MD. All molecules shown with atoms within 3.5 Å of the ion, bond lengths (Å) shown in black. | ||
Another test parameter for the forcefield is the diffusion coefficient; the values for Cl−, Na+, Mg2+ and H2O are presented in Table 2. The calculated diffusion coefficient for water and ions overestimates the experimental value by a factor of approximately 2, which is consistent with other common water forcefields such as TIP3P and is a consequence of the well-known difficulty of accurately capturing water dynamics in empirical forcefields. Agreement within 2- to 3-fold is considered reasonable for diffusion coefficients.60 It is promising that the relative diffusivity of the ions is in good agreement with experiment, suggesting qualitatively correct dynamics.
| System | Simulated D 1 × 10⁻⁵ cm2 s−1 | Literature D 1 × 10⁻⁵ cm2 s−1 |
|---|---|---|
| a Extrapolated to infinite dilution. b Simulated using TIP4P and OPLS forcefield at very low ionic strength. c Simulated using TIP3P forcefield. | ||
| Na+ 0.2 M in water | 4.1 | 1.3 (expt.a)61 |
| Mg2+ 1 M MgCl2 | 1.3 | 0.71 (expt.a)61 0.50 (expt.)62 0.60–0.79b63 |
| Cl− 1 M MgCl2 | 3.6 | 2.0 (expt.a)61 1.4 (expt.)62 2.4–2.6b63 |
| H2O bulk water | 5.930 | 2.3 (expt.)64 5.2–7.0c65 |
Lastly, the calculated radial distribution function of Mg2+/Na+ ions to H/O atoms in bulk water is shown in Fig. 4. The coordination number previously shown in Fig. 3 was calculated as the integral of this RDF, assuming a fixed box-volume based on the last frame of analysis. Excellent agreement is seen between the simulated RDF peak position for Mg2+–O and Mg2+–H versus neutron scattering experiments; however, exact agreement is not expected due to the higher concentration of the experimental data.
 | ||
| Fig. 4 Simulated (red/blue) Mg2+–O (left) and Mg2+–H (right) Radial Distribution Function (RDF) in bulk water, compared to experimental (green) data for Mg2+. For the simulations, 268 water molecules and 1 ion (Mg2+/Na+ respectively) were prepared in an approximately 20 Å box, NPT molecular dynamics were performed with 2 ns equilibration and a 8 ns production period over which the RDF was calculated. The neutron scattering data was obtained from Bruni et al.57 and is measured at 1:83 MgCl2:H2O concentration. Excellent agreement is seen between the simulated RDF peak position for Mg2+ RDFs versus experiment; however, exact agreement is not expected due to the higher concentration of the experimental data. Na+ shows a smaller first peak due to its lower water coordination number and shows a more diffuse RDF for its second peak due to its weaker interaction with water. Na+ is also in good agreement with experiments; neutron diffraction data for Na+ puts the first RDF peak at 2.35 Å for oxygen and the first peak at 2.91 Å for H.58 These results suggest the COMPASS II forcefield is accurately describing the equilibrium ion–water structural properties. | ||
4 Results and discussion
The main aim of the work presented in this paper was to investigate the interfacial EDL structure in a range of ionic strengths, with and without the presence of DNA as an example biomolecule. Simulations were performed using 0 mM, 200 mM & 1000 mM ionic strength 1:1 MgCl2 to NaCl electrolyte, with and without DNA. Videos of each of these molecular dynamics simulations can be found in the ESI.† The simulation results were analysed in sections to examine: ion dynamics in the interfacial region and comparison with accepted double layer models; variation of EDL structure with ionic strength; and the effect of the inclusion of the DNA molecule.
4.1 Ion dynamics at the silica-water interface
Understanding ion dynamics at the silica-water interface is vital not only for improved biosensor design but also in other fields such as geochemistry, where Na+ and Mg2+ may be important in dissolution reactions,6 and chemical engineering for the improved design of water-desalination processes.7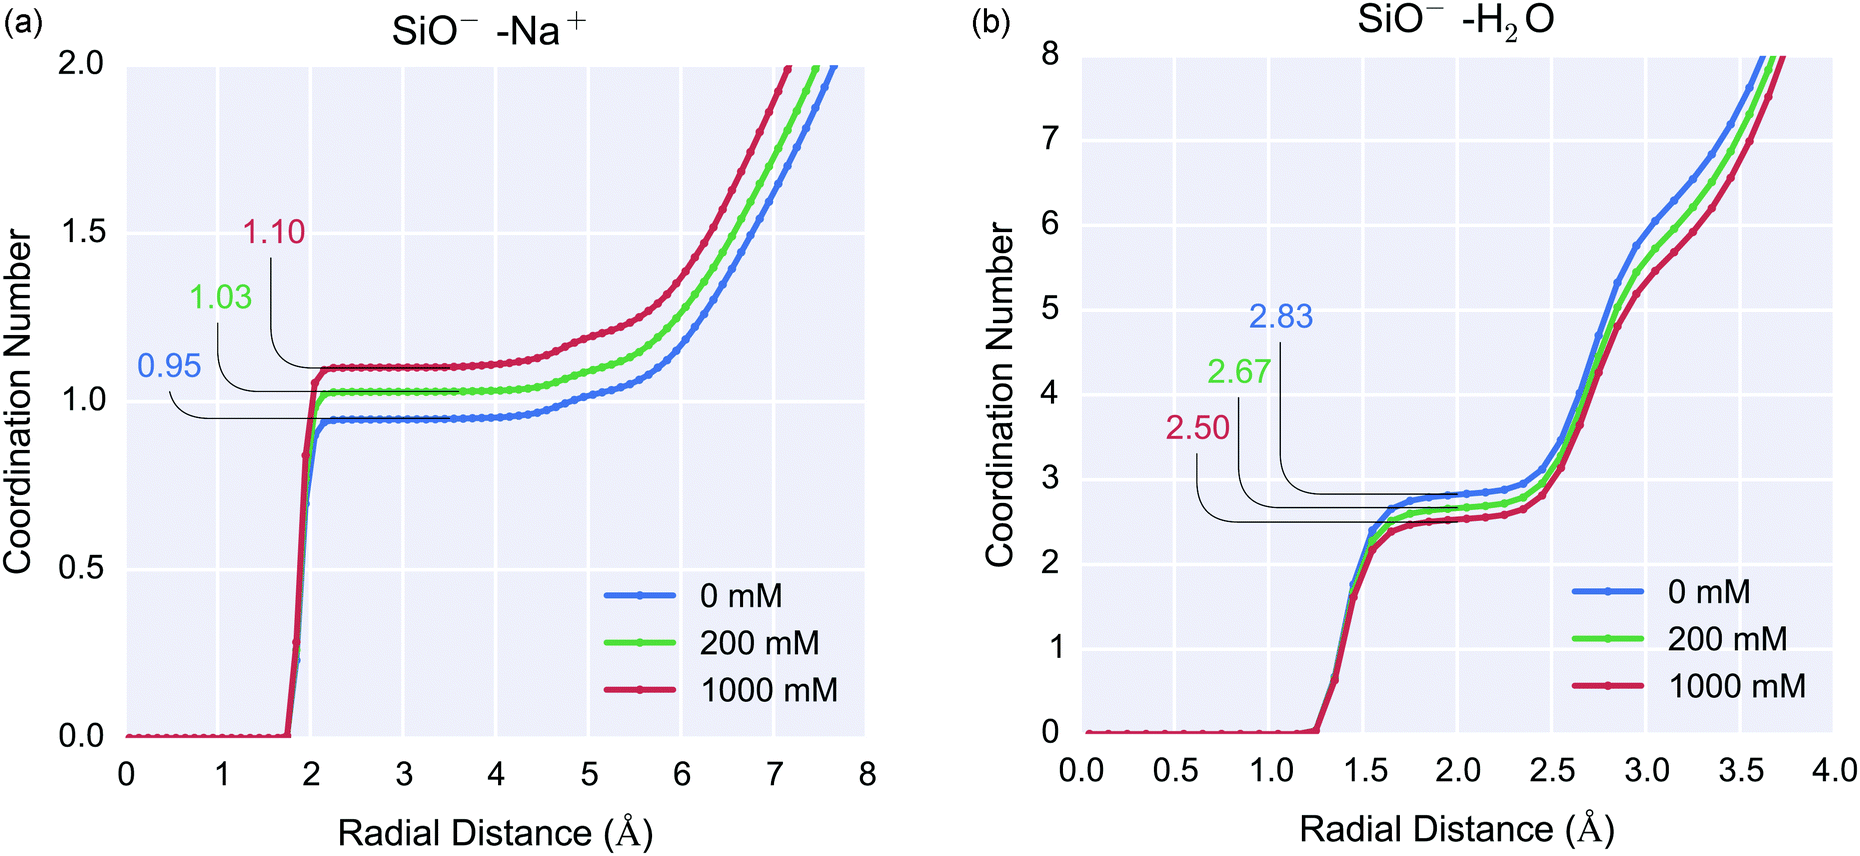 | ||
| Fig. 5 Silanolate-coordination number as a function of 0 mM, 200 mM and 1000 mM ionic strength for silica-water systems. (left) Silanolate–sodium coordination number 0.95, 1.03 and 1.10 for 0 mM, 200 mM and 1000 mM respectively (right) silanolate–water (hydrogen) coordination number 2.83, 2.67 and 2.5 for 0 mM, 200 mM and 1000 mM ionic strength respectively. Increasing ionic strength resulted in an increase in sodium ion coordination to silanolate ions and corresponding decrease in water coordination. | ||
For the 0 mM case, the RDF demonstrated that for the silanolate groups, the mean O⋯Hwater hydrogen bond length was 1.25–2.0 Å and each silanolate was coordinated to 2–3 water molecules. The silanolate–Na+ coordination number increased with increasing ionic strength, resulting in coordination numbers of 0.95, 1.03 and 1.10 for 0 mM, 200 mM and 1000 mM respectively, as shown in Fig. 5(a). The increased concentration of cations did not affect the ionic bond length or result in multiple sodium ions per silanolate, but did result in a slight reduction in silanolate–water (hydrogen) coordination resulting in coordination numbers of 2.83, 2.67 and 2.5 for 0 mM, 200 mM and 1000 mM ionic strength respectively, as shown in Fig. 5(b). One explanation for this is that Na+ accumulation near the interface results in increased displacement of interfacial water.
The residence time of water molecules to silanolate groups was calculated to be 80 ps (based on a silanolate to hydrogen distance cutoff of 3.5 Å) and showed no dependence on ionic strength. This indicates that with increasing interfacial ionic concentration, the water dissociation rate is not significantly affected (ESI 4†).
In conclusion, increasing ionic strength reduced the equilibrium water coordination to silanolate groups, but the water–silanolate kinetics were not significantly affected.
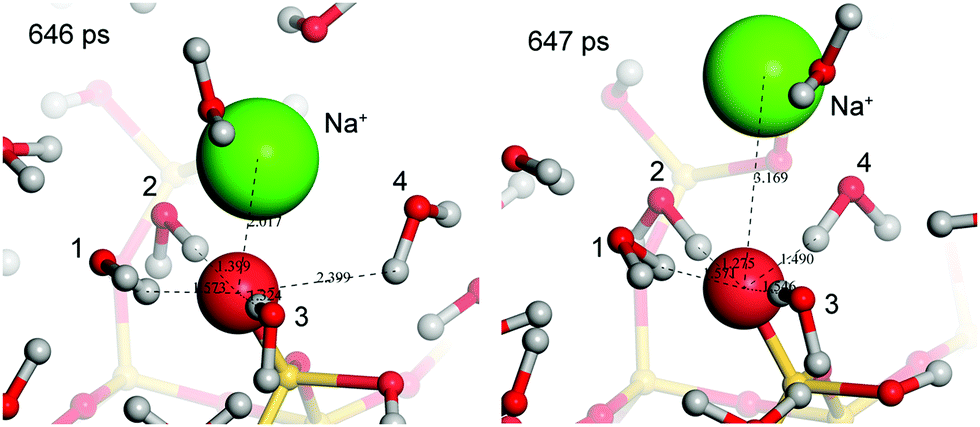 | ||
| Fig. 6 Mechanism of dissociation of Na+ from the silica surface. Snapshots taken from the 1 M system. At 646 ps water molecules (labeled 1–3) and the Na+ (green) were bound to the silanolate ion (large red sphere). Water 4 was loosely associated with a SiO−⋯H2O distance of 2.39 Å. Over the next picosecond, water 4 bound to the silanolate (SiO−⋯H distance of 1.49 Å) resulting in dissociation of the Na+. The Na+ then remained within 5 Å of the silanolate (second solvation sphere) for 40 ps before diffusing into the bulk. | ||
For the duration of all simulated systems presented in this paper, the Mg(aq)2+ ions retained their octahedral water coordination sphere, essentially remaining a single hexahydrated cluster, [Mg(H2O)6]2+, therefore supporting the notion that Mg2+ does not directly coordinate to the DNA. However, NMR experiments have measured a mean water–Mg2+ residence time of 1.5 μs69 and therefore, microsecond timescale molecular dynamics simulations would be required to sample the full configuration space of the solvent shell.
As discussed, magnesium ions are particularly important in nature and biological systems. Mg2+ is known to specifically adsorb to some oxides surface with the extent being highly surface and pH dependent.70,71 In this work, only on a few occasions did the magnesium ions remain near (<10 Å) the surface. In the 1 M simulation, a Mg2+ that was initialised near the surface remained near the surface for the first 1.5 ns and then adsorbed to a specific site, as shown in Fig. 7. This was the only example observed of stable (>500 ps residence time) adsorption of Mg2+ to the silica surface, and is the result of the formation of a hydrogen bonded network between two silanolate groups. This result contrasts with the CP/MAS NMR experiments of d'Espinose de la Caillerie et al. which suggested that Mg2+ forms direct Si–O–Mg bonds to the surface;72 this disagreement may be because their system does not contain sodium ions at the surface. These results suggest that magnesium ions do not readily displace silanolate-bound sodium ions, and that Mg2+ interacts with the surface via its solvation shell.
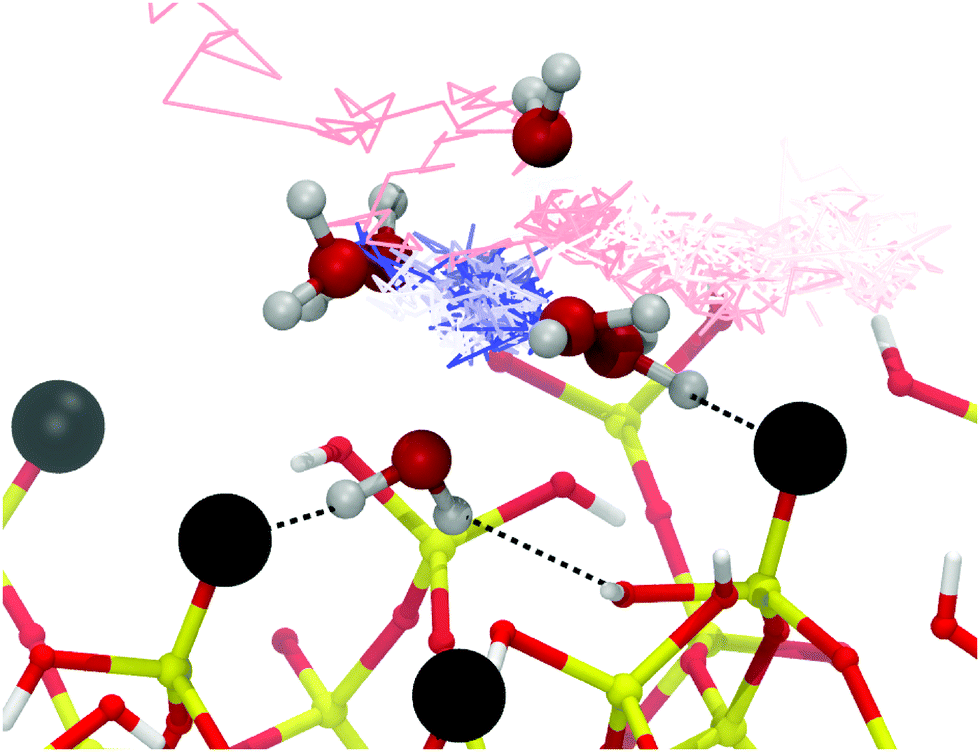 | ||
| Fig. 7 Adsorption trajectory of an Mg2+ cation at the silica-electrolyte (1 M ionic strength) interface. Silica and Mg2+ coordinating waters are shown from a snapshot taken at 3 ns. Silanolate groups are shown as black spheres. Hydrogen bonds to the surface are shown with black dotted lines. The trajectory of the Mg2+ is shown as a time-coloured line (red-white-blue) from approximately 750 ps (red) to 3 ns (blue). The blue cluster represents the Mg2+ reaching a stable adsorption site, the ion reached the site after 1.7 ns and remained there until the end of the simulation (1.3 ns duration). The Mg2+ did not bond directly with the negatively charged silanolate groups, instead forming a hydrogen bonded complex via its hexahydrate solvation sphere. | ||
4.2 Poisson–Nernst–Planck (PNP) double layer model
Direct experimental measurement of the distribution of interfacial charge is not available,36 however simulation of the EDL using a continuum model provides a theoretical comparison for expected ion distribution. Due to the high-surface potentials expected at oxide surfaces at the silica-water interface, linearisation of the Poisson–Boltzmann equation is invalid and so the full Poisson–Nernst–Planck equation73 is solved here with a Stern layer, in a simple Gouy–Chapman–Stern (GCS) model74 for a mixture of Mg2+, Na+ and Cl−. The details of this model are described in ESI 7.†The surface potential boundary condition was set to be equivalent to the surface charge density in the MD simulation of 0.2 C m−2 (see ESI 1 and 7† for further discussion); for example, for the same ionic concentrations as the 1 M mixed-valency MD system, a surface potential of 190 mV was used. This surface potential is in quantitative agreement with experimental measurements at the silica-water interface.75 At this surface potential, the ions have reached their bulk concentration within ∼1 nm from the surface, independent of ionic strength (ESI 7†).
The GCS has many limitations in high concentration systems. The dielectric constant of water will not be 80 near the surface due to the strong local interactions. Also, correlated motion between ions is not incorporated, which can be particularly important for systems containing divalent ions.45 A further, well-known limitation of the GCS model is that it does not describe finite-size effects and cannot describe the adsorption of ions to specific sites on the surface or ion–water interactions.
In the GCS, high surface potentials can result in extremely high concentrations <1 Å from the surface, which is physically unrealistic¶ due to steric constraints. By increasing the Stern layer thickness, the maximum concentration in the system is reduced, however it is possible to consider extensions to this models to better treat finite-size effects, for example, Kilic and Bazant73 have presented a model which replaces the Stern layer with a layer of cmax cations, or Brown et al.76 have presented a model incorporating hydration repulsion interactions which produced a Stern-like layer. These approaches share some findings in common, namely there is expected to be a high cationic concentration within ∼1 nm of the surface under these surface conditions, followed by the smooth decay into the bulk.36
In Fig. 8, the 1 M MD simulation results are compared to the GCS model. As expected, both give the result that the bulk concentration is reached within approximately 1 nm and there is a high cationic concentration within a few angstroms of the surface in a Stern-like layer. The simulations showed that, as discussed previously, strongly favourable solvation of the Mg2+ ions resulted in them being distributed roughly evenly through the solvent and not displacing the sodium ions at the surface, with only a small accumulation of ions at the surface (Fig. 8). This result is in good agreement with experimental observations for Mg2+ ions around DNA molecules in which the bound state is characteristic by almost complete hydration and free translation and rotational mobility.77 These results provide a description that cannot be obtained from the GCS formalism.
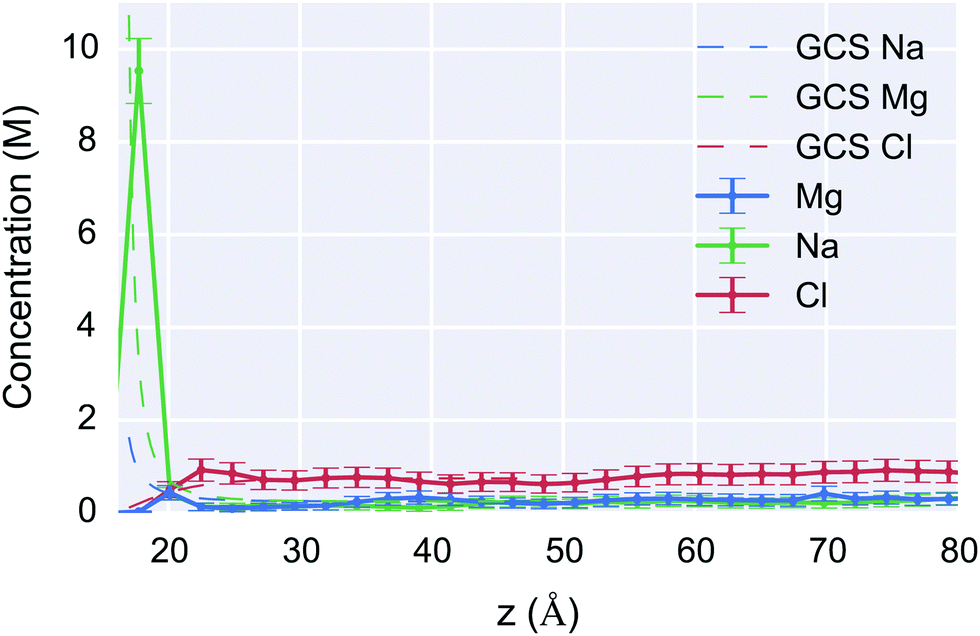 | ||
| Fig. 8 Concentration as a function of z-distance from the surface for the 1 M system (solid lines) compared to the Gouy–Chapman–Stern (GCS) model with a 0.5 Å Stern-layer at 190 mV surface potential (dotted lines). The horizontal lines show the uniform bin size for which the concentration was calculated, and the vertical error bars show the Standard Error of the Mean (SEM). The maximum Na+ concentration was 9.5 M and 1.6 M for the MD and GCS results respectively. The atomistic simulation corresponds well with the theory for the bulk concentration, and predicts a high concentration Stern-layer within a several angstroms of the surface. The Mg2+ concentration however is much more diffuse than predicted by the GCS because Mg2+ did not displace sodium ions from the Stern-layer; such atomistic-chemical effects cannot be described within the GCS formalism. | ||
These results might help to interpret the experimental results of Jayant et al. demonstrating an increase in DNA hybridisation sensitivity upon addition of trace amounts of divalent salt to a monovalent electrolyte system.15 In their paper, this effect was modelled using a Poisson–Boltzmann model modified to include the effect of variable ion-permittivity due to a biomolecule layer. The results presented here suggest that the double-layer structure for Mg2+ containing electrolyte may not be adequately described by the Poisson–Boltzmann model. This discussion will be extended to the effect of DNA later.
4.3 Effect of ionic strength on electrical double layer
The effect of increasing the ionic strength on the interfacial charge distribution is shown in Fig. 9(a). The cumulative charge is plotted as a function of the distance from the unit-cell origin in the z-direction, this figure was obtained as an integral of the average charge distribution (shown in ESI 8†). By plotting the cumulative charge, the zero-charge value corresponds to the position at which the double layer has fully compensated the surface charge. The charge due to silanolate ions is shown at z = 17–18 Å. There is strong similarity between the charge profiles for all ionic strengths and shows positive peaks at 18.5 Å and 21.5 Å, and negative peaks at 20.7 Å and 23.0 Å. These peaks are caused by oriented water molecules; with positive/negative pairs corresponding to layers of oriented water. The similarity between the different ionic strengths indicates that the water is orienting primarily as a result of the surface charge Si–O−/Na+ layer, as opposed to as a result of the diffuse layer of ions.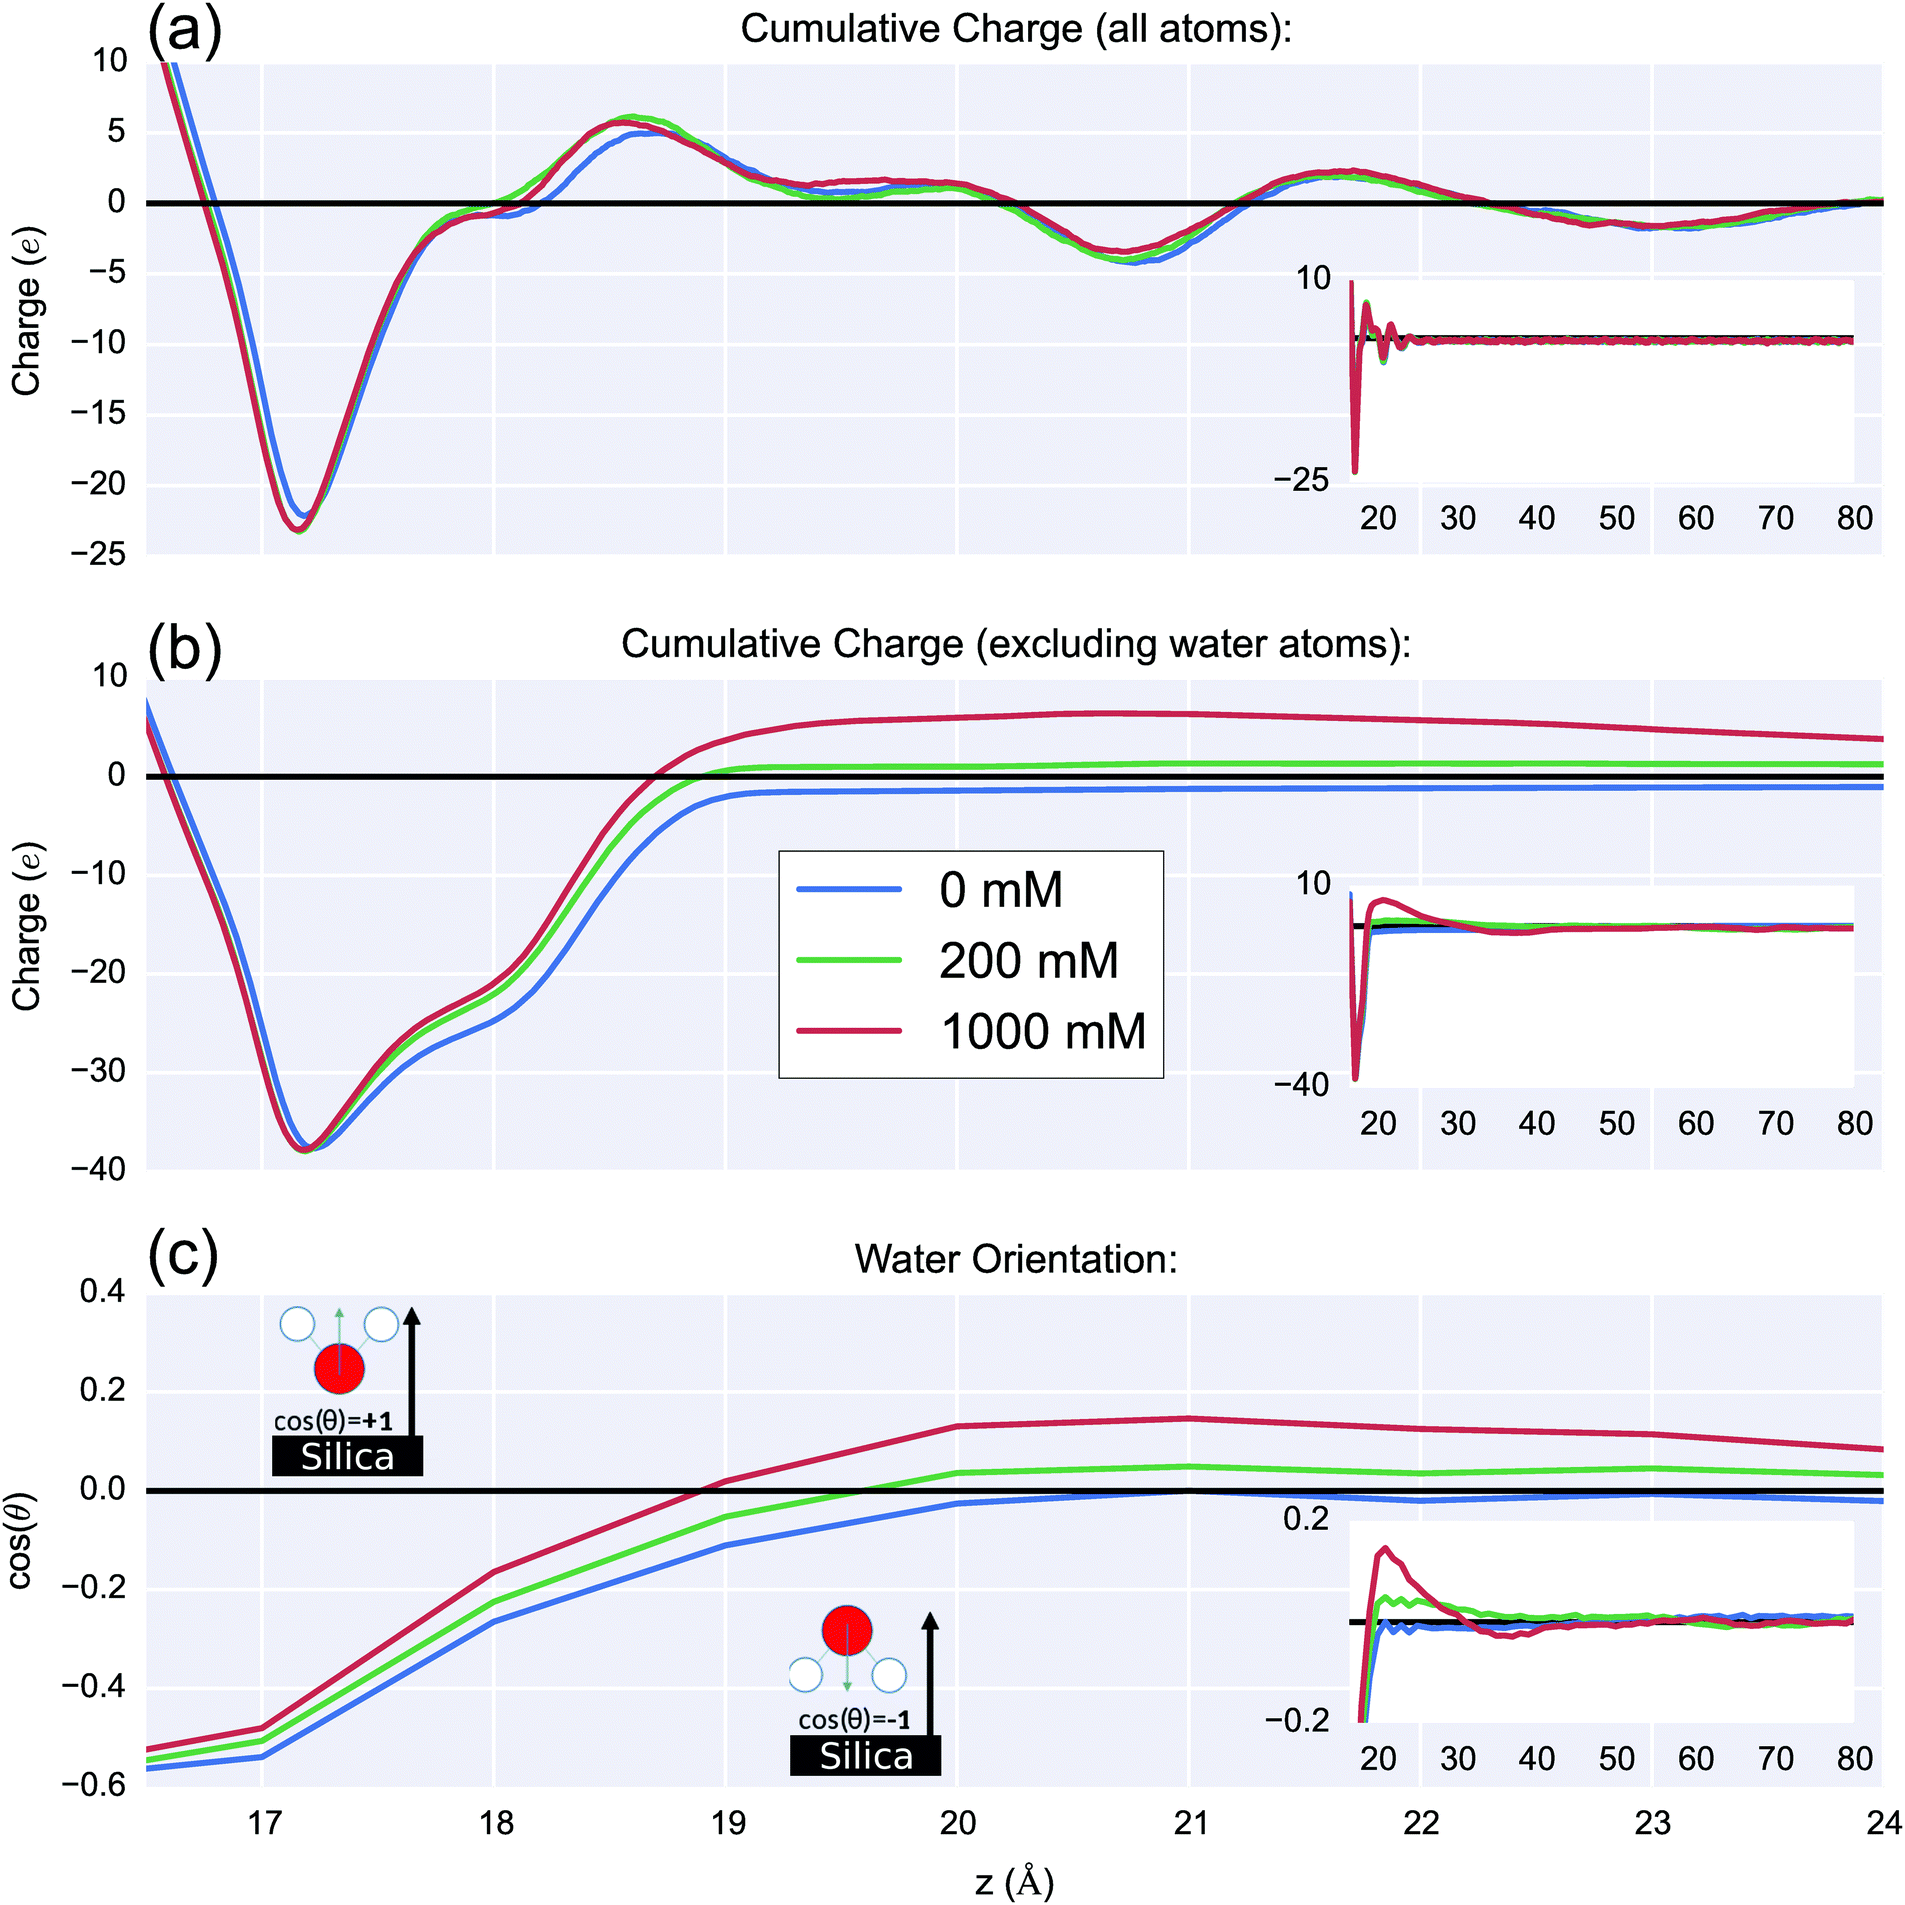 | ||
| Fig. 9 (a) Cumulative charge as a function of distance normal to the silica surface for 0 M, 0.2 M and 1 M systems, this figure is calculated based on cumulative sum of charges in 0.01 Å thick slabs parallel to the xy plane. The negative cumulative charge 16–19 Å was due to silanolate groups at the surface. The subsequent peaks were due to oriented water around the Stern-like layer of electrolyte at the surface. The positive peaks were dominated by hydrogen atoms from water, and the negative peaks by oxygen atoms from water. The inset shows the same graph but with an extended x-axis. (b) The same calculation with water charges are excluded. At ∼3 Å from the surface (z = ∼19 Å), zero cumulative charge was reached due to sodium and magnesium cations neutralising the surface charge. At high salt ionic strength there was a net positive cumulative charge 4–15 Å from the surface (z = 20–30 Å), sometimes called ‘charge inversion’ or ‘concentration polarisation’. The inset shows the same graph but with an extended x-axis. For the 1 M case, the increased positive accumulated charge near the surface induced a negative layer at 30–40 Å due to chloride ions. (c) The mean orientation of water dipoles (cos(θ)) relative to the silica-surface normal, as a function of the z-distance from the surface, using 1 Å bins. A negative value indicates the water hydrogens are pointing towards the silica surface, positive that they are pointing away, and 0 indicates either parallel to the surface or isotropic orientation. Within a few angstroms of the surface (z = 15–19 Å) the water molecules are oriented H-down towards the silanolate groups. Further from the surface, with increasing with ionic strength, the water increasingly orientates H-up towards the chloride ions in the double layer and O-down towards the cations in the Stern-like layer. For high ionic strengths, at ∼18–23 Å from the surface (z = 35–40 Å), the accumulation of chloride anions was sufficient to orientate water H-down, as shown in the inset, which shows the same graph but with an extended x-axis. As expected, the water became isotropic as the bulk was reached. | ||
The distribution of the diffuse-layer charge (≳3 Å from the surface) due to the ions can be seen more clearly by plotting the same function but excluding charges from water atoms, as seen in Fig. 9(b). With increasing ionic strength, an increase in cationic charge at the interface was observed which overcompensates the surface charge up to around ∼1.5 nm from the surface (z = 30 Å). This was due to a significant increase of Na+ and Mg2+ ions within a few angstroms of the surface, outweighing the cumulative charge from increased chloride ion density in the bulk. This effect is sometimes referred to as charge inversion and is known to occur for multivalent electrolytes near highly charged surfaces and highly charged molecules such as DNA.44 In this work, the charge inversion 1.5 nm from the surface was observed to be roughly proportional in magnitude to the ionic strength change (five-fold increase in ionic strength showed a five-fold increase in charge).
The orientation of the water with respect to the normal of the surface is shown in Fig. 9(c). With increasing ionic strength, orientational water polarisation increased. The water orientated H-down towards the negatively charged silica surface near the surface; this oxide-surface induced water polarisation is a well-known phenomenon.78,79 As expected, the water becomes isotropic as the bulk is reached.
In the high ionic strength simulations (0.2 M & 1 M), the water reoriented at 19–30 Å so as to be H-up towards chloride ions with oxygen towards the interfacial Mg2+ and Na+. MD simulations of the wet-charged interface in the literature have demonstrated water polarisation in monovalent electrolytes.28,80 However, the simulations presented here showed that for high ionic strengths, the accumulation of negative charge in the 35 Å to 40 Å region resulted in a secondary layer of H-down orientated water.
In conclusion, with increasing ionic strength, the equilibrium interfacial charge distribution was found to be primarily determined by the water structure around the silanolate and sodium ions at the surface, rather than as a result of the diffuse layer of ions. Charge accumulation and inversion were observed, however, water polarisation lowered the electrostatic energy of the system so as to produce a charge distribution (and therefore potential profile and electric field) which was independent of ionic strength.
In contrast, in the work presented here, the surface was initialised with a layer of compensating sodium ions; which represents an electroneutral system on the length-scale of the simulation domain. At high ionic strengths this is supported by both theory (Section 4.2) and experiment.81 For the low ionic strength (“0 mM”') system, this assumption may no longer hold, however the system provides a control against which to contrast the effect of increasing ionic strength. No increase in the interfacial charge density was observed with increasing the ionic strength of the bulk (Fig. 9(a) and ESI 8†); this can be explained by the fact that the surface layer was initialised saturated with a 1:1 ratio of counterions. The presence of counterions in the Stern-like layer meant that cation accumulation (Fig. 9(b)) was necessarily weaker than the systems of Maekawa et al., and was completely compensated by water polarisation. This observation has significance for interpreting the response of field-effect transistor-sensors which demonstrate a change in signal with changing ionic strength;30 if many silanolate groups are ion-paired with cations or sterically obstructed from cation binding e.g. proteins, an amorphous surface, then an increase in ionic strength is predicted to correspond to a weaker change in surface-charge accumulation and therefore device response.
A competing factor that could influence device response that is not considered in this work is the effect of variable surface charge. Titration experiments suggest that increasing ionic strength results in an larger apparent negative surface charge, which may be due to altering the chemical equilibrium of the silanol groups.82
4.4 DNA & the double layer
A key aim of this work was to investigate the effect of including DNA molecules on the structure of the interfacial EDL, the electric field and therefore BioFET response. It should be noted that this work does not attempt to provide a detailed analysis of DNA–ion pairing and DNA conformational dynamics, since this topic has received much attention within the literature to date.43,67,83,84:1 salt resulted in 85–85% neutralisation,87,88 and ion condensation has been observed via NMR for divalent ions such as cobalt– and manganese–polyphosphate systems.89 In mixed electrolyte, NMR experiments have shown Mg2+ can displace DNA-bound Na+.90
For the MD simulations presented in this paper, there was significant structuring of the water surrounding the DNA when compared to the simulations in absence of DNA (ESI 9†). The RDF of the 1 M DNA–electrolyte system is shown in Fig. 10, and shows that the DNA phosphate backbone attracted a structured counterion cloud in which sodium ions were associated closely with the phosphate groups at approximately 3 Å distance, and formed a secondary more diffuse layer at approximately 6 Å. Consistent with the literature,77 the magnesium ions were bound to phosphate groups via hydrogen bonding through the solvation shell; the exception was a single magnesium ion that was initialised in contact with a phosphate group.
 | ||
| Fig. 10 RDF for the phosphate groups of DNA to Mg2+ (blue) and Na+ (green) respectively, taken from the 1 M silica-DNA system. Na+ bound to the phosphate group directly, as seen by the peak at 3 Å. The coordination number is shown as an inset, Mg2+ interacted primarily with the DNA through hydrogen bonding of their hexahydrate solvation shell (∼5 Å distance). | ||
The percentage of ions per phosphate group was calculated by inspection of the phosphate–ion coordination number shown in the inset of Fig. 10. Values of 76% and 42% for Na+ and Mg2+ respectively, were calculated following the methodology of Young et al.,91,92 in which the second inflection point in the RDF curve was used. These values are in excellent agreement with both the Manning condensation theory predictions and experiment, for non-mixed electrolytes NaCl and MgCl2 solutions at low concentrations. It can be noted that, given the divalence of magnesium ions, each phosphate group has +1.69e counterion charge within approximately 6 Å, which is evidence of charge inversion around the DNA. This is a phenomenon that is expected for multivalent systems at high concentrations46 and is not described by Manning condensation theory, although more recent revisions of the theory have attempted to incorporate these effects.93
Continuing from before, in the work of Jayant et al.15 the enhanced FET-signal was attributed to a combination of (a) increased ion-exclusion of multivalent ions and (b) increased DNA-condensation in the presence of multivalent ions. The simulations presented here show no evidence of Mg2+ ion-exclusion in the DNA layer, suggesting that the previous observed increase in signal in multivalent salt was due to other effects, such as Mg2+ induced DNA-condensation onto the surface as supported by other MD studies, which discussed Mg2+ induced DNA aggregation.44
The full set of data from the simulations of the charge, potential and electric field in the interfacial region for all six cases, with and without DNA, is shown in ESI 8† for ease of comparison. In the simulations, DNA did not produce a strong effect on the time-average charge distribution of the systems. This might be seen as a counter-intuitive result given that the DNA has a negative charge, however the mechanical flexibility of the DNA–Na+ system means that the time-averaged charge of DNA with respect to the surface normal, is expected to be small at any bulk ionic strength.
The electrostatic potential (relative to the silica substrate at 0 V) calculated from this charge distribution, demonstrates that the potential change at the surface (ΔDNAψ = ψDNA(zsurf) − ψnoDNA(zsurf)) on the addition of DNA was on the scale of millivolts, for example, at the position of the silanolate groups (zsurf = 17 Å), Δψ = −18 mV, −0.5 mV and −37 mV for 0 mM, 200 mM and 1 M systems respectively. This is of the same order of magnitude as surface potential change measurements for biomolecule-oxide systems,96,97 however these changes were highly sensitive to the choice of surface coordinate and therefore cannot be taken as accurate prediction of surface potential change due to DNA.
Due to natural thermal fluctuations, this mean potential is variable. In order to explore this variability over time due to DNA, the long-range electric field in to the EDL was calculated by measuring the electric field on a test charge 1 Å below the base of the silica. Fig. 11 shows the z-component of the electric field as a function of time for all six cases. No significant difference was found between the electric field for the 0 mM (M = −0.00604, SD = 0.00986) and the 0 mM DNA system (M = −0.00596, SD = 0.0102) based on an independent samples t-test (t(2999) = −0.306, p = 0.759). For the higher ionic strength systems, a small but statistically significant change (200 mM system: p = 5 × 10−51; 1 M system: p = 7 × 10⁻²⁷) in electric field was observed upon addition of DNA ([E(DNA) − E(noDNA)] ≈ 0.002 V Å−1). If this change was a result of the DNA itself and not a result of noise, it would be expected that this response would be strongest in the 0 M system due to lowest ionic screening. Interestingly, the control 0 mM systems showed a 30–40% greater standard deviation in the electric field than the higher ionic strength systems; this indicates that bulk electrolyte may play a role in dampening transient fluctuations in the surface potential.
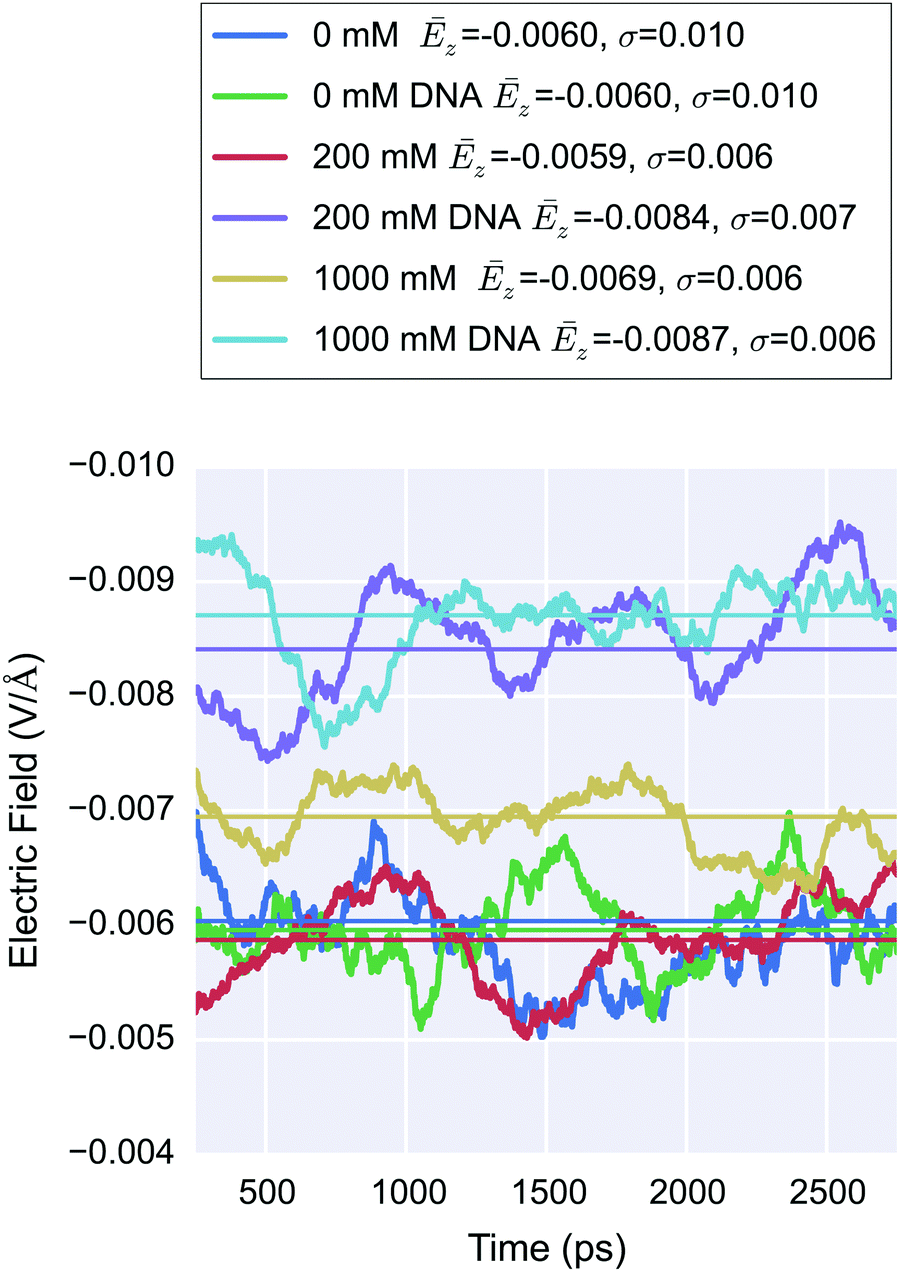 | ||
| Fig. 11 500 ps moving average of the electric field (z-component) at a test charge 1 Å below the silica substrate as a function of time, calculated using Ewald summation. For each system, the mean electric field, Ēz, is shown in the legend and drawn as a colored line, and the standard deviation, σ, is shown in the legend. The addition of DNA did not produce a significant change in Ēz field for the 0 mM systems but demonstrated a small, statistically significant change for higher ionic strength. | ||
As discussed previously (Section 4.3.1), increasing ionic strength is expected to increase the surface potential.28 The incorporation of an unsaturated Stern-like layer (silanolate groups at the surface without ion paired cations), produced an electric field which was screened as a result of bulk electrolyte and a compensating background charge introduced by the Ewald summation.28 In order to compare these simulations with the work presented in this paper, the mean electric field was calculated (shown in the figure in ESI 10†).
In addition, for the simulations presented in this paper, there was no compensating background charge and the system was neutralised by a Stern-like layer and the bulk electrolyte, resulting in a more compact double layer and therefore a weaker electric field by comparison. No trend in electric field change upon ionic strength increase was observed, in contrast to the strong changes in electric field for the unsaturated Stern layer systems of Maekawa et al. (ΔE[1M]–[0M] ≈ 0.02 V Å−1).28 This comparison suggests that the electrolyte structure within several angstroms of highly-charged interfaces has a far more significant effect on the electric field, and therefore BioFET response, than biomolecule net-charge/orientation. This also emphasises the importance of developing atomistic models with a realistic description of the Stern layer in order to obtain quantitative atomistic prediction of surface potential.
Finally, for nanowire BioFETs, with small cross sections in the semiconducting region, and a correspondingly high sensitivity, the spatial variation of the field is crucial in understanding the response rather than a smeared out average approximation of the behaviour of an artificial one-dimensional system.3,98,99 The spatial variation in the electric field at the surface of the silica was investigated for the control system (“0 mM”) and is shown in Fig. 12. This demonstrated that the DNA is having an effect on the local electric field at the surface; however screening from the condensed sodium ions and polarised water reduced the field such that the field perturbation due to DNA was weak compared to thermal noise.
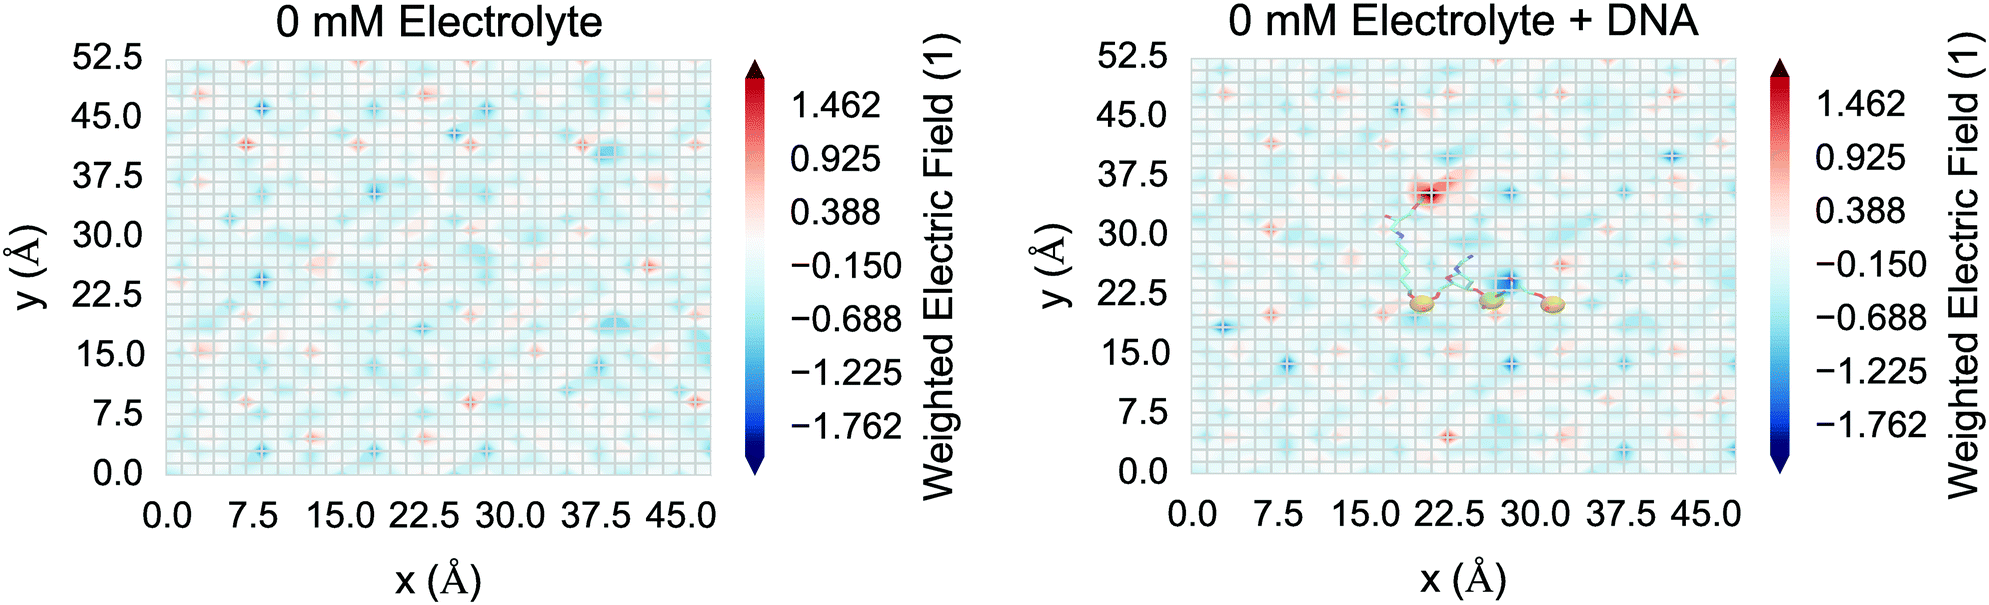 | ||
| Fig. 12 Weighted electric field (z-component) as a function of space in the xy plane at z = 17 Å for the “0 mM” system without DNA (left) and with DNA (right). The weighted electric field is the electric field divided by its standard deviation, which acts to filter out highly variable thermal noise. The electric field is calculated using the coulomb summation method, taking the mean of the z-component of the field (1 ps frames over the last 100 ps) on a grid of test charges and displayed as a linear interpolated heat map. In the each figure, regular patterns of negative and positive field are due to the regular arrangement of silanolate and ion-paired sodium ions respectively. In the DNA system (right), DNA atoms close to the surface are shown as a transparent overlay, with negative phosphate atoms shown as orange spheres. The positive region at y ≈ 35 Å is due to the positive hydrogen atom on the carbon linker and the negative regions at y ≈ 18 Å and y ≈ 25 Å are due to the negative charges of the DNA phosphate atoms, showing the DNA is having a local effect on the electric field. The magnitude of the electric field due to the DNA is low due to screening from condensed sodium ions and polarised water. | ||
These conclusions suggest that, with a compact neutralising Stern-like layer on the silica surface and around the DNA phosphate groups, that the electric field due to addition of DNA and ionic strength changes is negligible compared to thermal noise. The most likely explanation for BioFET response is that the double layer is more diffuse than determined by these simulations. Over timescales not currently reachable within this MD model, a more diffuse layer might be formed via sodium ions in the Stern-like layer dissociating due to water- or DNA-induced displacement.
5 Conclusions
To the best of the knowledge of the authors, this work presents the first classical molecular dynamics investigation of the bare silica-water interface incorporating magnesium ions, and provides a novel atomistic analysis of the effect of ionic strength and DNA on the electric field and EDL structure at these technologically important interfaces. In this work, molecular dynamics simulations were performed using 0 mM, 200 mM & 1000 mM ionic strength 1:1 MgCl2 to NaCl electrolyte, with and without DNA.
As discussed, understanding ion-dynamics at the silica-water interface is important for a range of systems. The simulations presented here demonstrate that increased ionic strength reduces the equilibrium water coordination to silanolate groups without significantly affecting the water–silanolate kinetics. Sodium ion surface-desorption kinetics required a two-step mechanism involving hypercoordination of the silanolate followed by desorption into the bulk. Sodium ions demonstrated a more kinetically stable solvation sphere at the silica-surface relative to the bulk due to the structuring of water at the interface.
Direct experimental measurement of the distribution of interfacial charge is not available36 and therefore the MD simulation results were compared to a continuum Poisson–Boltzmann model and revealed good agreement with regard to double-layer thickness and sodium ion accumulation. Mg2+ did not accumulate significantly at the interface, instead distributing more diffusely than predicted by the Poisson–Boltzmann model. This was as a result of the strong solvation of Mg2+ meaning it could not readily displace Na+ bound to the surface not described by the Poisson–Boltzmann formalism.
Fundamental understanding of the interfacial charge distribution and electric field is vital to understanding the mechanism of action of field-effect transistor (FET)-sensors. Increasing ionic strength was shown to result in charge inversion due to cation accumulation, an effect which is observed experimentally for divalent ions. The charge inversion 1.5 nm from the surface was observed to be roughly proportional in magnitude to the ionic strength change (five-fold increase in ionic strength showed a five-fold increase in charge). This suggests that charge inversion can begin at lower ionic strengths than those measured by Edel and de Mello.48
The results demonstrate that the equilibrium interfacial charge distribution was primarily determined by the water structure around the silanolate and sodium ions at the surface, rather than as a result of the diffuse layer of ions. Furthermore, the electrolyte structure within several angstroms of highly-charged interfaces had a far more significant effect on the electric field, and therefore FET-sensor response, than biomolecule net-charge/orientation. This supports the theory that the mechanism of action of FET-sensor is via modification of the surface chemistry (e.g. altering silanol/silanolate chemical equilibria) rather than the traditional picture based on directly sensing the electric field of the biomolecule.2
As discussed, modelling of the FET-sensor response due to biomolecules is inhibited by a lack of understanding of the interfacial electric field and ion distribution in the presence of biomolecules. The results showed that with DNA present, there was minimal effect due to water polarisation and strong screening by the condensed layer of electrolyte. The first calculation of the time-varying electric field for these systems was presented and, by comparison to a low ionic strength control, showed that bulk electrolyte plays a role in dampening transient fluctuations in the electric field and therefore device response.
These results have relevance to interpreting the experimental results of Jayant et al.15 which demonstrated an increase in DNA hybridisation sensitivity upon addition of trace amounts of divalent salt to a monovalent-electrolyte system, attributed to ion-exclusion from the DNA region and/or DNA aggregation. The simulations presented here showed no evidence of ion-exclusion from the DNA region and suggests that both (a) the Poisson–Boltzmann model may not be capable of accurately describing the EDL in the presence of mixed electrolyte, and (b) a mechanism other than ion-exclusion, such as DNA aggregation, explains the observed increase in response.
The results also emphasise the role of the Stern-like layer in understanding the response of FET sensors. Changes in the surface charge density (density of silanolate and condensed ions) would be expected to alter the electric field significantly, but in this work, surface charge is effectively fixed due to the long timescale of cation desorption and no chemical reactions. Future work will address this limitation by varying the surface charge on the surface of the model, which can be compared directly with existing experimental titration data.75 This will allow quantification of the extent to which the Stern-like layer modulates the electric field and therefore improve fundamental understanding of sensor response.
Acknowledgements
The authors would like to thank Yasushi Shibuta for providing High Performance Computing (HPC) Facilities at the University of Tokyo. The authors acknowledge the use of the IRIDIS HPC Facility, and associated HPC and linux support services at the University of Southampton, in the completion of this work. This work was supported by an EPSRC Doctoral Training Centre grant (EP/G03690X/1) and the JSPS 2015 Summer Fellowship. Data supporting this study are available from the University of Southampton repository at http://dx.doi.org/10.5258/SOTON/401018.References
- M.-Y. Shen, B.-R. Li and Y.-K. Li, Biosens. Bioelectron., 2014, 60, 101–111 CrossRef CAS PubMed.
- G. Shalev, Y. Rosenwaks and I. Levy, Biosens. Bioelectron., 2012, 31, 510–515 CrossRef CAS PubMed.
- L. De Vico, L. Iversen, M. H. Sørensen, M. Brandbyge, J. Nygård, K. L. Martinez and J. H. Jensen, Nanoscale, 2011, 3, 3635 RSC.
- C. Barbé, J. Bartlett, L. Kong, K. Finnie, H. Q. Lin, M. Larkin, S. Calleja, A. Bush and G. Calleja, Adv. Mater., 2004, 16, 1959–1966 CrossRef.
- J. V. Smith, Proc. Natl. Acad. Sci. U. S. A., 1998, 95, 3370–3375 CrossRef CAS.
- J. D. Kubicki, J. O. Sofo, A. A. Skelton and A. V. Bandura, J. Phys. Chem. C, 2012, 116, 17479–17491 CAS.
- T. Metke, A. S. Westover, R. Carter, L. Oakes, A. Douglas and C. L. Pint, Sci. Rep., 2016, 6, 24680 CrossRef CAS PubMed.
- O. Stern, Z. Elektrochem. Angew. Phys. Chem., 1924, 30, 508–516 CAS.
- H. Helmholtz, Ann. Phys., 1853, 165, 211–233 CrossRef.
- G. Gouy, J. Phys., 1910, 9, 457–467 Search PubMed.
- D. L. Chapman, Philos. Mag. Series 6, 1913, 25, 475–481 CrossRef.
- D. Grahame, Chem. Rev., 1947, 41, 441–501 CrossRef CAS PubMed.
- P. M. Dove and C. J. Nix, Geochim. Cosmochim. Acta, 1997, 61, 3329–3340 CrossRef CAS.
- D. E. Draper, D. Grilley and A. M. Soto, Annu. Rev. Biophys. Biomol. Struct., 2005, 34, 221–243 CrossRef CAS PubMed.
- K. Jayant, K. Auluck, S. Rodriguez, Y. Cao and E. C. Kan, Phys. Rev. E: Stat., Nonlinear, Soft Matter Phys., 2014, 89, 052817 CrossRef PubMed.
- R. de la Rica, C. Fernández-Sánchez, C. Jiménez-Jorquera and A. Baldi, J. Phys. Chem. B, 2008, 112, 7614–7617 CrossRef CAS PubMed.
- A. A. Shul'ga, M. Koudelka-Hep and N. F. de Rooij, Sens. Actuators, B, 1995, 27, 432–435 CrossRef.
- L. De Vico, M. H. Sørensen, L. Iversen, D. M. Rogers, B. S. Sørensen, M. Brandbyge, J. Nygård, K. L. Martinez and J. H. Jensen, Nanoscale, 2011, 3, 706 RSC.
- D. Cahen, R. Naaman and Z. Vager, Adv. Funct. Mater., 2005, 15, 1571–1578 CrossRef CAS.
- C. Heitzinger, N. J. Mauser and C. Ringhofer, SIAM J. Appl. Math., 2010, 70, 1634–1654 CrossRef.
- C. Heitzinger, Y. Liu, N. J. Mauser, C. Ringhofer and R. W. Dutton, J. Comput. Theor. Nanosci., 2010, 7, 2574–2580 CrossRef CAS.
- G. Zheng, X. P. A. Gao and C. M. Lieber, Nano Lett., 2010, 10, 3179–3183 CrossRef CAS PubMed.
- S. Rumyantsev, G. Liu, M. S. Shur, R. A. Potyrailo and A. A. Balandin, Nano Lett., 2012, 12, 2294–2298 CrossRef CAS PubMed.
- I. Jokić, M. Frantlović, Z. Djurić, K. Radulović and Z. Jokić, Microelectron. Eng., 2015, 144, 32–36 CrossRef.
- K. Georgakopoulou, A. Birbas and C. Spathis, J. Appl. Phys., 2015, 117, 104505 CrossRef.
- M.-P. Lu, E. Vire and L. Montès, Nanotechnology, 2015, 26, 495501 CrossRef PubMed.
- A. Rimola, D. Costa, M. Sodupe, J.-F. Lambert and P. Ugliengo, Chem. Rev., 2013, 113, 4216–4313 CrossRef CAS PubMed.
- Y. Maekawa, Y. Shibuta and T. Sakata, ChemElectroChem, 2014, 1, 1516–1524 CrossRef CAS.
- Y. Maekawa, Y. Shibuta and T. Sakata, J. Surf. Finish. Soc. Jpn., 2014, 65, 251–256 CrossRef CAS.
- Y. Maekawa, Y. Shibuta and T. Sakata, Jpn. J. Appl. Phys., 2013, 52, 127001 CrossRef.
- Y. Maekawa, Y. Shibuta and T. Sakata, Chem. Phys. Lett., 2015, 619, 152–157 CrossRef CAS.
- C. D. Lorenz, P. S. Crozier, J. A. Anderson and A. Travesset, J. Phys. Chem. C, 2008, 112, 10222–10232 CAS.
- S. V. Patwardhan, F. S. Emami, R. J. Berry, S. E. Jones, R. R. Naik, O. Deschaume, H. Heinz and C. C. Perry, J. Am. Chem. Soc., 2012, 134, 6244–6256 CrossRef CAS PubMed.
- F. S. Emami, V. Puddu, R. J. Berry, V. Varshney, S. V. Patwardhan, C. C. Perry and H. Heinz, Chem. Mater., 2014, 26, 2647–2658 CrossRef CAS.
- F. S. Emami, V. Puddu, R. J. Berry, V. Varshney, S. V. Patwardhan, C. C. Perry and H. Heinz, Chem. Mater., 2014, 26, 5725–5734 CrossRef CAS.
- H. Zhang, A. A. Hassanali, Y. K. Shin, C. Knight and S. J. Singer, J. Chem. Phys., 2011, 134, 024705 CrossRef PubMed.
- B. M. Lowe, C.-K. Skylaris and N. G. Green, J. Colloid Interface Sci., 2015, 451, 231–244 CrossRef CAS PubMed.
- Á. Cimas, F. Tielens, M. Sulpizi, M.-P. Gaigeot and D. Costa, J. Phys.: Condens. Matter, 2014, 26, 244106 CrossRef PubMed.
- K. Leung, I. M. B. Nielsen and L. J. Criscenti, J. Am. Chem. Soc., 2009, 131, 18358–18365 CrossRef CAS PubMed.
- F. Musso, P. Mignon, P. Ugliengo and M. Sodupe, Phys. Chem. Chem. Phys., 2012, 14, 10507 RSC.
- A. Tilocca and A. N. Cormack, ACS Appl. Mater. Interfaces, 2009, 1, 1324–1333 CAS.
- A. M. Soto, V. Misra and D. E. Draper, Biochemistry, 2007, 46, 2973–2983 CrossRef CAS PubMed.
- W. Li, L. Nordenskiöld and Y. Mu, J. Phys. Chem. B, 2011, 115, 14713–14720 CrossRef CAS PubMed.
- B. Luan and A. Aksimentiev, J. Am. Chem. Soc., 2008, 130, 15754–15755 CrossRef CAS PubMed.
- E. Wernersson, R. Kjellander and J. Lyklema, J. Phys. Chem. C, 2010, 114, 1849–1866 CAS.
- A. Y. Grosberg, T. T. Nguyen and B. I. Shklovskii, Rev. Mod. Phys., 2002, 74, 329–345 CrossRef CAS.
- K. Besteman, M. A. G. Zevenbergen, H. A. Heering and S. G. Lemay, Phys. Rev. Lett., 2004, 93, 170802 CrossRef CAS PubMed.
- J. B. Edel and A. de Mello, Nanofluidics: Nanoscience and Nanotechnology, Royal Society of Chemistry, 2009, p. 7 Search PubMed.
- K. Jayant, K. Auluck, M. Funke, S. Anwar, J. B. Phelps, P. H. Gordon, S. R. Rajwade and E. C. Kan, Phys. Rev. E: Stat., Nonlinear, Soft Matter Phys., 2013, 88, 012801 CrossRef PubMed.
- K. Jayant, K. Auluck, M. Funke, S. Anwar, J. B. Phelps, P. H. Gordon, S. R. Rajwade and E. C. Kan, Phys. Rev. E: Stat., Nonlinear, Soft Matter Phys., 2013, 88, 012802 CrossRef PubMed.
- D. C. Rapaport, The Art of Molecular Dynamics Simulation, Cambridge University Press, 2004 Search PubMed.
- B. Luan and A. Aksimentiev, Soft Matter, 2010, 6, 243–246 RSC.
- H. Sun, J. Phys. Chem. B, 1998, 102, 7338–7364 CrossRef CAS.
- Accelrys Software Inc., Accelrys Material Studio 8.0, 2007.
- R. W. Impey, P. A. Madden and I. R. McDonald, J. Phys. Chem., 1983, 87, 5071–5083 CrossRef CAS.
- E. Wasserman, J. R. Rustad and A. R. Felmy, Surf. Sci., 1999, 424, 19–27 CrossRef CAS.
- F. Bruni, S. Imberti, R. Mancinelli and M. A. Ricci, J. Chem. Phys., 2012, 136, 064520 CrossRef CAS PubMed.
- N. T. Skipper and G. W. Neilson, J. Phys.: Condens. Matter, 1989, 1, 4141 CrossRef CAS.
- S. B. Rempe and L. R. Pratt, Fluid Phase Equilib., 2001, 183–184, 121–132 CrossRef CAS.
- N. Korolev, A. P. Lyubartsev, A. Laaksonen and L. Nordenskiöld, Nucleic Acids Res., 2003, 31, 5971–5981 CrossRef CAS PubMed.
- E. L. Cussler, Diffusion: Mass Transfer in Fluid Systems, Cambridge University Press, 2009, p. 162 Search PubMed.
- S. E. Ingebritsen and W. E. Sanford, Groundwater in Geologic Processes, Cambridge University Press, 1999 Search PubMed.
- A. Chatterjee, M. K. Dixit and B. L. Tembe, J. Phys. Chem. A, 2013, 117, 8703–8709 CrossRef CAS PubMed.
- K. Krynicki, C. D. Green and D. W. Sawyer, Faraday Discuss. Chem. Soc., 1978, 66, 199 RSC.
- D. van der Spoel, P. J. van Maaren and H. J. C. Berendsen, J. Chem. Phys., 1998, 108, 10220–10230 CrossRef CAS.
- I. Waluyo, C. Huang, D. Nordlund, U. Bergmann, T. M. Weiss, L. G. M. Pettersson and A. Nilsson, J. Chem. Phys., 2011, 134, 064513 CrossRef PubMed.
- C. Maffeo, J. Yoo, J. Comer, D. B. Wells, B. Luan and A. Aksimentiev, J. Phys.: Condens. Matter, 2014, 26, 413101 CrossRef CAS PubMed.
- M. Sotomayor, V. Vásquez, E. Perozo and K. Schulten, Biophys. J., 2007, 92, 886–902 CrossRef CAS PubMed.
- A. Bleuzen, P.-A. Pittet, L. Helm and A. E. Merbach, Magn. Reson. Chem., 1997, 35, 765–773 CrossRef CAS.
- D. J. Wesolowski, M. L. Machesky, M. K. Ridley, D. A. Palmer, Z. Zhang, P. A. Fenter, M. Predota and P. T. Cummings, ECS Trans., 2008, 11, 167–180 CAS.
- R. Jolsterå, L. Gunneriusson and A. Holmgren, J. Colloid Interface Sci., 2012, 386, 260–267 CrossRef PubMed.
- J.-B. d'Espinose de la Caillerie, M. Kermarec and O. Clause, J. Phys. Chem., 1995, 99, 17273–17281 CrossRef.
- M. S. Kilic, M. Z. Bazant and A. Ajdari, Phys. Rev. E: Stat., Nonlinear, Soft Matter Phys., 2007, 75, 021502 CrossRef PubMed.
- O. Stern, Z. Elektrochem. Angew. Phys. Chem., 1924, 30, 508–516 CAS.
- M. A. Brown, Z. Abbas, A. Kleibert, R. G. Green, A. Goel, S. May and T. M. Squires, Phys. Rev. X, 2016, 6, 011007 Search PubMed.
- M. A. Brown, G. V. Bossa and S. May, Langmuir, 2015, 31, 11477–11483 CrossRef CAS PubMed.
- G. S. Manning, Q. Rev. Biophys., 1978, 11, 179 CrossRef CAS PubMed.
- S. Ong, X. Zhao and K. B. Eisenthal, Chem. Phys. Lett., 1992, 191, 327–335 CrossRef CAS.
- V. Ostroverkhov, G. A. Waychunas and Y. R. Shen, Phys. Rev. Lett., 2005, 94, 046102 CrossRef PubMed.
- J. N. Glosli and M. R. Philpott, Electrochim. Acta, 1996, 41, 2145–2158 CrossRef CAS.
- T. Baimpos, B. R. Shrestha, S. Raman and M. Valtiner, Langmuir, 2014, 30, 4322–4332 CrossRef CAS PubMed.
- M. Kosmulski, Encyclopedia of Surface and Colloid Science, CRC Press, 2nd edn, 2006, vol. 3, p. 1863 Search PubMed.
- S. Y. Ponomarev, K. M. Thayer and D. L. Beveridge, Proc. Natl. Acad. Sci. U. S. A., 2004, 101, 14771–14775 CrossRef CAS PubMed.
- M. Rueda, E. Cubero, C. A. Laughton and M. Orozco, Biophys. J., 2004, 87, 800–811 CrossRef CAS PubMed.
- G. S. Manning, Acc. Chem. Res., 1979, 12, 443–449 CrossRef CAS.
- C. F. Anderson, M. T. Record Jr. and P. A. Hart, Biophys. Chem., 1978, 7, 301–316 CrossRef CAS PubMed.
- J. Skerjanc and U. P. Strauss, J. Am. Chem. Soc., 1968, 90, 3081–3085 CrossRef CAS PubMed.
- K. R. Bhat, PhD thesis, Rutgers University, 1974.
- P. Spegt and G. Weill, Biophys. Chem., 1976, 4, 143–149 CrossRef CAS PubMed.
- W. H. Braunlin, C. F. Anderson and M. T. Record, Biopolymers, 1986, 25, 205–214 CrossRef CAS PubMed.
- G. S. Manning and J. Ray, J. Biomol. Struct. Dyn., 1998, 16, 461–476 CAS.
- M. A. Young, B. Jayaram and D. L. Beveridge, J. Am. Chem. Soc., 1997, 119, 59–69 CrossRef CAS.
- B. I. Shklovskii, Phys. Rev. E: Stat. Phys., Plasmas, Fluids, Relat. Interdiscip. Top., 1999, 60, 5802–5811 CrossRef CAS.
- F. Patolsky, G. Zheng, O. Hayden, M. Lakadamyali, X. Zhuang and C. M. Lieber, Proc. Natl. Acad. Sci. U. S. A., 2004, 101, 14017–14022 CrossRef CAS PubMed.
- X. Duan, Y. Li, N. K. Rajan, D. A. Routenberg, Y. Modis and M. A. Reed, Nat. Nanotechnol., 2012, 7, 401–407 CrossRef CAS PubMed.
- E. Souteyrand, J. P. Cloarec, J. R. Martin, C. Wilson, I. Lawrence, S. Mikkelsen and M. F. Lawrence, J. Phys. Chem. B, 1997, 101, 2980–2985 CrossRef CAS.
- F. N. Ishikawa, M. Curreli, H.-K. Chang, P.-C. Chen, R. Zhang, R. J. Cote, M. E. Thompson and C. Zhou, ACS Nano, 2009, 3, 3969–3976 CrossRef CAS PubMed.
- M. O. Noor and U. J. Krull, Anal. Chim. Acta, 2014, 825, 1–25 CrossRef CAS PubMed.
- D. Passeri, A. Morozzi, K. Kanxheri and A. Scorzoni, Biomed. Eng. Online, 2015, 14, S3 CrossRef PubMed.
Footnotes |
| † Electronic supplementary information (ESI) available. See DOI: 10.1039/c6cp04101a |
| ‡ These authors contributed equally to this work. |
| § However, another more recently hypothesised mechanism of detection is via detecting changes in EDL dipole moment in absence of changes to the surface concentration of ionised groups (e.g. surface charge) or free charges (e.g. electrolyte ions or charged biomolecules like DNA) at the surface. This notion is supported by the experiments of Cahen et al. which showed FET response on addition of neutral organic molecules, or simply oxygen–water vapour.19 The importance of the dipole moment of the surface has been supported by the simulations of Heitzinger et al. based on the mean-field solution of the Poisson equation.20 This effect could be caused by electronic polarisation of neutral molecules at the silica-water interface. |
| ¶ The maximum concentration possible (cmax = a−3 where a is the ionic radius) given steric constraints is 25 M to 207 M for 2–4 Å cations respectively. |
| This journal is © the Owner Societies 2017 |