
 Open Access Article
 This Open Access Article is licensed under a Creative Commons Attribution-Non Commercial 3.0 Unported Licence
Hydrogen bond competition in the ethanol–methanol dimer†
Ian A.
Finneran
a,
P. Brandon
Carroll
a,
Griffin J.
Mead
a and
Geoffrey A.
Blake
*ab
aDivision of Chemistry and Chemical Engineering, California Institute of Technology, 1200 E California Blvd., Pasadena, CA 91125, USA
bDivision of Geological and Planetary Sciences, California Institute of Technology, 1200 E California Blvd., Pasadena, CA 91125, USA. E-mail: gab@gps.caltech.edu
First published on 25th July 2016
Abstract
Previous theoretical work on the ethanol–methanol dimer has been inconclusive in predicting the preferred hydrogen bond donor/acceptor configuration. Here, we report the microwave spectrum of the dimer using a chirped pulse Fourier transform microwave spectrometer from 8–18 GHz. In an argon-backed expansion, 50 transitions have been assigned to a trans-ethanol-acceptor/methanol-donor structure that is likely stabilized by a secondary weak C–H⋯O hydrogen bond. A higher energy conformer was observed in a helium-backed expansion and tentatively assigned to a gauche-ethanol-acceptor/methanol-donor structure. No ethanol-donor/methanol-acceptor dimers have been found, suggesting such interactions are energetically disfavored. A preliminary analysis of the A–E splitting due to the internal rotation of the methanol methyl group in the ground state species is also presented. We find evidence of the Ubbelohde effect in the measured A–E splittings of three deuterated isotopologues and the normal species of this conformer.
1 Introduction
Structural competition between hydrogen bond donors and acceptors influences the energetics of many chemical reactions, and the structure of biological macromolecules.1,2 Alcohol clusters are particularly interesting systems in the study of hydrogen bond competition, as they contain a combination of stronger hydrogen bonds as well as weaker hydrophobic interactions.3 Here, we report the microwave detection and analysis of the ethanol–methanol heterodimer, one of the simplest mixed alcohol dimers.A fundamental question in the study of hydrogen bond competition is the donor/acceptor preference when two molecules interact to form an isolated dimer. While the donor/acceptor strength of the two molecules is often a dominant force, weak hydrogen bonds and internal conformational preferences may also play a role. The ethanol–water, methanol–water, and tert-butyl alcohol–water dimers, for example, exhibit a clear preference for alcohol-acceptor/water-donor structures.4–6 For the ethanol–water dimer the most compact ethanol-acceptor/water-donor structure is favored over others, likely due to a secondary C–H⋯O hydrogen bond.4,5,7
The structural competition in the ethanol–methanol dimer is more ambiguous than that in ethanol–water, methanol–water, and tert-butyl alcohol–water. Past theoretical work, for example, has been inconclusive in determining the ground state structure of the ethanol–methanol dimer, though the lowest energy structures of the ethanol–water and methanol–water dimers were correctly predicted.8
In this work, we use chirped pulse Fourier transform microwave (CP-FTMW) spectroscopy9 to identify the two lowest energy conformers of the ethanol–methanol dimer. The broad bandwidth and high-resolution of CP-FTMW spectroscopy allows for the identification and differentiation of many species in a complex mixture, while the efficient cooling in the molecular beam promotes the formation of molecular clusters. The efficiency of vibrational state cooling in the beam can also be controlled by the choice of backing gas.10 This has been used in other hydrogen bonded clusters, such as the water hexamer, to determine the ground state structure when several conformers are close in energy.11 We first outline the experimental and theoretical methods employed here, before turning to a discussion of the results.
2 Methods
The Caltech CP-FTMW spectrometer has been previously described in detail, although several small modifications have been made since the initial construction.4,12 The design and principle of operation of the instrument are based on the original CP-FTMW molecular beam instrument at the University of Virginia.9Briefly, a 2 GHz 1 μs chirped pulse was upconverted to 8–18 GHz, amplified to 50 W, and broadcast either perpendicularly or coaxially to the molecular beam with a microwave horn. For the perpendicular geometry, the free induction decay (FID) from the sample was collected with a second horn, while for the coaxial geometry the FID was collected with the excitation horn and passed through a circulator. In both cases, the FID was passed through a single-pole, single-throw switch, amplified by a high gain, low noise amplifier, downconverted, and detected with a high-speed digitizer. The carrier gas (Ar or He) was pressurized to 50 psi, sent through a bubbler containing a 1![[thin space (1/6-em)]](https://www.rsc.org/images/entities/char_2009.gif) :1 mixture of ethanol and methanol, and pulsed into the vacuum chamber (∼10−6 Torr) with a Parker Series 9 pulsed value at 2–5 Hz. Ethan(ol-d) (99%) and methan(ol-d) (99%) were purchased from Sigma-Aldrich and used without further purification. Spectra of the deuterated isotopologues were collected with 1:1 mixtures of ethan(ol-d)/methanol, ethanol/methan(ol-d), and ethan(ol-d)/methan(ol-d) in the bubbler and 50 psi of Ar as the backing gas.
:1 mixture of ethanol and methanol, and pulsed into the vacuum chamber (∼10−6 Torr) with a Parker Series 9 pulsed value at 2–5 Hz. Ethan(ol-d) (99%) and methan(ol-d) (99%) were purchased from Sigma-Aldrich and used without further purification. Spectra of the deuterated isotopologues were collected with 1:1 mixtures of ethan(ol-d)/methanol, ethanol/methan(ol-d), and ethan(ol-d)/methan(ol-d) in the bubbler and 50 psi of Ar as the backing gas.
Ab initio calculations were performed using Gaussian 09.13 Initially, the potential energy surface was explored using second-order Møller–Plesset (MP2) perturbation theory14 and the augmented-correlation consistent polarized Valence-only Double-Zeta (aug-cc-pVDZ) basis set.15 Structure optimizations were started from all possible donor/acceptor sites and for both trans- and gauche-ethanol. For several donor/acceptor combinations secondary minima were identified by scanning the hydrogen bond dihedral angle between the hydroxyl groups. Overall, this analysis identified 7 possible conformers, as shown in Fig. 1.
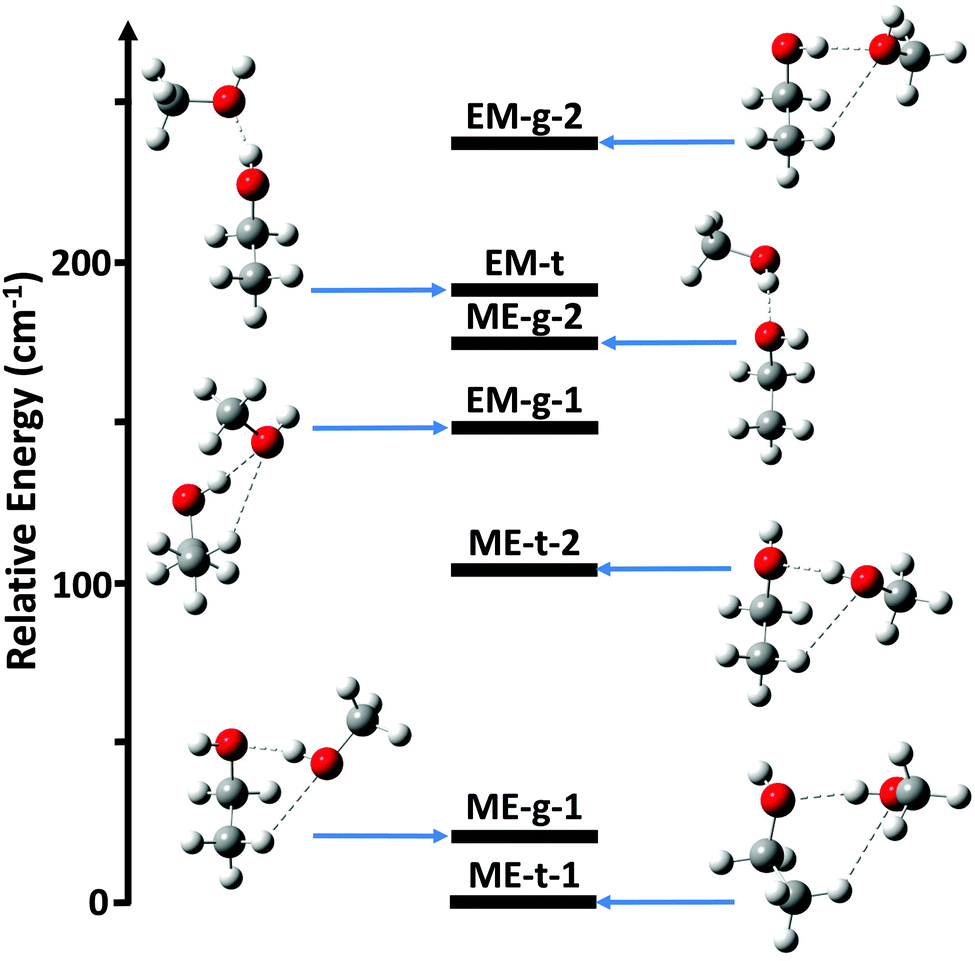 | ||
| Fig. 1 The ab initio relative energies, including zero point vibrational energy (ZPVE), of the various ethanol–methanol dimer conformers at the MP2/aug-cc-pVTZ level of theory. Single point energy calculations were performed using CCSD(T)/aug-cc-pVTZ. | ||
Next, the 7 minima were further optimized with MP2 and the augmented-correlation consistent polarized Valence-only Triple-Zeta (aug-cc-pVTZ) basis set16 using tight convergence criteria, followed by harmonic frequency calculations at the same level of theory. The relative energies of the conformers were calculated using single-point Coupled Cluster energy calculations with singles, doubles, and perturbative triples (CCSD(T))17 and the aug-cc-pVTZ basis set on the MP2/aug-cc-pVTZ optimized structures. The zero point vibrational energy (ZPVE) correction was added from the MP2/aug-cc-pVTZ frequency calculation. Second-order perturbative anharmonic vibrational calculations were performed using MP2/aug-cc-pVDZ on the initially optimized (MP2/aug-cc-pVDZ) structures to determine the ground state rotational constants (B0). Then MP2/aug-cc-pVTZ perturbative anharmonic calculations were performed on the three lowest energy MP2/aug-cc-pVTZ optimized structures.18 We were unable to run the anharmonic calculations on all conformers using MP2/aug-cc-pVTZ with the computational resources available.
Spectral analysis of the CP-FTMW data was performed with SPFIT/SPCAT and the Watson-S Hamiltonian,19 XIAM,20 a graphical Python assignment program, and AUTOFIT.21 The standard errors of the SPFIT rotational constants were calculated with PIFORM, the coordinate transformation to the Principal inertia Axis System (PAS) with PMIFST, and the Kraitchman substitution coordinates with KRA.22
3 Ab initio results
The ab initio relative energies of the dimer conformers are shown in Fig. 1, along with their associated rotational constants and dipole moments in Table 1. The predicted equilibrium structures in the PAS are given in the ESI.† Each species is labeled as either ME for methanol-donor, ethanol-acceptor or EM for ethanol-donor, methanol-acceptor. The gauche and trans conformations of the ethanol subunit are labeled as g and t, respectively. Distinct conformers with the same label have been further distinguished with a -1 or -2.| B e/TZ (MHz) | B 0/DZ (MHz) | B 0/TZ (MHz) | μ/TZ (D) | E/TZ (cm−1) | ||
|---|---|---|---|---|---|---|
| ME-t-1 | ||||||
| A | 7158 | 7028 | 7195 | |μa| | 2.7 | 0 |
| B | 2031 | 1964 | 1959 | |μb| | 0.3 | |
| C | 1772 | 1719 | 1713 | |μc| | 0.8 | |
| ME-g-1 | ||||||
| A | 8148 | 8051 | 8230 | |μa| | 1.9 | 21 |
| B | 1855 | 1797 | 1799 | |μb| | 0.9 | |
| C | 1633 | 1584 | 1588 | |μc| | 0.3 | |
| ME-t-2 | ||||||
| A | 6634 | 6530 | 6719 | |μa| | 2.5 | 106 |
| B | 2166 | 2070 | 2057 | |μb| | 0.6 | |
| C | 1961 | 1884 | 1871 | |μc| | 2.9 | |
| EM-g-1 | ||||||
| A | 7101 | 7005 | |μa| | 2.6 | 148 | |
| B | 2015 | 1939 | |μb| | 1.1 | ||
| C | 1787 | 1731 | |μc| | 0.8 | ||
| ME-g-2 | ||||||
| A | 12871 |
11030 |
|μa| | 3.0 | 175 | |
| B | 1383 | 1478 | |μb| | 0.9 | ||
| C | 1381 | 1430 | |μc| | 0.3 | ||
| EM-t | ||||||
| A | 14084 |
11378 |
|μa| | 2.7 | 192 | |
| B | 1371 | 1498 | |μb| | 0.7 | ||
| C | 1335 | 1434 | |μc| | 0.4 | ||
| EM-g-2 | ||||||
| A | 6776 | 6780 | |μa| | 2.7 | 237 | |
| B | 2056 | 1943 | |μb| | 1.2 | ||
| C | 1897 | 1811 | |μc| | 0.9 | ||
Overall, the energy calculations show a clear preference for ME rather than EM structures. The three lowest energy structures have methanol as the donor, and the lowest energy ethanol-donor structure is ∼150 cm−1 higher in energy than the ground state. The more elongated structures EM-t and ME-g-2, however, have a much smaller energy difference of 17 cm−1. Both of these conformers have a strong hydrogen bond, but lack the weak C–H⋯O interactions seen in more compact structures. This may indicate that the strong hydrogen bond competition in the ethanol/methanol dimer is quite balanced, consistent with previous theoretical work on this dimer.8
The remaining five structures, ME-t-1, ME-g-1, ME-t-2, EM-g-1, and EM-g-2, all exhibit weak C–H⋯O hydrogen bonds, in addition to the strong OH⋯O hydrogen bond. In these species it is important to consider the non-additive properties of hydrogen bonds. Specifically, cooperative donor–acceptor or acceptor–donor interactions are generally favored over anti-cooperative donor–donor or acceptor–acceptor interactions.2 For the three lowest energy ME structures the weak hydrogen bond is cooperative with the strong hydrogen bond, as the hydroxyl group of methanol is acting as a donor for the OH⋯O interaction and an acceptor for the C–H⋯O interaction. In the two higher energy EM structures the hydrogen bonds are anti-cooperative, with the methanol oxygen atom acting as an acceptor for both the OH⋯O and C–H⋯O interactions. Thus, the methanol-donor, ethanol-acceptor structures may be relatively stabilized by their cooperative interactions in addition to the O–H⋯O hydrogen bond.
4 Experimental results
To isolate the ethanol–methanol dimer signal, we collected the spectrum of pure ethanol and pure methanol in an argon-backed expansion, and subtracted them from the mixed ethanol–methanol spectrum (Fig. 2(a)). The strongest peaks in this subtracted spectrum (labeled ‘ethanol, methanol cut’ in Fig. 2(a)) were assigned to a series of a-type transitions. Weaker c-type and b-type transitions were also observed, yielding a total of 50 assigned transitions that were fit to an RMS of 18 kHz (Table 2). Several microwave–microwave double resonance measurements (Fig. 3(a–c)) confirmed the assignment. | ||
| Fig. 2 The experimental spectrum of an ethanol/methanol mixture expanded in Ar. (a) The experimental spectrum after cutting out the ethanol- and methanol-only spectra from the raw data. The ME-t-1 prediction at 2 K is shown with negative intensity in red. (b–d) Close ups of portions of the experimental and predicted spectra for the ME-t-1 conformer. | ||
| ME-t-1 | ME-g-1 | ||||
|---|---|---|---|---|---|
| EtOH/MeOH | EtOD/MeOH | EtOH/MeOD | EtOD/MeOD | EtOH/MeOH | |
| A/MHz | 7278.993(8) | 6911.(1) | 7235.6(5) | 6873.4(9) | 8230.(1) |
| B/MHz | 1909.880(1) | 1900.206(5) | 1908.497(2) | 1898.770(4) | 1770.832(3) |
| C/MHz | 1675.696(1) | 1649.315(5) | 1673.907(2) | 1647.678(4) | 1577.648(3) |
| DJ/kHz | 4.70(1) | * | * | * | 4.43(6) |
| DJK/kHz | −1.18(7) | * | * | * | −22.5(6) |
| DK/kHz | 39.(1) | * | * | * | — |
| d1/kHz | −0.809(6) | * | * | * | — |
| d2/kHz | −0.010(4) | * | * | * | — |
| N | 50 | 17 | 17 | 17 | 13 |
| RMS/kHz | 18 | 49 | 33 | 42 | 26 |
The fit rotational constants (Table 2) are close to those calculated for several of the ethanol–methanol dimer conformers (Table 1). The closest match is with the ME-t-1 conformer, although they are also somewhat close to EM-g-1. However, using the relative intensity information of the experimental spectrum, we estimate the ratio between the three dipole components in the PAS to be roughly μa ≈ 6μb ≈ 2μc. The observed μb/μc ratio is inconsistent with EM-g-1 but consistent with ME-t-1, so we assign the observed spectrum to the ME-t-1 conformer.
The spectra of two singly and one doubly deuterated species of the ME-t-1 conformer, as observed in argon expansions, were also fit (Table 2). The standard error on the A constant in these fits is larger than those of B and C, as only the strongest a-type transitions had sufficient signal-to-noise to be fit. For the singly substituted species, we calculated the positions of the hydrogens in the PAS using the Kraitchman single substitution equations (Table 3).23 However, caution is needed in interpreting the position of the methanol hydrogen, as the Kraitchman analysis assumes that the structure is nearly unchanged by the isotopic substitution. This is not the case for a H to D substitution in a hydrogen bond, because the vibrationally averaged deuterium bond can be shorter or longer than the hydrogen bond.24,25 A lengthening upon D substitution is typically seen in double minima potentials, where a proton can transfer between two equivalent positions, while shortening is observed in single well potentials, such as alcohol dimers.25,26 Such a change in hydrogen bond length, often called the Ubbelohde effect, has been shown to cause large errors in the substitution coordinates of hydrogen bonded clusters, e.g. ∼0.9 Å in the t-butylalcohol dimer.26 Thus, the ∼0.6 Å difference between the ab initio and experimental Kraitchman |a| coordinates that we observe on the methanol hydrogen, is likely due to this effect. Besides the Ubbelohde effect, the errors on the coordinates of this hydrogen are high, due to its vicinity to the center of mass.27 The substitution coordinates of the ethanol hydrogen, however, show much better agreement with the ab initio results, as this hydrogen is not part of the hydrogen bond (Table 3). Indeed, the coordinates confirm that ethanol is the trans conformation, the lowest energy state of the isolated monomer. This is distinct from the ethanol dimer and the ethanol/water dimer, in which a gauche conformation is preferred (Fig. 4).4,5
| Ab initio | Experiment | ||
|---|---|---|---|
| CH3CH2OH | |a|/Å | 1.16 | 1.11 |
| |b|/Å | 1.93 | 1.90 | |
| |c|/Å | 0.27 | 0.35 | |
| CH3OH | |a|/Å | 0.88 | 0.22 |
| |b|/Å | 0.60 | 0.52 | |
| |c|/Å | 0.30 | 0.38 | |
Next, we switched the backing gas for the expansion to helium and collected the mixed ethanol–methanol spectrum. In the helium expansion the overall signal-to-noise ratio of all the peaks is decreased, but the cooling conditions allow the population of excited conformations. We measured 13 new a-type transitions that were fit to an RMS of 26 kHz (Table 2), and confirmed the assignments with double resonance measurements (Fig. 3(d)). We assigned the new spectrum to the ME-g-1 conformer based on the values of the measured constants. The new peaks are not seen in the argon-backed expansion (Fig. 5), verifying that the ME-t-1 conformer is lower in energy than the ME-g-1 conformer.
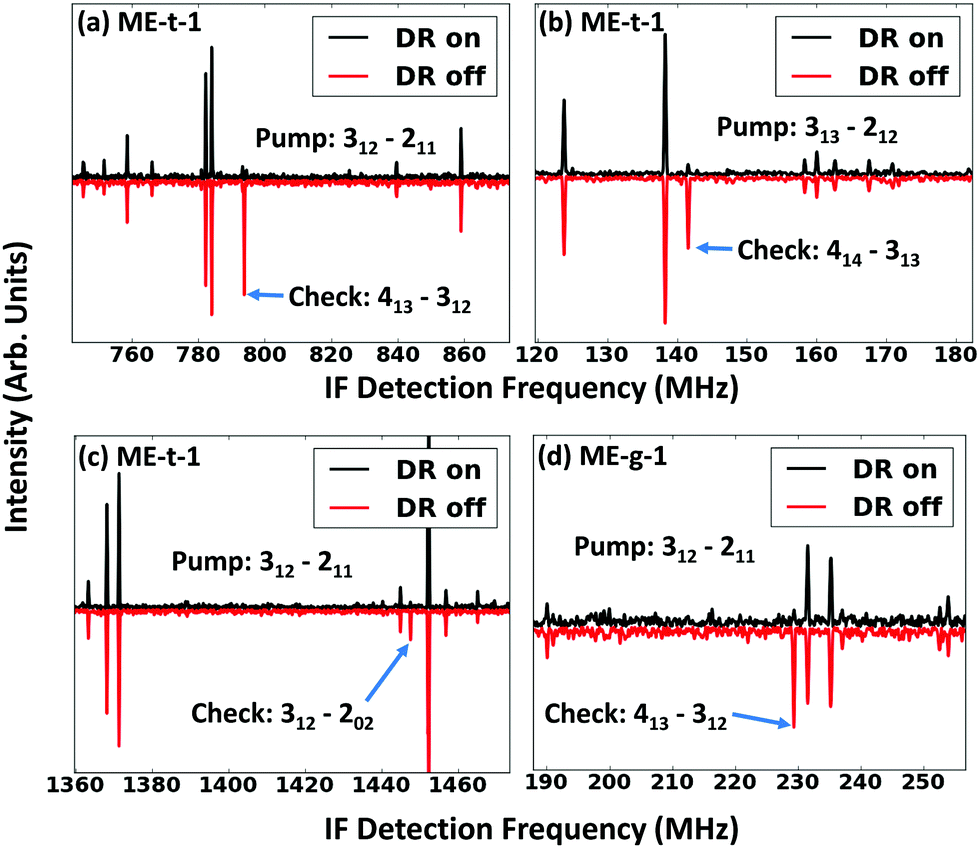 | ||
| Fig. 3 Double resonance (DR) measurements of the ME-t-1 conformer (a–c), and the ME-g-1 conformer (d). For each spectrum, a narrowband pulse was applied to the ‘pump’ transition after the standard broadband chirped pulse. Modulation was measured on the connected ‘check’ transition. Neighboring peaks to the check transition were used as a control, to make certain that there is not broad, non-resonant modulation in the spectrum. | ||
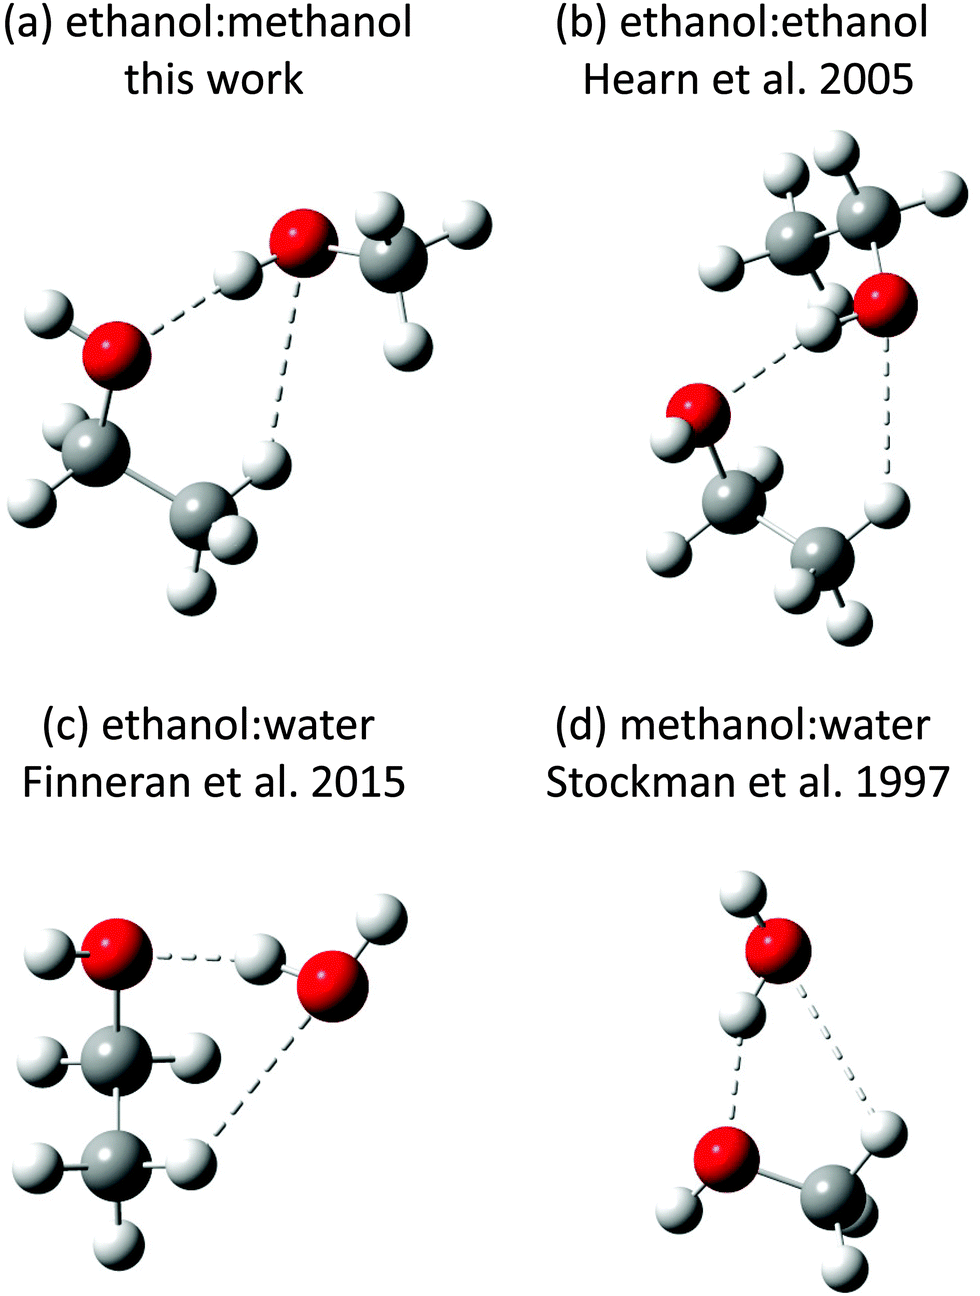 | ||
| Fig. 4 The lowest energy structures of several dimers containing ethanol or methanol. The alcohols act as acceptors in the methanol–water and ethanol–water dimers, while in ethanol–methanol the ethanol is an acceptor. Interestingly, ethanol is in the trans configuration for ethanol–methanol but the gauche configuration for ethanol–ethanol and ethanol–water. | ||
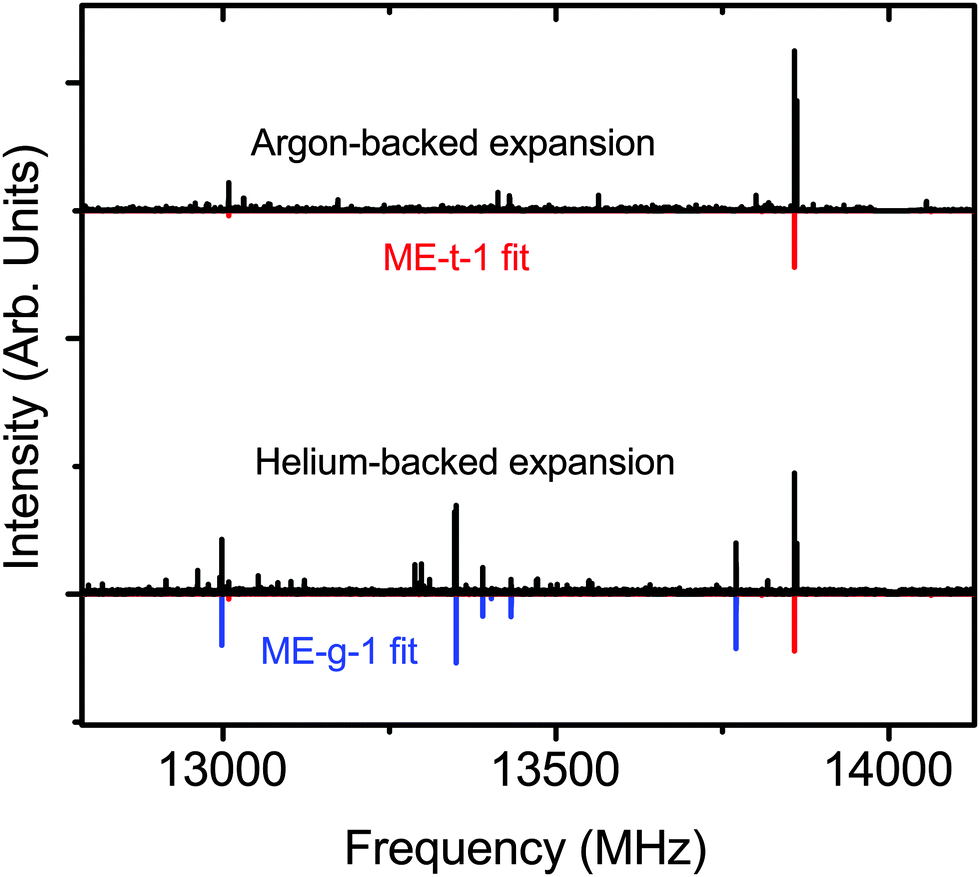 | ||
| Fig. 5 The experimental helium- and argon-backed spectra of the ethanol/water dimer. The ME-t-1 conformer is seen in both expansion conditions while the higher energy ME-g-1 conformer is only seen in the helium expansion. Predicted spectra are rendered at 2 K. | ||
Many of the peaks in the experimental spectra of ME-g-1 and ME-t-1 are split by several MHz in a doublet pattern. In our analysis, only one peak of every doublet was fit to the effective rigid-rotor Hamiltonian, while the companion peaks could not be fit to this model. As isolated monomers, both ethanol and methanol exhibit a spectral splitting due to hindered internal rotation of their methyl rotors that leads to a doublet A–E splitting pattern, where A and E are methyl torsional state symmetry labels. The three-fold barrier to internal rotation of the methyl group, V3, is smaller in methanol (373 cm−1) than ethanol (1166 cm−1 for trans, 1331 cm−1 for gauche), leading to a much larger A–E splitting.28–30 The spectrum of gauche-ethanol is further split by the tunneling of the hydroxyl hydrogen between equivalent positions, although this motion should be quenched in the ethanol–methanol dimer by the position of the methanol. Thus, we hypothesize that the splitting in the ethanol–methanol spectrum is due to internal rotation of the methyl group of methanol.
In other methanol clusters, methyl rotor tunneling splittings have also been reported, including the methanol homodimer,31 methanol–water,5 methanol–formamide,32 methanol–argon,33 methanol–CO,34 methanol–phenol,35 and methanol–sulfur dioxide.36 Compared to the isolated monomer, all of these methanol clusters have shown decreases in the fit barrier to internal rotation of ∼20–80%. In 1994, Fraser et al. noted that this drop in the fit barrier is likely unphysical, and instead due to coupling between the methyl internal rotation and large amplitude motion of the entire methanol subunit.37 To model rotational spectra, the angle of the methyl rotor in the PAS can be fit along with the barrier to internal rotation and the moment of inertia of the methyl group, Iα. For typical organic molecules, Iα is near 3.1–3.2 μÅ2. Fraser et al. note that in a dimer with methanol rigidly bound to its partner, or the strong interacting limit, the fit Iα should be close to that of a methyl group and the fit V3 value will be physical. However, as the cluster becomes more ‘floppy’, the methanol large amplitude motion will couple to the methyl rotation, increasing the effective Iα and decreasing the fit V3 in relation to its actual value. This is maximized in the weakly interacting limit, with free rotation of the methanol subunit in relation to its dimer partner. For a rigorous treatment of a ‘floppy’ methanol dimer, a more complex Hamiltonian with Coriolis terms must be used,37 which is beyond the scope of this work. Therefore, we will only consider a standard internal rotor model of the splitting, with an explicit awareness of its shortcomings.
To model the internal rotor splitting in the ethanol–methanol dimer, we used the internal axis method Hamiltonian with the XIAM program.20 Fits of the four isotopologues of the ME-t-1 conformer are shown in Fig. 6 and Table 4; the signal-to-noise in the helium expansion was insufficient to fit the splitting of the ME-g-1 conformer. In these fits, δ corresponds to the angle between the methyl group, or O–C bond of methanol, and the a-inertial axis, and ε to the angle between the c-axis and the methyl projection onto the bc-plane. The normal species fit values of δ = 59.9°, ε = 34.6° are quite close to the ab initio predictions of δ = 60.3°, ε = 30.2°, confirming the orientation of methanol in the ME-t-1 conformer. We also note evidence of large amplitude motions of methanol, with the high value of Iα = 3.38 μÅ2, as compared to the 3.2 μÅ2 expected of a methyl group. Further evidence of this motion is seen in the greatly reduced V3 = 190 cm−1, as compared to the experimental monomer value of 373 cm−1. The ab initio barrier, V3 = 257 cm−1, is also much higher than the fit barrier. Thus, the fit V3 is likely not physical, but an indicator of the flexibility of the hydrogen bond between methanol and ethanol.
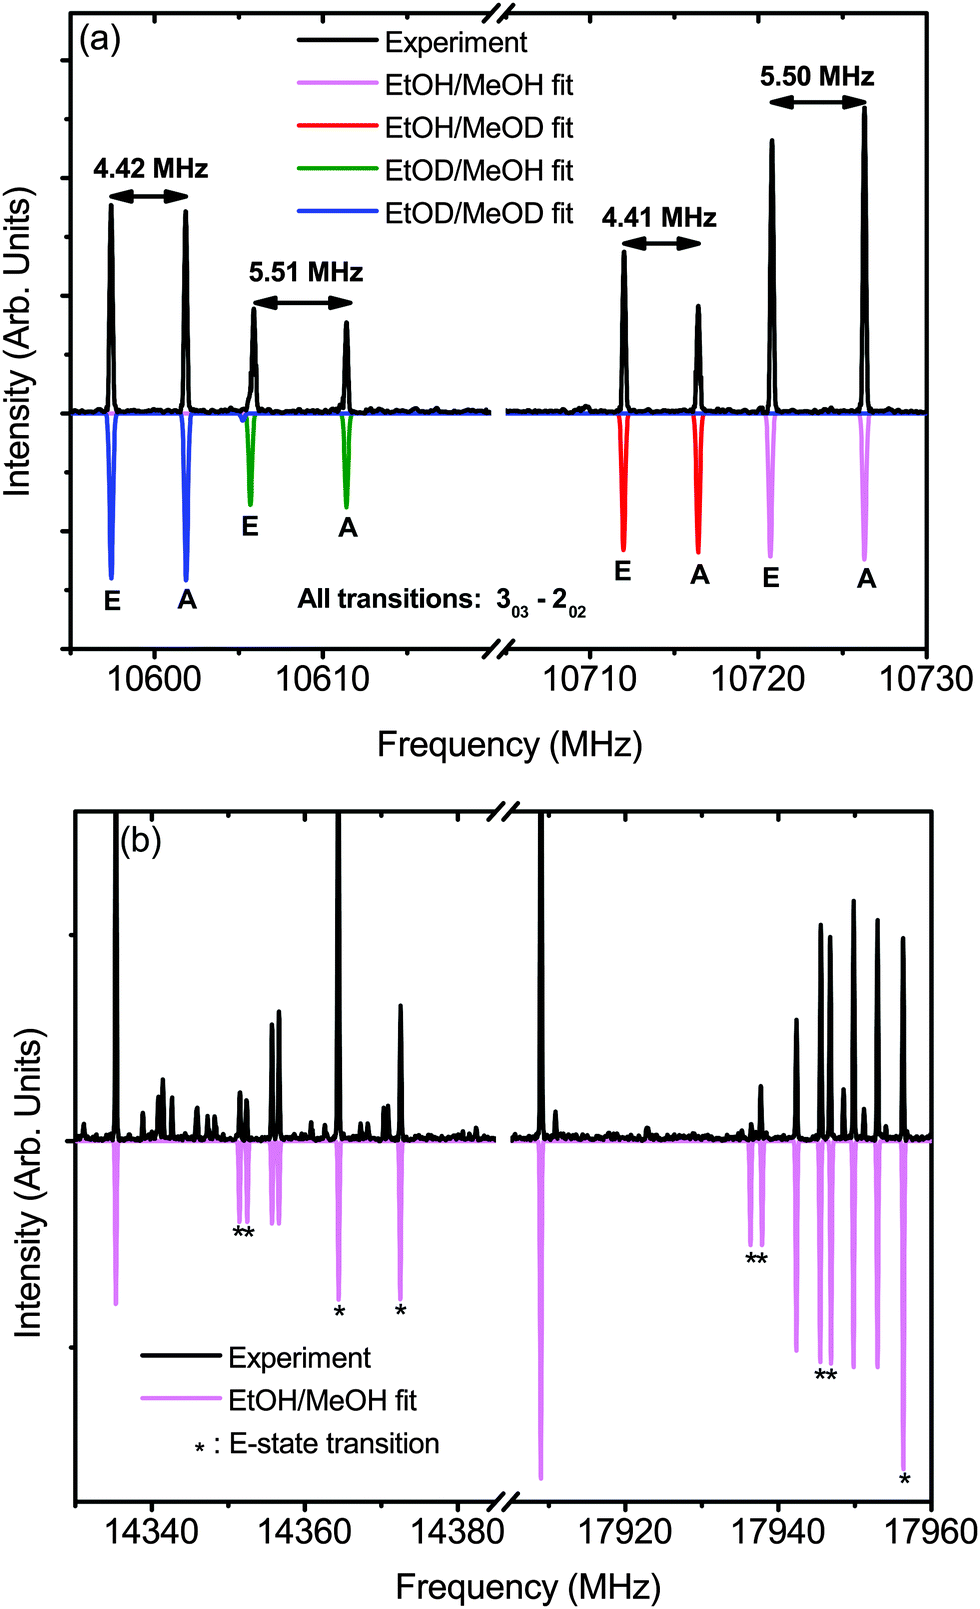 | ||
| Fig. 6 A preliminary fit of the tunneling splitting in ME-t-1. (a) A comparison of the peak splittings of the 303–202 transition of four isotopologues of the dimer. The experimental spectrum was measured in a deuterium enriched sample in Ar. The predicted spectra are from XIAM at 10 K, the lowest prediction temperature available in the program. (b) Other portions of the normal species fit of ME-t-1, with E-state transitions labeled with an asterisk (*). Experimental data is from a non-deuterated sample in Ar. Again, predictions are rendered at 10 K. | ||
| EtOH/MeOH | EtOD/MeOH | EtOH/MeOD | EtOD/MeOD | Ab initio | |
|---|---|---|---|---|---|
| A/MHz | 7274.75(4) | 6907.(1) | 7231.6(9) | 6870.4(8) | 7195 |
| B/MHz | 1909.610(5) | 1899.947(9) | 1908.279(5) | 1898.559(5) | 1959 |
| C/MHz | 1675.236(5) | 1648.870(8) | 1673.510(5) | 1647.290(5) | 1713 |
| DJ/kHz | 4.71(3) | * | * | * | 3.7 |
| DJK/kHz | −1.6(1) | * | * | * | 1.7 |
| DK/kHz | 38.(3) | * | * | * | 14.3 |
| d1/kHz | 0.81(1) | * | * | * | −0.6 |
| d2/kHz | −0.014(6) | * | * | * | −0.04 |
| V 3/cm−1 | 190(1) | 190.0(1) | 200.0(1) | 199.6(1) | 257 |
| ε/° | 34.6(4) | 33.8(5) | 33.9(4) | 33.4(4) | 30.2 |
| δ/° | 59.9(1) | 59.5(1) | 59.7(1) | 59.4(1) | 60.3 |
| I α/μÅ2 | 3.38(2) | * | * | * | |
| N | 67 | 32 | 31 | 31 | |
| RMS/kHz | 32 | 58 | 40 | 44 |
In the fit parameters of the deuterated species of ME-t-1 we see further complexity arising from the donor/acceptor large amplitude motion. The species with a deuterated methanol and hence a deuterium bond, EtOH/MeOD and EtOD/MeOD, have a fit barrier of V3 ∼ 200 cm−1, while the fit barrier of the hydrogen-bonded species EtOD/MeOH and EtOH/MeOH is V3 ∼ 190 cm−1. Equivalently, this difference can be seen in the A–E splitting of the spectrum. In the 303–202 transition, for example, (Fig. 6(a)) the deuterium bonded dimers have a splitting of ∼4.4 MHz, while the hydrogen-bonded dimers are split by ∼5.5 MHz. Possible causes for this splitting difference could be an increase in the V3 barrier of the methanol subunit when it is deuterated, or the Ubbelohde effect – a shortening of the hydrogen bond upon deuterium substitution. For the Ubbelohde effect, the increased rigidity of the deuterium-bonded dimer would reduce the A–E splitting. In contrast, if this change was caused by the methanol alone, we would expect to see an increase in splitting for the deuterium bonded species, as the barrier for the MeOD monomer (366 cm−1),38 is lower than the MeOH barrier (373 cm−1).28 Thus, we posit that the measured trend is due to the Ubbelohde effect, as it is inconsistent with a change in the methanol monomer barrier.
In the raw mixed ethanol–methanol spectrum (Fig. 2(a)), strong transitions from the ethanol and methanol monomers28,29 and homodimers31,39 are present as well as the methanol–argon dimer.40 For the ethanol dimer, we have confirmed that the G2G(O) conformer is the ground state, using transition frequencies from Hearn et al., 2005.39 In the helium-backed expansion all previously measured conformers are present, while cooling to the G2G(O) conformer is observed in an argon-backed expansion (see ESI,† Fig. S1).
5 Conclusions
Two conformers of the ethanol/methanol heterodimer have been measured and assigned to methanol-donor/ethanol-acceptor configurations. In the lower energy structure ethanol is in the trans conformation, while it resides in the gauche conformation for the higher energy species. This is different than the ethanol dimer and ethanol/water dimer, both of which show an energetic preference for the gauche conformation (Fig. 5).4,5No ethanol-donor/methanol-acceptor conformers have been identified in the experimental data. In particular, all seven calculated conformers of the dimer have strong predicted a-type transitions in the 8–18 GHz region measured in this work, yet we could not find any EM structures with an exhaustive automated search. This strongly indicates that the measured ME-t-1 conformer is the ground state.
The A–E splitting arising from the hindered internal rotation of the methyl group of methanol was fit for the four isotopologues of the ME-t-1 conformer. The fit constants indicate that there is a significant coupling between the methyl internal rotation and a donor/acceptor large amplitude motion. This motion is more pronounced in the hydrogen-bonded species than the deuterium-bonded species, which likely arises from the Ubbelohde effect.
Acknowledgements
The authors gratefully acknowledge the National Science Foundation (Grant No. CHE-1214123 and the Graduate Research Fellowship Program) for financial support.References
- G. D. Rose and R. Wolfenden, Annu. Rev. Biophys. Biomol. Struct., 1993, 22, 381–415 CrossRef CAS PubMed.
- G. R. Desiraju and T. Steiner, The weak hydrogen bond: in structural chemistry and biology, Oxford University Press on Demand, 2001, vol. 9 Search PubMed.
- M. A. Suhm, Adv. Chem. Phys., 2009, 142, 1 CrossRef CAS.
- I. A. Finneran, P. B. Carroll, M. A. Allodi and G. A. Blake, Phys. Chem. Chem. Phys., 2015, 17, 24210–24214 RSC.
- P. A. Stockman, G. A. Blake, F. J. Lovas and R. D. Suenram, J. Chem. Phys., 1997, 107, 3782–3790 CrossRef CAS.
- L. Evangelisti and W. Caminati, Phys. Chem. Chem. Phys., 2010, 12, 14433–14441 RSC.
- M. Nedić, T. N. Wassermann, Z. Xue, P. Zielke and M. A. Suhm, Phys. Chem. Chem. Phys., 2008, 10, 5953–5956 RSC.
- E. E. Fileti, P. Chaudhuri and S. Canuto, Chem. Phys. Lett., 2004, 400, 494–499 CrossRef CAS.
- G. G. Brown, B. C. Dian, K. O. Douglass, S. M. Geyer, S. T. Shipman and B. H. Pate, Rev. Sci. Instrum., 2008, 79, 053103 CrossRef PubMed.
- R. Ruoff, T. Klots, T. Emilsson and H. Gutowsky, J. Chem. Phys., 1990, 93, 3142–3150 CrossRef CAS.
- C. Pérez, M. T. Muckle, D. P. Zaleski, N. A. Seifert, B. Temelso, G. C. Shields, Z. Kisiel and B. H. Pate, Science, 2012, 336, 897–901 CrossRef PubMed.
- I. A. Finneran, D. B. Holland, P. B. Carroll and G. A. Blake, Rev. Sci. Instrum., 2013, 84, 083104 CrossRef PubMed.
- M. J. Frisch, G. W. Trucks, H. B. Schlegel, G. E. Scuseria, M. A. Robb, J. R. Cheeseman, G. Scalmani, V. Barone, B. Mennucci, G. A. Petersson, H. Nakatsuji, M. Caricato, X. Li, H. P. Hratchian, A. F. Izmaylov, J. Bloino, G. Zheng, J. L. Sonnenberg, M. Hada, M. Ehara, K. Toyota, R. Fukuda, J. Hasegawa, M. Ishida, T. Nakajima, Y. Honda, O. Kitao, H. Nakai, T. Vreven, J. A. Montgomery, Jr., J. E. Peralta, F. Ogliaro, M. Bearpark, J. J. Heyd, E. Brothers, K. N. Kudin, V. N. Staroverov, R. Kobayashi, J. Normand, K. Raghavachari, A. Rendell, J. C. Burant, S. S. Iyengar, J. Tomasi, M. Cossi, N. Rega, J. M. Millam, M. Klene, J. E. Knox, J. B. Cross, V. Bakken, C. Adamo, J. Jaramillo, R. Gomperts, R. E. Stratmann, O. Yazyev, A. J. Austin, R. Cammi, C. Pomelli, J. W. Ochterski, R. L. Martin, K. Morokuma, V. G. Zakrzewski, G. A. Voth, P. Salvador, J. J. Dannenberg, S. Dapprich, A. D. Daniels, Ö. Farkas, J. B. Foresman, J. V. Ortiz, J. Cioslowski and D. J. Fox, Gaussian 09 Revision D.01, Gaussian Inc., Wallingford CT, 2009 Search PubMed.
- C. Møller and M. S. Plesset, Phys. Rev., 1934, 46, 618 CrossRef.
- T. H. Dunning Jr, J. Chem. Phys., 1989, 90, 1007–1023 CrossRef.
- R. A. Kendall, T. H. Dunning Jr and R. J. Harrison, J. Chem. Phys., 1992, 96, 6796–6806 CrossRef CAS.
- J. A. Pople, M. Head-Gordon and K. Raghavachari, J. Chem. Phys., 1987, 87, 5968–5975 CrossRef CAS.
- V. Barone, J. Chem. Phys., 2005, 122, 014108 CrossRef PubMed.
- H. M. Pickett, J. Mol. Spectrosc., 1991, 148, 371–377 CrossRef CAS.
- H. Hartwig and H. Dreizler, Z. Naturforsch., A: Phys. Sci., 1996, 51, 923–932 CAS.
- N. A. Seifert, I. A. Finneran, C. Perez, D. P. Zaleski, J. L. Neill, A. L. Steber, R. D. Suenram, A. Lesarri, S. T. Shipman and B. H. Pate, J. Mol. Spectrosc., 2015, 312, 13–21 CrossRef CAS.
- Z. Kisiel, Spectroscopy from Space, Springer, 2001, pp. 91–106 Search PubMed.
- J. Kraitchman, Am. J. Phys., 1953, 21, 17–24 CrossRef CAS.
- A. Ubbelohde and K. Gallagher, Acta Crystallogr., 1955, 8, 71–83 CrossRef CAS.
- Q. Gou, G. Feng, L. Evangelisti, D. Loru, J. L. Alonso, J. C. López and W. Caminati, J. Phys. Chem. A, 2013, 117, 13531–13534 CrossRef CAS PubMed.
- S. Tang, I. Majerz and W. Caminati, Phys. Chem. Chem. Phys., 2011, 13, 9137–9139 RSC.
- L. Pierce, J. Mol. Spectrosc., 1959, 3, 575–580 CrossRef CAS.
- R. Lees, F. Lovas, W. Kirchhoff and D. Johnson, J. Phys. Chem. Ref. Data, 1973, 2, 205–214 CrossRef CAS.
- F. Lovas, J. Phys. Chem. Ref. Data, 1982, 11, 251–312 CrossRef CAS.
- R. K. Kakar and C. R. Quade, J. Chem. Phys., 1980, 72, 4300–4307 CrossRef CAS.
- F. Lovas and H. Hartwig, J. Mol. Spectrosc., 1997, 185, 98–109 CrossRef CAS PubMed.
- F. Lovas, R. Suenram, G. Fraser, C. Gillies and J. Zozom, J. Chem. Phys., 1988, 88, 722–729 CrossRef CAS.
- X.-Q. Tan, L. Sun and R. L. Kuczkowski, J. Mol. Spectrosc., 1995, 171, 248–264 CrossRef CAS.
- F. Lovas, S. Belov, M. Y. Tretyakov, J. Ortigoso and R. Suenram, J. Mol. Spectrosc., 1994, 167, 191–204 CrossRef CAS.
- M. Schmitt, J. Küpper, D. Spangenberg and A. Westphal, Chem. Phys., 2000, 254, 349–361 CrossRef CAS.
- L. Sun, X.-Q. Tan, J. J. Oh and R. L. Kuczkowski, J. Chem. Phys., 1995, 103, 6440–6449 CrossRef CAS.
- G. Fraser, F. Lovas and R. Suenram, J. Mol. Spectrosc., 1994, 167, 231–235 CrossRef CAS.
- V. Kaushik, K. Takagi and C. Matsumura, J. Mol. Spectrosc., 1980, 82, 418–426 CrossRef CAS.
- J. P. I. Hearn, R. V. Cobley and B. J. Howard, J. Chem. Phys., 2005, 123, 134324 CrossRef PubMed.
- R. Suenram, F. Lovas, G. Fraser, J. Gillies, C. Gillies and M. Onda, J. Mol. Spectrosc., 1989, 137, 127–137 CrossRef CAS.
Footnote |
| † Electronic supplementary information (ESI) available. See DOI: 10.1039/c6cp03980d |
| This journal is © the Owner Societies 2016 |