 Open Access Article
Creative Commons Attribution 3.0 Unported Licence
DFT global optimisation of gas-phase and MgO-supported sub-nanometre AuPd clusters†
Heider A.
Hussein
ab,
Jack B. A.
Davis
a and
Roy L.
Johnston
*a
aSchool of Chemistry, University of Birmingham, Birmingham, B15 2TT, UK. E-mail: r.l.johnston@bham.ac.uk; Tel: +44 (0)1214 147477
bDepartment of Chemistry, College of Science, University of Kufa, Najaf, Iraq
First published on 12th September 2016
Abstract
The Birmingham Parallel Genetic Algorithm (BPGA) has been adopted for the global optimization of free and MgO(100)-supported Pd, Au and AuPd nanocluster structures, over the size range N = 4–10. Structures were evaluated directly using density functional theory, which has allowed the identification of Pd, Au and AuPd global minima. The energetics, structures, and tendency of segregation have been evaluated by different stability criteria such as binding energy, excess energy, second difference in energy, and adsorption energy. The ability of the approach in searching for putative global minimum has been assessed against a systematic homotop search method, which shows a high degree of success.
1 Introduction
Nanomaterials have at least one dimension on the nanometer scale (1–100 nm). They have recently emerged as new materials that bridge the gap between atoms or molecules and bulk materials, and they have attracted remarkable interest owing to their numerous potential applications.1 Nanomaterials contribute to many new technological applications in various fields, such as medicine, materials, physics, and chemistry. These new applications came as a consequence of their novel chemical and physical properties which are due to electronic and quantum effects and the high surface-area-to-volume ratio.1–3The ability to control the surface and structural properties of nanostructures in the nanometre range and their suitable integration with different scientific research concepts have attracted widespread interest from researchers because of their use in many emerging technological applications.4–7 AuPd nanostructures, in particular, have been investigated previously for a number of applications, including catalytic applications. AuPd catalysts have been found to be promising candidates for a wide variety of chemical reactions, such as cyclohexane oxidation,8 NO reduction,9 CO oxidation,10,11 direct synthesis of hydrogen peroxide,12,13 and synthesis of aldehydes from primary alcohols.14
Theoretically, AuPd systems have been studied to rationalize their catalytic activities. Studies have been conducted on some of the AuPd clusters in the gas phase15 and supported on surfaces (e.g. MgO(100) and TiO2(110) slabs)16–18 in addition to the simulation of the interaction of pure Au and Pd nanoparticles and AuPd nanoparticles with atoms or small molecules such as S, H, NO, and CO.9,10,19,20 However to date there have been few studies of small AuPd clusters supported on MgO. Subnanometre clusters are groups or aggregates of a few to tens of metal atoms which are (<1.0 nm) in size. These smaller clusters are of interest in catalysis due to the potential for enhanced activity and selectivity.
The rarity of theoretical studies concerned with N = 4–10 AuPd nanoalloys, whether in the gas phase or supported on MgO, has led us to select the Au–Pd system to be studied. In order to find the global minima for the pure and mixed AuPd clusters in the gas phase and on MgO, we have used the Birmingham Parallel Genetic Algorithm (BPGA) to enable global optimisation directly at the DFT level.21
2 Methodology
2.1 BPGA-DFT
The BPGA-DFT approach was applied for cluster sizes ranging from N = 4–10 for all compositions of free and MgO(100)-supported AuPd nanoalloys, as well as the pure Au and Pd clusters. Gamma-point DFT calculations were performed with the Vienna ab initio Simulation Package (VASP) code22 utilising projected-augmented wave (PAW) pseudopotentials and the PBE exchange correlation functional.23,24 A plane-wave basis set was used. The energy was truncated at 400 eV. Methfessel–Paxton smearing, with a sigma value of 0.01 eV, was implemented to improve convergence.25The Birmingham Parallel Genetic Algorithm (BPGA) has been adopted for the evaluation of potential cluster structures. This method is the latest open-source genetic algorithm26 improving on the Birmingham Cluster Genetic Algorithm (BCGA), a genetic algorithm for determining the lowest energy isomers of nanoparticles and nanoalloys up to approximately 100 atoms.27
BPGA employs a pool methodology to evaluate structures in parallel. In each run, multiple BPGA instances are implemented, and in each instance, a set of processes are run in parallel and independently.15,28 Numerous random geometries are initially generated to form a population.21 The generated structures of a given population are then geometrically relaxed (local energy minimized).15 Once the local minimization of the initial pool structures is completed, crossover and mutation are conducted on the lowest energy individuals in the population.
Clusters are selected for crossover using tournament selection with crossover being performed using the cut-and-splice method introduced by Deaven and Ho.29 The mutation operators are set as a homotop-swap for nanoalloys and a random atom displacement for the pure clusters. The energy of any newly created structure is compared with those of the other structures in the pool. The highest-energy isomer is replaced with the new lower energy isomer.
For the supported clusters, owing to the high computational cost of MgO(100) slab relaxation, the slab is not relaxed during the local minimization, but the cluster geometries are optimised in the presence of the fixed slab. The supported cluster is optimised within a sphere placed at 1.5 Å over a 6 × 6 × 2 slab of MgO(100) with a 14.7 Å vacuum spacing (as shown in Fig. 1), to ensure that there are no cluster–cluster or other non-physical interactions arising due to the periodic boundary conditions. The interactions between the cluster and the surface have been replicated using two layers of MgO(100).17,30–32 The efficacy of replicating a surface behaviour and the cluster properties by using two layers of the MgO slab has previously been confirmed.33,34 Random rotation of the cluster regarding the fixed surface is used as a mutation operator when optimising the supported clusters.
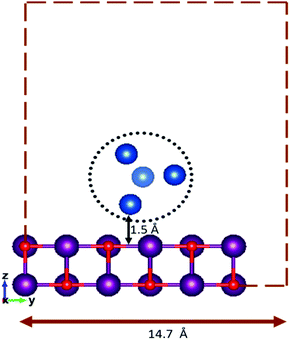 | ||
| Fig. 1 Fixed height and vacuum spacing for an initial random geometry of the surface-supported cluster. | ||
2.2 Energy calculations
The average binding energy per atom Eb is given by | (1) |
The stability of each cluster, relative to its neighbours, is indicated by the second difference in energy Δ2E which is given by
| Δ2E = E(A(N+1)) + E(A(N−1)) − 2E(AN) | (2) |
Evaluation of the effect of mixing in binary nanoalloys has been achieved by calculating the excess energy Δ which is given by
| Δ = NE(AumPdn) − mE(AuN) − nE(PdN) | (3) |
The adsorption energy, Eads, of the AumPdn cluster on the MgO(100) support was calculated by
| Eads = E(slab+AumPdn) − E(slab) − E(AumPdn) | (4) |
3 Results and discussion
3.1 Global optimisation of free and supported Au, Pd, and AuPd clusters
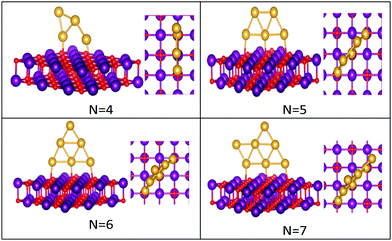 | ||
| Fig. 3 Putative global minimum structures of MgO(100)-supported AuN clusters, N = 4–7. Au, Mg and O are shown in gold, purple, and red, respectively. | ||
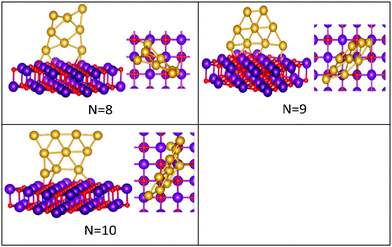 | ||
| Fig. 4 Putative global minimum structures of MgO(100)-supported AuN clusters, N = 8–10. Au, Mg and O are shown in gold, purple, and red, respectively. | ||
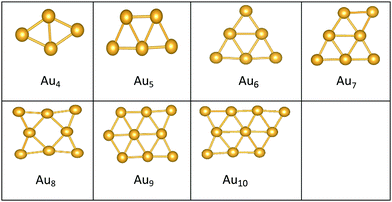
The best structures obtained for all studied free Au clusters in this size range show planar configurations, as previously reported.35–37 Our results satisfactorily concur with those presented by previous theoretical studies on Au clusters up to 10 atoms38–40 and by experimental research on Au cation clusters up to 7 atoms.41 In addition, our results agree with the findings of Zhao and co-workers42 concerning the planar structures of small Au clusters up to 6 atoms. However, some differences are observed for Au7, Au8, and Au9, which are predicted to be 3D by Zhao.42
Global minima for the supported Au clusters are all found to be still planar, with some slight deviation from the planarity for Au9 and Au10. They are found to lie roughly perpendicular to the MgO surface, due to the “metal-on-top” effect.32 Bonding of two atoms of Au to O atoms has led to an increase in the Au–Au distance from (2.68) to (3.76) Å, forming an elongated Au4 cluster on the surface.43N = (5–8) Au clusters on the surface have similar structures to that in the gas phase, whereas Au9 adopts a different pseudo-planar configuration and Au10 keeps the gas phase structure but with a bend in one of its edges.
The preference for Au clusters with planar structures may be attributed to the non-additive many-body interactions in comparison with the additive two-body forces in Au atoms,44 and the involvement of the d electrons of Au in bonding in planar structures is higher than in 3D ones.39 Some researchers have considered “relativistic effects”45 in interpreting the preference for planar structures, attributing such a preference to the decrease in the 5d–6s orbital spacing that strengthens s–d hybridization.46
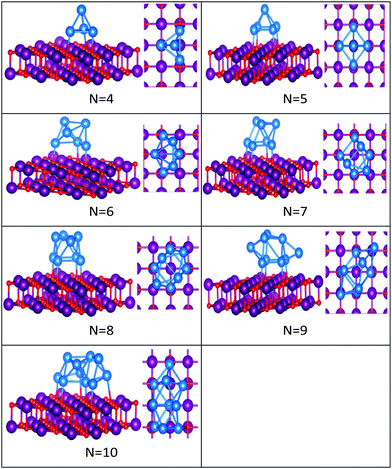 | ||
| Fig. 6 Putative global minimum structures of MgO(100)-supported PdN clusters, N = 4–10. Pd, Mg and O are shown in blue, purple, and red, respectively. | ||
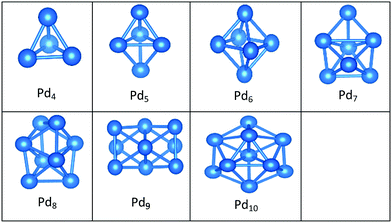
In contrast to Au clusters, Pd clusters do not adopt 2D structures; instead, they all have 3D motifs that mostly favour deltahedral (triangular faced) compact structures as lowest-energy configurations. Global minima for the gas phase Pd clusters are all found to be different from their supported structures with the exception of Pd4 which remains a tetrahedron.
Landman et al.47 investigated the structural properties of neutral PdN isomers with N = 1–7 using DFT. These researchers clarified that the global minima are 3D for clusters with more than 3 atoms, which is in full agreement with the gas-phase Pd clusters for sizes 4 ≤ N ≤ 7 reported here. Thus, the global minimum of free Pd5 is the trigonal bipyramid. On the surface this structure distorts to give a square-based pyramidal structure. The four Pd atoms of the square base are bonded to four different O atoms of the slab. The octahedral structure of free Pd6 alters to form a bicapped tetrahedron on the surface, forming three Pd–O bonds.
We have previously presented BCGA-DFT studies of free Pd8, Pd9, and Pd10 clusters,16,48 whose putative global minima were identified as a dodecahedron, an icosahedral fragment, and an incomplete centered icosahedron, respectively. These observations conform to our findings for free clusters. Our supported structures of Pd7, Pd8, and Pd9 are a capped trigonal prism, a distorted square antiprism, and a distorted tricapped octahedron, respectively. The structure of Pd10 is an icosahedral fragment in the gas-phase. On the surface this global minimum distorts to give a more complex fused structure.
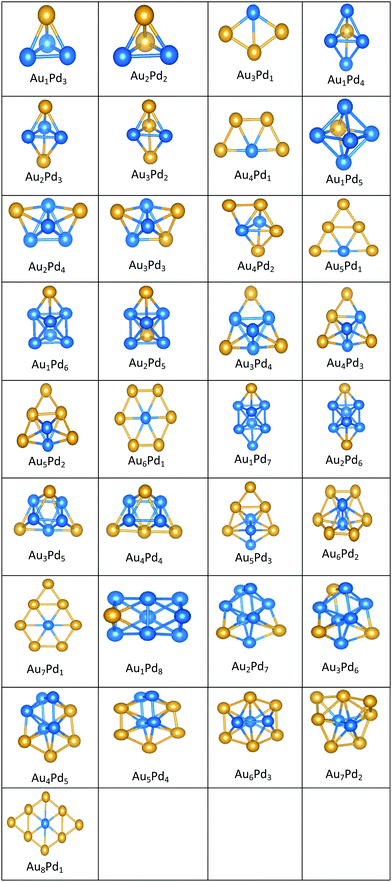 | ||
| Fig. 7 Putative global minimum structures for all compositions of free AuPd nanoalloys with sizes N = 4–9, Au and Pd are shown in gold and blue, respectively. | ||
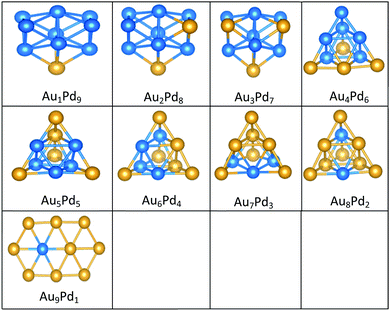 | ||
| Fig. 8 Putative global minimum structures for all compositions of free AuPd nanoalloys with size N = 10, Au and Pd are shown in gold and blue, respectively. | ||
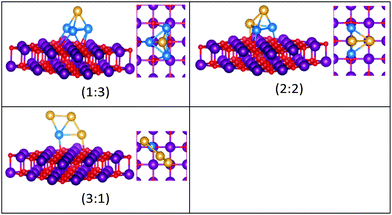 | ||
| Fig. 9 Putative global minimum structures for compositions of MgO(100)-supported AuPd nanoalloys with size N = 4. Au, Pd, Mg and O are shown in gold, blue, purple, and red, respectively. | ||
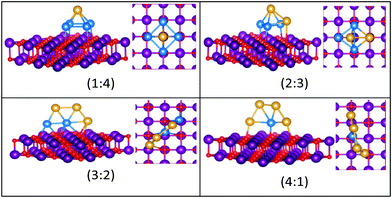 | ||
| Fig. 10 Putative global minimum structures for compositions of MgO(100)-supported AuPd nanoalloys with size N = 5. Au, Pd, Mg and O are shown in gold, blue, purple, and red, respectively. | ||
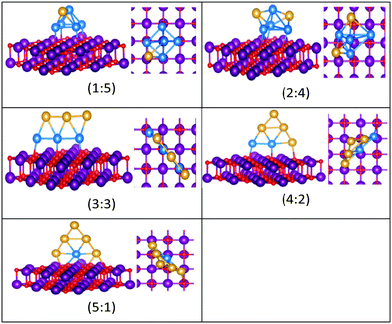 | ||
| Fig. 11 Putative global minimum structures for compositions of MgO(100)-supported AuPd nanoalloys with size N = 6. Au, Pd, Mg and O are shown in gold, blue, purple, and red, respectively. | ||
 | ||
| Fig. 12 Putative global minimum (left) versus local minimum (right) for the MgO(100)-supported Au3Pd3 cluster. Pd, Au, Mg and O are shown in blue, gold, purple, and red, respectively. | ||
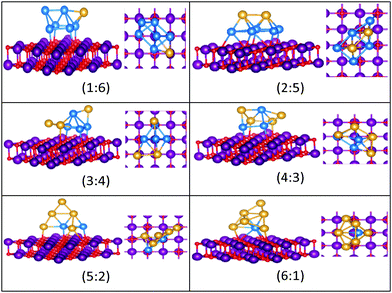 | ||
| Fig. 13 Putative global minimum structures for compositions of MgO(100)-supported AuPd nanoalloys with size N = 7. Au, Pd, Mg and O are shown in gold, blue, purple, and red, respectively. | ||
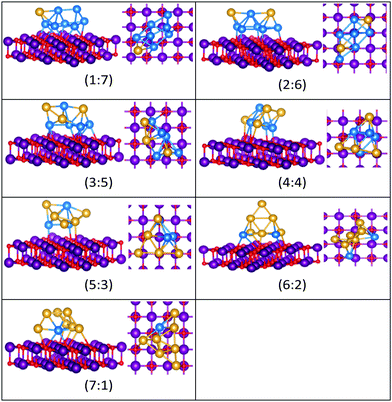 | ||
| Fig. 14 Putative global minimum structures for compositions of MgO(100)-supported AuPd nanoalloys with size N = 8. Au, Pd, Mg and O are shown in gold, blue, purple, and red, respectively. | ||
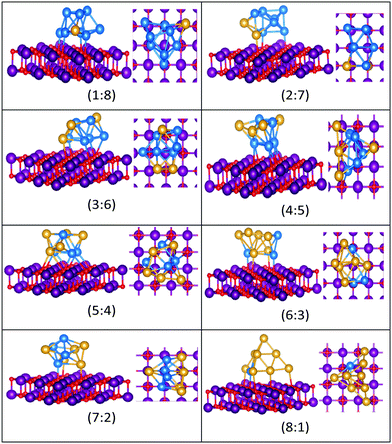 | ||
| Fig. 15 Putative global minimum structures for compositions of MgO(100)-supported AuPd nanoalloys with size N = 9. Au, Pd, Mg and O are shown in gold, blue, purple, and red, respectively. | ||
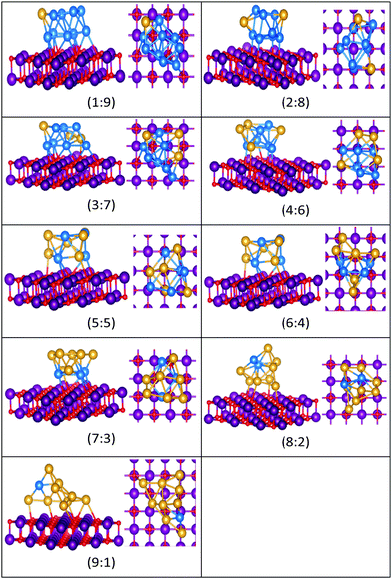 | ||
| Fig. 16 Putative global minimum structures for compositions of MgO(100)-supported AuPd nanoalloys with size N = 10. Au, Pd, Mg and O are shown in gold, blue, purple, and red, respectively. | ||
All the favoured structures of Au1Pdnn = 3–9 compositions are 3D. For N = 4–7 and N = 9, doping one Au atom into the pure Pd clusters yields geometries which are similar to the pure Pd clusters, as previously reported.35,50 Au1Pdnn = 7 and 9 are a bicapped octahedron and a capped face-sharing octahedron, respectively. The Au atom occupies a low-connectivity vertex or an edge position, as previously reported for larger clusters.51 On the surface, Au1Pdn structures are all found to be different from their gas-phase counterparts, with the exception of Au1Pd3, which remains a tetrahedron.
The 2D structures of Au clusters, discussed in Section (3.1.1), remain the global minima when they are doped with a single Pd atom. The Pd atoms are located in or close to the centre of the clusters. AumPd1m = 3–5 clusters have the same structures as the corresponding pure Au clusters, as previously reported.35,50 AumPd1m = 6 adopts a Pd-centred planar hexagon which is also the core of the clusters with 7 and 8 Au atoms. The cluster for m = 9 also has a planar global minimum. 2D–3D structural transitions take place at sizes N = 7–10 on the surface.
It is clear that Pd-rich nanoalloys tend to adopt 3D geometries while 2D–3D structural transitions occur for gold clusters when adding more than one Pd atom. It is worthwhile mentioning that most of the lowest energy structures of free AumPdn clusters for (n + m) = 4–10, which were calculated recently by Zanti and Peeters35 and Palagin and Doye,50 are in good agreement with our observations.
The supported and gas-phase structures of Au1Pd3 and Au2Pd2 are both tetrahedra. For Au3Pd1, the supported structure is similar to that of the free cluster, both having a planar rhombic structure. For all compositions of size N = 4, the lowest energy conformation for the supported cluster maximises the number of the stronger Pd–O interactions.
The gas-phase global minima for Au1Pd4, Au2Pd3 and Au3Pd2 are all trigonal bipyramid structures, whereas Au4Pd1 is planar. For Au1Pd4, the supported structure is similar to that of supported Pd5 (discussed above), having a square-based pyramid structure. For Au2Pd3, the supported cluster is a distorted homotop of the gas phase structure, which allows all 3 Pd atoms to bind to the surface. A structural transition occurs for the gas-phase Au3Pd2 cluster from 3D to 2D when supported on the surface, having a similar structure to the supported Au4Pd1 structure.
The gas-phase Au1Pd5 structure is an octahedron and Au2Pd4 and Au3Pd3 are both tetrahedra whereas Au4Pd2 and Au5Pd1 are an edge-bridged-capped trigonal bipyramid and planar triangle, respectively. Structural changes occur for all of these global minima on the surface except for Au5Pd1. The interactions between Au and Pd atoms and the MgO(100) surface favours face-capped square-based pyramid and face-capped trigonal bipyramid structures for supported Au1Pd5 and Au2Pd4 clusters, respectively. The supported configurations of Au3Pd3, Au4Pd2 and Au5Pd1 are all 2D structures. For Au3Pd3 on the surface, the three Pd atoms form a linear chain bonding to O atoms of the surface, resulting in a planar parallelogram. DFT local minimisation using the VASP code was used to confirm the parallelogram configuration by assessing an alternative planar triangular structure (as previously found for Au3Ir343) for this composition (see Fig. 12). The minimisation showed that the putative GM parallelogram is indeed lower in energy than the triangle for this composition. However, both Au4Pd2 and Au5Pd1 are found to adopt the planar triangular structure on the surface with clear preference for Pd bonding to O atoms on the surface.
A capped octahedron is the global minimum for both Au1Pd6 and Au2Pd5, which distort on the surface to form a bicapped square pyramid and a square pyramid fused with a trigonal bipyramid, respectively, bound to the surface by Pd–O bonds. In the gas phase, the GM for Au3Pd4, Au4Pd3 and Au5Pd2 all have edge-bridged bicapped tetrahedral structures, with the Pd atoms occupying the central tetrahedral core. On MgO, they all form low-symmetry fused structures. Au6Pd1 has a Pd-centred planar hexagonal structure in the gas phase, while on the surface a complex 3D structure is preferred.
Both Au1Pd7 and Au2Pd6 have the same bicapped octahedral structure (with the caps adopting a “para” position) in the gas-phase and both adopt structures similar to Au2Pd5, but with an additional atom capping the square pyramid. The gas-phase Au3Pd5 and Au4Pd4 clusters both have a “meta-” bicapped octahedral structure, but on the MgO surface Au3Pd5 adopts a polytetrahedral geometry, while Au4Pd4 keeps the bicapped octahedral structure, but adopts a different homotop so that 3 of the Pd atoms are in contact with the surface. The edge-bridged pentagonal bipyramid structure of Au5Pd3 distorts to a polytetrahedral structure on the surface. The gas-phase Au6Pd2 cluster is a hexagonal bipyramid and its global minimum on the surface is similar to that of the supported Au5Pd2 structure with an additional face cap. Homotop swap and structural changes occur for the edge-bridged planar hexagon structure, the global minimum of gas-phase Au7Pd1, giving a 3-dimensional bent triangle bonded by the single Pd atom and 4 Au atoms to the O atoms of the MgO slab.
The gas-phase Au1Pd8 global minimum is a face-sharing bioctahedral structure. Au2Pd7–Au5Pd4 have structures that can be described as the result of fusing an octahedron and a trigonal bipyramid, while Au6Pd3 and Au7Pd2 (bicapped pentagonal bipyramid) have structures which are fragments of the centred icosahedron. Au8Pd1 has a planar, bi-edge-bridged centred hexagon. On the MgO surface, complex fused structures are found, mostly consisting of 2-close packed layers of metal atoms, with Pd enrichment closest to the MgO surface.
Doping up to three Au atoms changes the structure of gas-phase Pd10 (discussed earlier) from an icosahedral fragment to two face-sharing octahedra, with a capping atom at the joint. The tetrahedral tetracapped octahedron is the GM for Au4Pd6–Au8Pd2, while Au9Pd1 has a planar, bihexagonal structure. On the MgO(100)-support, bilayer close packed structures predominate, again with the MgO-cluster interface enriched in Pd to maximise Pd–O bonding.
3.2 Energetic analysis
To evaluate the stability of free and supported clusters and predict the structural preferences for magic sizes, we have to calculate the excess energy Δ, the second difference in energy Δ2E, the binding energy Eb, and the adsorption energy Eads, which are defined in eqn (1)–(4). Tables S4 and S5 list the values of these energies for free and surface supported clusters (see the ESI†).Looking at the elemental properties of Au and Pd (shown in Table 1),52 such as surface energy (Esur), cohesive energy (Ecoh), atomic radius (ra), and electronegativity (χ), we can simply predict the type of segregation in AuPd nanoalloys.
| E coh/eV atm−1 | E sur/meV Å−2 | r a/Å | χ | |
|---|---|---|---|---|
| Au | 3.81 | 96.8 | 1.44 | 2.4 |
| Pd | 3.89 | 131 | 1.38 | 2.2 |
The larger values of cohesive energy and surface energy of Pd compared with Au explain the tendency of Pd atoms to occupy the centres and cores of clusters and the preference of Au atoms for surface positions. The atomic radius of Pd is smaller than for Au. This also favours the aggregation of Pd atoms in the cores of clusters, whereas electron transfer between Pd and Au atoms supports the mixing of Au and Pd, but this is a weak effect as the electronegativities of Au and Pd are quite similar.
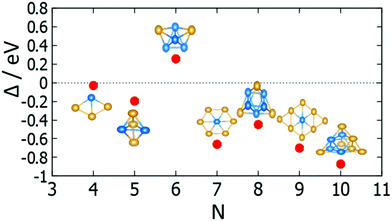
The effect of mixing in a cluster system can be studied by calculating the excess energy, Δ. Excess energy plots for free AuPd clusters (m + n) = 4–10 are shown in Fig. 17 and 18. Favourable mixing is represented by negative values of excess energies Δ, whereas positive values indicate a demixing tendency.
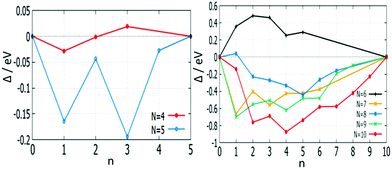 | ||
| Fig. 17 Plot of mixing energy Δ against the number of Pd atoms (n) for free AuPd clusters, with N = 4–10. | ||
For (m + n = 4) clusters, Au1Pd3 shows a strong demixing tendency, whereas Au3Pd1 exhibits the best mixing among clusters of this size. All (m + n = 5) clusters favour mixing and the strongest mixing is for Au2Pd3. However, all mixed (m + n = 6) clusters are energetically unfavourable relative to pure Pd and Au clusters. For (m + n = 7) clusters, all clusters show favourable mixing, with the largest tendency for Au6Pd1. For (m + n = 8) clusters, only Au1Pd7 shows unfavourable mixing and the most favourable mixing is for Au3Pd5. The clusters of (m + n = 9 and 10) favour mixing, with the most favourable mixing being for Au8Pd1 and Au6Pd4.
The mixing energy values for clusters with the same size show that variations in composition play a more important role than geometric effects in determining cluster stabilities.
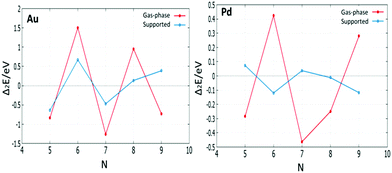
The relative stabilities of clusters can be studied by calculating the second difference in energy Δ2E, which indicates the stability of an N-atom cluster with respect to neighbouring sizes. Fig. 19 shows a plot of the second difference in energy Δ2E for free and supported Au and Pd clusters. The most relatively stable clusters are indicated by significant positive peaks in Δ2E.
The results show that free Au6 (2D) and Pd6 (3D) clusters have a high relative stability compared to their neighbours. Accordingly, N = 6 represents a magic size for both 2D Au and 3D Pd structures. The magic size N = 6 for both free Au and Pd clusters explains the positive values of mixing energy of nanoalloys compared to monometallic clusters at this size. On the MgO surface, Au6 is still found to have the highest relative stability due to it retaining the same triangular structure both when free and supported on MgO. However, Pd clusters show a noticeable (stable) positive peak in Δ2E for the supported cluster with N = 5, rather than 6. This is because the structure of Pd6 changes from an octahedron to a bicapped tetrahedron on the MgO surface, in addition to the cluster–substrate interaction effects mentioned in Section 3.1.2.
The relative stabilities of nanoclusters can be obtained by calculating the binding energy per atom, Eb. A plot of the binding energies for studied clusters is shown in Fig. 20. The binding energy increases with increasing cluster size, as previously reported.35 The plot also illustrates the relative stability of nanoalloys compared to the same size of free Au and Pd clusters, with one exception for N = 6, which reinforces the “magic size” hypothesis mentioned above.
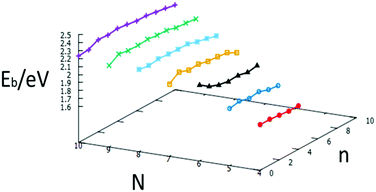 | ||
| Fig. 20 Binding energies for each size N = 4–10 against the number of Pd atoms, n, for free AuN−nPdn clusters. | ||
There are differences between the energies of the Mg(100)-supported global minima and the energies of the supported clusters with the slab removed. Tables S4 and S5 (see the ESI†) list the adsorption energies Eads of the supported clusters and Fig. 21 shows a graphical representation. The plots reveal that the Pd and Pd-rich clusters tend to have the most negative Eads as there are a greater number of strong Pd–O interactions. Comparing the Eads values for the clusters as a function of size is more complicated, however, due to the interplay between structural changes and the number of interfacial Pd atoms; as for smaller clusters a higher proportion of atoms are in contact with the oxide substrate. The higher adsorption energies of Pd-doped Au clusters can contribute to improve catalyst performance by decreasing cluster diffusion rates and, hence, suppressing sintering.
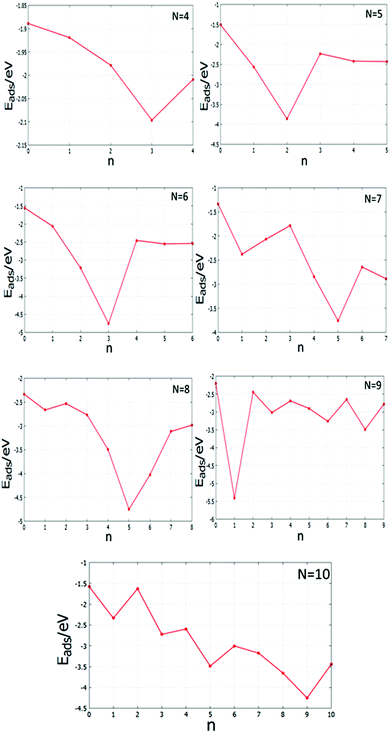 | ||
| Fig. 21 Adsorption energies Eads against the number of Pd atoms, n, for the MgO(100)-supported N = 4–10 clusters. | ||
3.3 Systematic homotop search
The global minima (GM) of AuPd nanoalloys have many symmetry inequivalent homotops which may have been missed by the BPGA-DFT search. Based on the GM of monosubstituted clusters and some supported-clusters, the structural energy for each symmetry inequivalent homotop was studied by DFT local minimisation using the VASP code. Tables S6–S9 (see the ESI†) show energies and structures of homotops for free monosubstituted clusters and some MgO(100)-supported clusters. Fig. 22 and 23 show plots of the relative energy ΔE against symmetry inequivalent homotop structures for these clusters.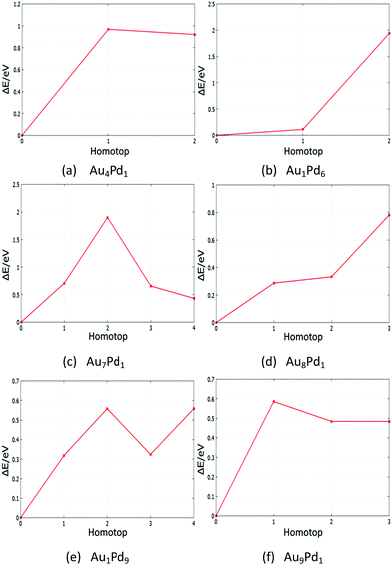 | ||
| Fig. 22 Relative energies for symmetry inequivalent homotop structures of several Au- and Pd-doped clusters. | ||
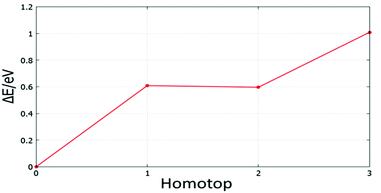 | ||
| Fig. 23 Relative energy for symmetry inequivalent homotop structures of the supported Au5Pd1 cluster. | ||
The BPGA-DFT search for all free monosubstituted clusters N = 4–10, successfully found the lowest energy homotop as the global minimum. For N = 4, Au1Pd3 does not have any symmetry inequivalent homotops whereas Au3Pd1 has one symmetry inequivalent homotop with a relative energy of 0.50 eV. For N = 5, the only symmetry inequivalent homotop for Au1Pd4 is 1.04 eV higher in energy than the GM found by BPGA-DFT. Au4Pd1 has two symmetry inequivalent homotops and both are higher in energy than the GM, by 0.92 and 0.96 eV, as shown in Fig. 22(a).
For N = 6, Au1Pd5 does not have any symmetry inequivalent homotops whereas Au5Pd1 has just one symmetry inequivalent homotop which is 2.86 eV less stable than the GM. For N = 7, Au1Pd6 has two symmetry inequivalent homotops with relative energies of 0.11 eV and 1.93 eV, as shown in Fig. 22(b), whereas Au6Pd1 has one symmetry inequivalent homotop with a relative energy of 0.28 eV. For N = 8, Au1Pd7 has just one symmetry inequivalent homotop with a relative energy of 0.35 eV, whereas Au7Pd1 has four symmetry inequivalent homotops which can clearly be seen in Fig. 22(c). For N = 9, Au1Pd8 also has one symmetry inequivalent homotop with a relative energy of 0.15 eV, whereas Au8Pd1 has three symmetry inequivalent homotops which can be seen in Fig. 22(d). Finally, Fig. 22(e) and (f) shows the relative energies for symmetry inequivalent homotops of Au1Pd9 and Au9Pd1.
The BPGA-DFT search for MgO(100)-supported clusters generally successfully finds the energy homotop as the global minimum. Fig. 23, for example, shows the relative energy for symmetry inequivalent homotop structures of the supported Au5Pd1 cluster.
4 Conclusions
The use of the BPGA-DFT approach has successfully allowed the global optimization of free and MgO(100)-supported N = 4–10 Au, Pd, and AuPd clusters. Significant structural differences between the gas-phase and surface-supported are revealed by global optimization in the presence of a MgO slab in addition to the clear homotop swap behaviour in mixed AuPd clusters, in order to increase the number of stabilising Pd–O bonds. For singly doped clusters, the GM structures were confirmed by homotop reminimisation.The BPGA-DFT calculations show that the Pd and Pd-rich clusters prefer 3D structures, while structural transitions occur for Au configurations from 2D to 3D upon adding more than one Pd atom. The planar structures of free Au global minima are all found to remain planar on the MgO(100) surface, with some deviation from the planarity for supported Au9 and Au10. They are also found to lie roughly perpendicular to the MgO surface, due to the “metal-on-top” effect. Global minima for the gas phase Pd clusters are all found to be different from their supported structures with the exception of Pd4, which retains its tetrahedral structure.
Mixing energies show the strong tendency of free Au–Pd clusters to alloy, with the exception of N = 6, which confirms the magic size hypothesis of pure Pd and Au clusters at this size (confirmed by findings of the binding energy Eb for nanoalloys compared to pure clusters and the second difference in energy Δ2E calculations for pure Au and Pd clusters).
The adsorption energy Eads results reveal that the Pd and Pd-rich clusters tend to have the most negative Eads values. This could improve catalytic performance by suppressing cluster sintering.
Acknowledgements
H. A. Hussein is grateful to the University of Kufa and the Ministry of Higher Education and Scientific Research (Iraq) for the award of a PhD scholarship. Calculations were performed on the University of Birmingham's Blue-BEAR high-performance computer and ARCHER facilities, the UK National Supercomputing Service (http://www.archer.ac.uk) via membership of the UK's HPC Materials Chemistry Consortium, which is funded by EPSRC (EP/L000202), and “TOUCAN: Towards an Understanding of Catalysis on Nanoalloys” membership, which is funded by EPSRC under Critical Mass Grant EP/J010804/1. The authors acknowledge Dr Christopher Heard for helpful discussions. H. A. Hussein thanks Dr Ilker Demiroglu for his valuable advice.References
- G. M. Whitesides, Small, 2005, 1, 172–179 CrossRef CAS PubMed.
- H. Zhang, T. Watanabe, M. Okumura, M. Haruta and N. Toshima, Nat. Mater., 2012, 11, 49–52 CrossRef PubMed.
- R. Bazzi, M. Flores-Gonzalez, C. Louis, K. Lebbou, C. Dujardin, A. Brenier, W. Zhang, O. Tillement, E. Bernstein and P. Perriat, J. Lumin., 2003, 102–103, 445–450 CrossRef CAS.
- M. A. Ferrara, P. Dardano, L. De Stefano, I. Rea, G. Coppola, I. Rendina, R. Congestri, A. Antonucci, M. De Stefano and E. De Tommasi, PLoS One, 2014, 9, e103750 Search PubMed.
- K. Vasundhara, S. N. Achary, S. K. Deshpande, P. D. Babu, S. S. Meena and A. K. Tyagi, J. Appl. Phys., 2013, 113, 194101 CrossRef.
- Y. Li, Q. Liu and W. Shen, Dalton Trans., 2011, 40, 5811 RSC.
- R. Pillarisetty, Nature, 2011, 479, 324–328 CrossRef CAS PubMed.
- X. Liu, M. Conte, M. Sankar, Q. He, D. M. Murphy, D. Morgan, R. L. Jenkins, D. Knight, K. Whiston, C. J. Kiely and G. J. Hutchings, Appl. Catal., A, 2015, 504, 373–380 CrossRef CAS.
- Y. Gao, W. Huang, J. Woodford, L. Wang and X. C. Zeng, J. Am. Chem. Soc., 2009, 131, 9484–9485 CrossRef CAS PubMed.
- D. W. Yuan and Z. R. Liu, Phys. Lett. A, 2011, 375, 2405–2410 CrossRef CAS.
- F. Gao, Y. Wang and D. W. Goodman, J. Phys. Chem. C, 2010, 114, 4036–4043 CAS.
- J. K. Edwards, S. J. Freakley, A. F. Carley, C. J. Kiely and G. J. Hutchings, Acc. Chem. Res., 2014, 47, 845–854 CrossRef CAS PubMed.
- J. K. Edwards, B. Solsona, E. Ntainjua N, A. F. Carley, A. A. Herzing, C. J. Kiely and G. J. Hutchings, Science, 2009, 323, 1037–1042 CrossRef CAS PubMed.
- D. I. Enache, J. K. Edwards, P. Landon, B. Solsona-espriu, A. F. Carley, A. A. Herzing, M. Watanabe, C. J. Kiely, D. W. Knight and G. J. Hutchings, Science, 2006, 311, 362 CrossRef CAS PubMed.
- A. Shayeghi, D. Götz, J. B. A. Davis, R. Schäfer and R. L. Johnston, Phys. Chem. Chem. Phys., 2015, 17, 2104–2112 RSC.
- C. J. Heard, S. Vajda and R. L. Johnston, J. Phys. Chem. C, 2014, 118, 3581–3589 CAS.
- R. Ismail, R. Ferrando and R. L. Johnston, J. Phys. Chem. C, 2013, 117, 293–301 CAS.
- I. Atanasov, G. Barcaro, F. R. Negreiros, A. Fortunelli and R. L. Johnston, J. Chem. Phys., 2013, 138, 224703 CrossRef PubMed.
- L. Gan, R. Tian, X. Yang, S. Peng and Y.-J. Zhao, Phys. Chem. Chem. Phys., 2011, 13, 14466–14475 RSC.
- F. Pittaway, L. O. Paz-borbon, R. L. Johnston, H. Arslan, R. Ferrando, C. Mottet, G. Barcaro and A. Fortunelli, J. Phys. Chem. C, 2009, 113, 9141–9152 CAS.
- J. Davis, A. Shayeghi, S. L. Horswell and R. L. Johnston, Nanoscale, 2015, 7, 14032–14038 RSC.
- G. Kresse and J. Hafner, Phys. Rev. B: Condens. Matter Mater. Phys., 1993, 47, 558–561 CrossRef CAS.
- J. Perdew, K. Burke and Y. Wang, Phys. Rev. B: Condens. Matter Mater. Phys., 1996, 54, 16533–16539 CrossRef CAS.
- G. Kresse, Phys. Rev. B: Condens. Matter Mater. Phys., 1999, 59, 1758–1775 CrossRef CAS.
- M. Methfessel and A. T. Paxton, Phys. Rev. B: Condens. Matter Mater. Phys., 1989, 40, 3616–3621 CrossRef CAS.
- http://https://bitbucket.org/JBADavis/bpga/ .
- R. L. Johnston, Dalton Trans., 2003, 4193–4207 RSC.
- B. Bandow and B. Hartke, J. Phys. Chem. A, 2006, 110, 5809–5822 CrossRef CAS PubMed.
- D. Deaven and K. Ho, Phys. Rev. Lett., 1995, 75, 288–291 CrossRef CAS PubMed.
- H. Grönbeck and P. Broqvist, J. Chem. Phys., 2003, 119, 3896 CrossRef.
- R. Ferrando and A. Fortunelli, J. Phys.: Condens. Matter, 2009, 21, 264001 CrossRef PubMed.
- G. Barcaro and A. Fortunelli, J. Chem. Theory Comput., 2005, 1, 972–985 CrossRef CAS PubMed.
- P. Frondelius, H. Häkkinen and K. Honkala, New J. Phys., 2007, 9, 339 CrossRef.
- P. Frondelius, H. Häkkinen and K. Honkala, Phys. Rev. B: Condens. Matter Mater. Phys., 2007, 76, 1–4 CrossRef.
- G. Zanti and D. Peeters, J. Phys. Chem. A, 2010, 114, 10345–10356 CrossRef CAS PubMed.
- H. Häkkinen, B. Yoon, U. Landman, X. Li, H.-J. Zhai and L.-S. Wang, J. Phys. Chem. A, 2003, 107, 6168–6175 CrossRef.
- B. Assadollahzadeh and P. Schwerdtfeger, J. Chem. Phys., 2009, 131, 064306 CrossRef PubMed.
- A. Walker, J. Chem. Phys., 2005, 122, 094310 CrossRef CAS PubMed.
- V. Bonačić-Koutecký, J. Burda, R. Mitrić, M. Ge, G. Zampella and P. Fantucci, J. Chem. Phys., 2002, 117, 3120 CrossRef.
- D. Alamanova, Y. Dong, H. U. Rehman, M. Springborg and V. G. Grigoryan, Comput. Lett., 2005, 1, 1–12 CrossRef.
- S. Gilb, P. Weis, F. Furche, R. Ahlrichs and M. M. Kappes, J. Chem. Phys., 2002, 116, 4094–4100 CrossRef CAS.
- J. Wang, G. Wang and J. Zhao, Phys. Rev. B: Condens. Matter Mater. Phys., 2002, 66, 035418 CrossRef.
- J. B. A. Davis, S. L. Horswell and R. L. Johnston, J. Phys. Chem. C, 2016, 120, 3759–3765 CAS.
- G. Bravo-Pérez, I. L. Garzón and O. Novaro, Chem. Phys. Lett., 1999, 313, 655–664 CrossRef.
- K. Pitzer, Acc. Chem. Res., 1979, 12, 271–276 CrossRef CAS.
- H. Häkkinen, M. Moseler and U. Landman, Phys. Rev. Lett., 2002, 89, 033401 CrossRef PubMed.
- M. Moseler, H. Häkkinen, R. N. Barnett and U. Landman, Phys. Rev. Lett., 2001, 86, 2545–2548 CrossRef CAS PubMed.
- J. B. A. Davis, S. L. Horswell and R. L. Johnston, J. Phys. Chem. A, 2014, 118, 208–214 CrossRef CAS PubMed.
- J. Jellinek and E. B. Krissinel, Chem. Phys. Lett., 1996, 258, 283–292 CrossRef CAS.
- D. Palagin and J. Doye, Phys. Chem. Chem. Phys., 2015, 17, 28010–28021 RSC.
- I. V. Yudanov and K. M. Neyman, Phys. Chem. Chem. Phys., 2010, 12, 5094–5100 RSC.
- R. Ferrando, J. Jellinek and R. L. Johnston, Chem. Rev., 2008, 108, 845–910 CrossRef CAS PubMed.
Footnote |
| † Electronic supplementary information (ESI) available. See DOI: 10.1039/c6cp03958h |
| This journal is © the Owner Societies 2016 |

