
 Open Access Article
 This Open Access Article is licensed under a
 Creative Commons Attribution 3.0 Unported Licence
Experimental and molecular dynamics studies of anthraquinone dyes in a nematic liquid-crystal host: a rationale for observed alignment trends†
Mark T.
Sims
,
Laurence C.
Abbott
,
Stephen J.
Cowling
,
John W.
Goodby
and
John N.
Moore
*
Department of Chemistry, The University of York, Heslington, York YO10 5DD, UK. E-mail: john.moore@york.ac.uk
First published on 14th July 2016
Abstract
Five anthraquinone dyes with bis(4-propylphenyl) substituents, connected via sulfide or amine linking groups at the 1,5-positions or directly at the 2,6-positions, have been studied as guests in the nematic liquid crystal host, E7. Polarized UV-visible absorption spectra of aligned samples were used to obtain experimental dichroic order parameters, which exhibit values in the range 0.51–0.74. Fully atomistic MD simulations of these guest–host systems were carried out, generally using default parameters but using new force constants derived here for the dyes containing flexible phenyl-sulfide and phenyl-amine linking groups. An analysis of the alignment of the dye molecules in these simulations provides calculated molecular order parameters, which are combined with calculated order parameters for the alignment of the transition dipole moments within the dyes, reported previously, to give calculated dichroic order parameters. The trend in the calculated dichroic order parameters between the dyes shows a good match with the trend in the experimental values, enabling the observed variation to be rationalised primarily by changes in the alignment of the calculated transition dipole moments within the dyes; the calculated molecular order parameters show a relatively small variation between the dyes. The results indicate that this computational approach may be used generally to rationalise trends in the alignment of guest molecules in liquid crystal hosts, suggesting that it may also be able to provide a predictive aid in the design of guest dyes.
Introduction
The original observation that suitable guest dye molecules can exhibit alignment within a liquid crystalline host material1 soon led to a significant research effort that was stimulated primarily by the potential for guest–host systems to be utilised in display devices. In such devices, an electric field is used to switch the liquid crystal host, and thereby the guest dye molecules, between bulk orientations that result in either the absorption or the transmission of incident light because the absorption transition occurs along a specific axis within a dye molecule. Significant progress was made subsequently in developing various designs and modes of operation for such devices,2 which offer several advantages over the commonly used backlit liquid crystal displays. For example, guest–host devices do not necessarily require polarizers, coloured filters may not be required because the dyes are coloured, and it is possible to use reflective or light-scattering modes without the need for a backlight, all of which offer the prospect of displays with high optical efficiency and extremely low power consumption.3 More recently, interest in guest–host systems has expanded well beyond the initial focus on display technology, and many diverse applications have been suggested, including their use within switchable solar windows4 and switchable waveguides,5 in optical storage,6 3D imaging7 and security devices,8 and as precursors for polarizers.9Despite the advantages and potential benefits of guest–host systems, they have not been used widely in commercial applications because it has proved difficult to meet the stringent design criteria required to produce practical devices. In the context of displays, a device is required to have an operational lifetime of several years, and the limited photochemical and/or electrochemical stability of some classes of dyes has presented a significant barrier to their use.2,10 For many of the potential applications, including displays, the dyes must be pure and must exhibit visible transitions with high absorption coefficients, ideally with absorption maxima that can be tuned by accessible synthetic routes to derivatives that provide a range of intense colours, for use either as single dyes or as mixtures that can extend to deep black. The dyes must also be compatible with the host to provide sufficient dye solubility, as well as not compromising key properties of the host, such as alignment, viscosity, switching time, and phase transition temperatures. In addition to these properties, the overriding criterion that must be fulfilled in all such applications is that the visible transition dipole moments (TDMs) of the dye molecules must exhibit a high degree of alignment within the host in order to maximise the optical anisotropy of the guest–host system; in the context of displays, it is important to optimise the TDM alignment of the dye within the host because it is the key property that determines the contrast ratio obtained on switching between the absorbing and transmitting states of a device.10 The limited availability of guest–host systems that can meet the various design criteria concurrently has restricted their widespread practical use to date, and relatively poor dye TDM alignment remains one of the general barriers that needs to be overcome if further progress is to be made.
The alignment of a guest dye within a liquid crystal host is generally studied by placing the guest–host mixture in a cell with coated surfaces that cause the bulk sample to align in a defined direction, and then measuring the absorbance with the cell oriented so that the sample is aligned parallel (A∥) and then perpendicular (A⊥) to the electric vector of incident polarized light, as shown in Fig. 1. The ratio of these absorbances gives the experimental dichroic ratio, R = A∥/A⊥, which is used to obtain the experimental dichroic order parameter of the dye,
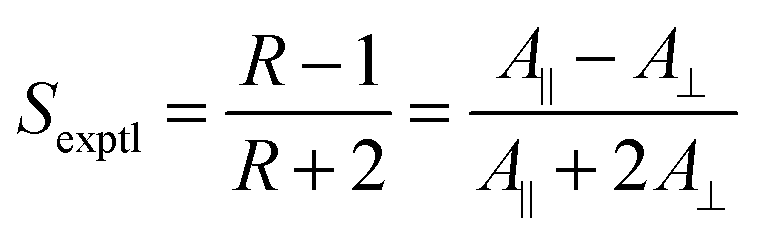 | (1) |
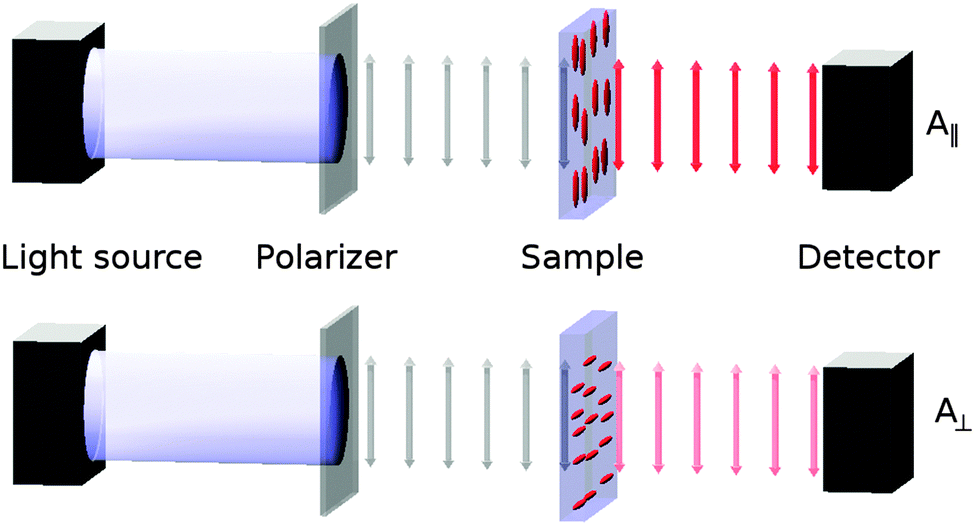 | ||
| Fig. 1 Schematic diagram of the experimental set-up for recording polarized absorption spectra of aligned guest–host samples. | ||
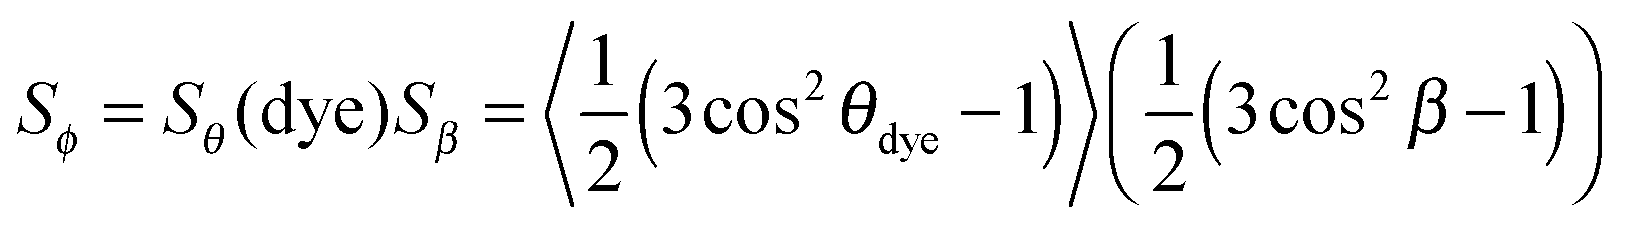
The value of the dichroic order parameter is determined by the alignment of the TDMs of the dye molecules within the host, which arises from several contributory factors that include the alignment of the host molecules, the alignment of the guest dye molecules within the host, and the alignment of the visible TDMs within the dye molecules, as illustrated in Fig. 2.2 In a nematic liquid crystal host, the host molecules align along a preferred axis named the director, defined by a unit vector n, and the order parameter of the host molecules is given by
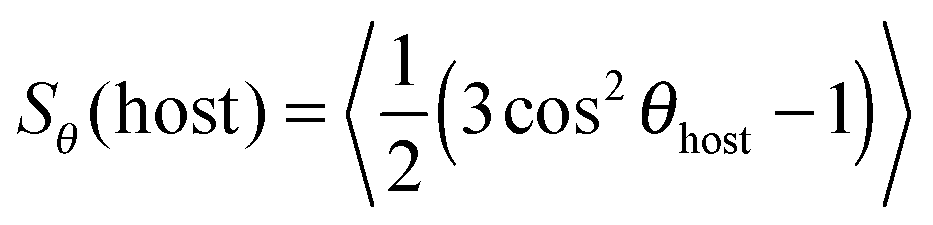 | (2) |
 | (3) |
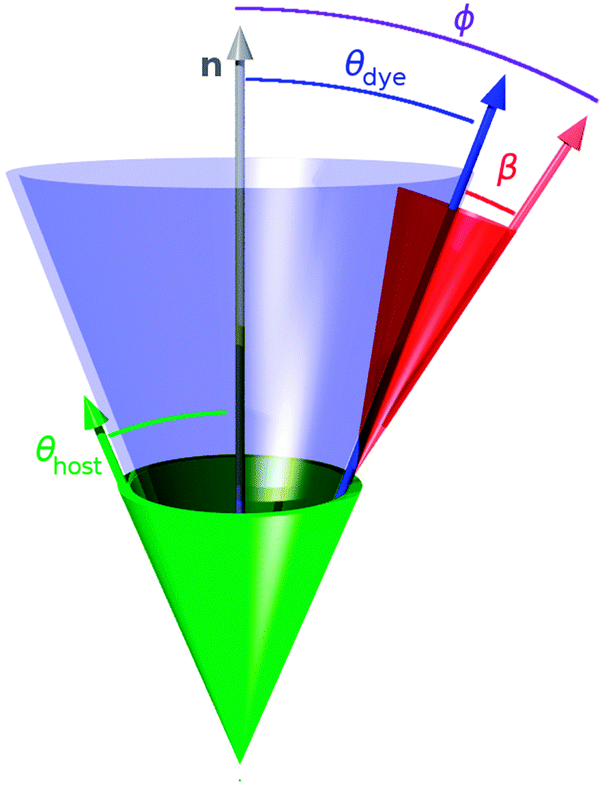 | ||
| Fig. 2 Schematic representation of the nematic host director, n, with the relative alignment of a host molecule given by angle θhost (green), and a guest dye molecule given by angle θdye (blue). The alignment of the visible TDM relative to the dye molecule is given by angle β (red), and relative to the host director is given by angle ϕ (violet). | ||
From the perspective of guest–host design, a liquid crystal host with a high value of Sθ (host) is required because the alignment of guest dye molecules given by Sθ (dye) depends on the alignment of the host molecules, although the alignment of the guest is not necessarily limited by that of the host, and a guest may often have a slightly higher molecular order parameter than its host.10 The design of a host can generally be considered separately from that of a guest because a dye that exhibits good alignment in one host typically exhibits good alignment in other hosts. The design of a guest involves considering the two inter-dependent order parameters expressed by eqn (3), both of which must be optimised for a dye to exhibit a large dichroic order parameter in a guest–host mixture. The molecular alignment of the dyes within a host is determined primarily by the molecular shape of the dyes, and highly anisotropic dye molecules with high aspect ratios tend to give good alignments with high values of Sθ (dye).13–15 The alignment of the TDM within the dye molecule is also influenced by the molecular architecture, with highly symmetric rod-like dye molecules often having angles, β, close to 0° that give values of Sβ approaching 1,10 but this cannot always be assumed to be the case, especially for molecules of lower symmetry.16
Many synthetic approaches to optimising dye structures for use in guest–host systems have been reported in the literature, covering a variety of dye classes,17–24 and a range of dichroic order parameters have been measured from dyes with absorption maxima across the visible spectrum. A large number of studies have focused on azo dyes, which can readily be synthesised with a variety of colours and with rod-like molecular shapes that can give experimental dichroic order parameters of Sexptl > 0.7 in nematic hosts,15,19,25 but they have typically been found to lack the stability required for the operational lifetime of a device.10,26–28 Anthraquinone dyes have generally been found to exhibit significantly better stability than azo dyes, and they can also be synthesised with a variety of colours, but the shape of the chromophore typically results in less rod-like structures than azo dyes, and they have typically given experimental order parameters of <0.7.15,29 Anthraquinone dyes with sulfide substituents have been found to give higher experimental order parameters of up to 0.8 in nematic hosts,30–33 but examples of such well-aligned systems have tended to be restricted to yellow dyes. Limited solubility has also been reported to be problematic for some anthraquinone dyes in guest–host systems.27,34
The approaches to dye design reported in the literature have generally been synthetically based, and they have provided valuable information on a variety of compounds, but overall success in producing dyes that meet all of the design criteria required for practical guest–host applications has been relatively limited to date. Consequently, a quantitative and more detailed understanding of how the molecular structure affects the colour, stability, molecular alignment and TDM alignment of guest dyes is required to provide improved approaches to the rational design of practical guest–host systems with high dichroic order parameters.
The effects of structural variations on dye colour have been considered extensively in the history of dye chemistry, with semi-quantitative structure–property relationships often being used. Modern computational chemistry can now be used effectively in considering such properties, with one example being the use of anthraquinone dyes as benchmark compounds for the application of time-dependent density functional theory (TD-DFT) to calculate visible absorption wavelengths, spectra and colours,35,36 demonstrating the predictive capabilities of this method. In a recent study of a set of five highly pure anthraquinone dyes with different substituents, shown in Fig. 3, we found that the results of TD-DFT calculations could be used to rationalise how the substituents control the visible band positions and hence dye colours, with the variation between these dyes being attributable principally to changes in the HOMO energies.16 In addition, these calculations showed that the substituents control the orientation of the visible TDM within the dyes, resulting in a range of values for β, and hence Sβ, as given in Fig. 3. As one of the contributory factors to the dichroic order parameter in a host, the variation in the values of Sβ, shown graphically in Fig. 4, provided part of a structural rationale for why the dichroic order parameters of guest 1,5-diamine anthraquinones are generally reported to be lower than those of 1,5-disulfide anthraquinones,30 and also for the high dichroic order parameter we reported recently for a 2,6-disubstituted anthraquinone.37 We also used the DFT optimised gas-phase structures of the dyes in their all-trans geometries to calculate molecular aspect ratios (length/width ratios), as also given in Fig. 3. Such aspect ratios are used extensively in the literature to consider the molecular alignment of both liquid crystalline molecules38–43 and guest molecules14,44–46 within anisotropic systems, and they have also been reported to correlate with trends in experimental dichroic order parameters for some guest dyes.16,19,20,28 We found that the aspect ratios of the five dyes gave a trend, shown graphically in Fig. 4, that was broadly consistent with the dichroic order parameters reported generally for these types of dyes, suggesting that their molecular alignment in a host correlates broadly with the rod-like nature of the dye molecules. Our recent report on this set of five dyes was limited to isotropic solutions, and to calculated structures of static molecules. In this article, we report experimental studies of this set of dyes in a nematic liquid crystal host, along with molecular dynamics (MD) simulations in which these flexible molecules explore a range of conformations and orientations.
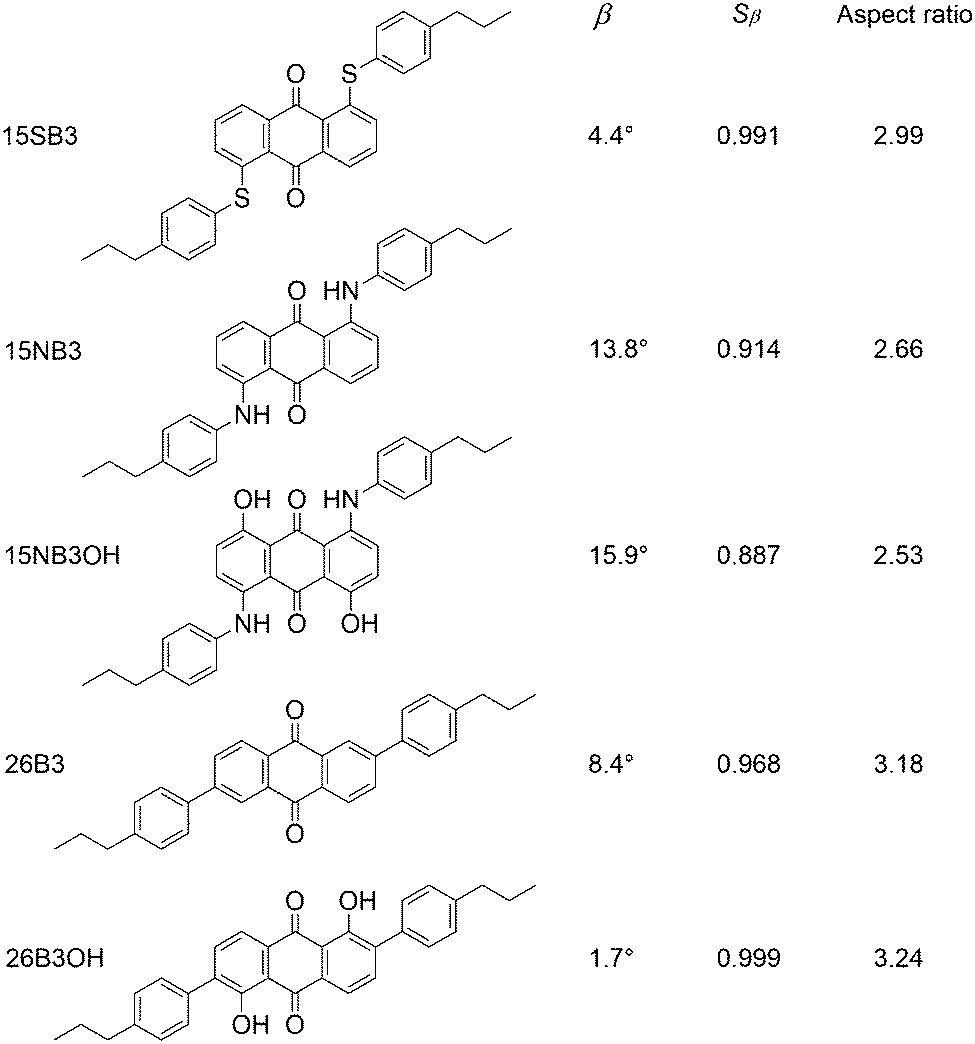 | ||
| Fig. 3 Abbreviations and structures of the five dyes studied here, along with the calculated TDM angles, β, order parameters, Sβ, and aspect ratios of their optimised all-trans geometries reported previously.16 | ||
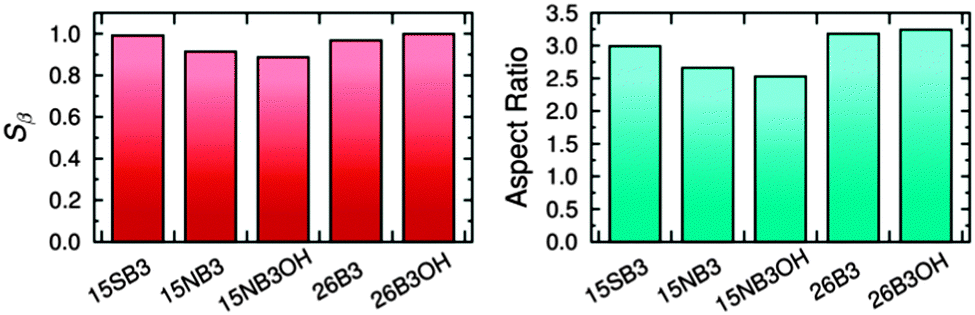 | ||
| Fig. 4 Calculated order parameters of the TDMs within the dye molecules, Sβ, (left) and aspect ratios of the dye molecules in their all-trans geometries (right).16 | ||
MD simulations of liquid crystal systems are becoming increasingly established, and they extend from coarse-grained models,47,48 through united-atom models,49–51 to fully atomistic simulations of flexible molecules in which all of the atoms in a system are considered explicitly.48,52–54 The focus of these MD studies has often been on cyanobiphenyl-based compounds, due to their widespread use and the extensive experimental studies reported on these systems, and the development of suitable force fields has been an integral part of such work.49,55,56 Simulations of both nematic and smectic phases have been demonstrated to replicate experimental mesophase densities,51,54 phase transitions and transition temperatures,49,51 as well as behaviour at solid surfaces57 and in thin films.58 Reports of MD simulations of guest–host systems have been limited to date, and have generally been on guest molecules other than dyes; they have included calculations of EPR spectra from spin probes,59,60 NMR data of small organic species,61 the orientational order of small solute molecules,62 and the orientational and positional order of biphenyl as a guest species,63 all studied in cyanobiphenyl hosts.
We recently reported fully atomistic MD simulations of a guest–host system comprising dye 26B3OH (Fig. 3) in the cyanobiphenyl-based nematic host, E7.37 We used the simulations to obtain calculated molecular alignments of both guest and host molecules, as expressed by Sθ (dye) and Sθ (host) in eqn (3) and (2), respectively, arising from a dynamic range of molecular conformations and molecular alignment angles, θ, that were explored during the simulations. We also showed how the value of Sθ (dye) from an MD simulation could be combined with the value of Sβ from a TD-DFT calculation to provide a calculated dichroic order parameter, Sϕ, that could be compared directly with the experimental dichroic order parameter, Sexptl, obtained from polarized UV-visible absorption spectra.37 This combined MD and DFT computational approach is desirable from a molecular design perspective because it enables the dichroic ratios of guest–host mixtures to be calculated without the input of any associated experimental data, and hence it may be able provide a general aid to the rational design of such systems.
Here, we present experimental polarized UV-visible absorption spectra and dichroic order parameters for all of the anthraquinone dyes shown in Fig. 3 as guests within the nematic host E7. We also present fully atomistic MD simulations of all these guest–host systems, after first reporting force constant parameterisation for some of the bond and dihedral angles in the 1,5-disubstituted dyes that define important aspects of their flexibility. We then combine the molecular order parameters obtained from the MD simulations with the TDM order parameters obtained from the TD-DFT calculations we reported previously16 to give calculated dichroic order parameters that provide a direct comparison with the experimental values reported here, enabling the observed variations between the dyes in the guest–host systems to be rationalised. The results from the 26B3OH system that we reported previously, in a study that established this general approach,37 are presented here alongside those of the other dyes in order to report further analysis of those results and to enable direct comparisons to be made between all five dyes.
Methods
Experimental
The preparation, purification and characterisation of the dyes used in this study has been described previously.64 E7 (Merck) was used as received. Guest–host samples were prepared by heating a mixture of the dye and E7 above the clearing point to ensure that the dyes were fully dissolved, before cooling the mixture to room temperature and sonicating for ca. 2 min; the dyes were used at a concentration of ca. 1.5 wt% except for 15NB3OH, which was used at ca. 0.75 wt% to ensure that the peak absorbance was within the instrument range. Visual and microscope inspection of the samples showed no evidence of dye precipitation. Cells for aligned measurements were prepared by spin-coating glass slides with a saturated solution of nylon-6,6 in formic acid before drying in an oven at 100 °C. The slides were rubbed in a single defined direction to achieve homogeneous surface alignment before being glued with the aligned faces inwards and using polyethylene terephthalate (PET) spacers to obtain cells with a pathlength of ca. 20 μm, which was measured accurately in each case by the interference pattern obtained from a UV-visible absorption spectrum of the empty cell. Inspection of the filled cells under a microscope with crossed polarizers confirmed that homogeneous alignment was achieved in all samples.Polarized UV-visible absorption spectra of the samples were recorded at 300 K against air using a UV-visible spectrophotometer (Hitachi U-3010) with a Glan-laser polarizer (Newport 10GL08) fixed between the lamp and the sample, as shown in Fig. 1. Each guest–host sample was rotated to obtain the maximum absorbance at the visible wavelength of maximum absorption for the parallel measurement, A∥; the sample was then rotated by 90° for the perpendicular measurement, A⊥. Polarized absorption spectra of an aligned sample of E7 alone were recorded using the same method and were subtracted from the guest–host spectra, scaled according to the respective cell path length, which were then baseline corrected to obtain the data presented here.
Nematic–isotropic transition temperatures of the guest–host mixtures, and of E7 alone, were obtained by microscopy, using a polarizing transmitted light microscope (Zeiss Axioskop 40) with a microfurnace and central processor (Mettler FP82HT and FP90); they are reported and discussed briefly in the ESI† (Table S1).
Computational
The simulations were started from pseudo-nematic starting geometries, in accordance with methods described previously.37,54 with 5 dye molecules and 400 host molecules of E7 in each simulation giving effective dye concentrations of ca. 2 wt% that were comparable to those of the experimental samples. The simulations were run for a total of 500 ns, and analysis was carried out at 30–500 ns. This approach provided a sufficient number of dye molecules for analysis while maintaining a practical computation time,37 as discussed in the ESI.†
All geometry optimisations and potential energy scans were carried out using the Gaussian 09 software package.76 The long axes of the host molecules and the dye molecules were defined as the minimum moment of inertia axes, and order parameters were calculated using these axes in accordance with eqn (2) and (3), and as described previously.37,54 The moment of inertia axes were calculated as the eigenvectors associated with the minimum eigenvalues of the diagonalised moment of inertia tensors of the geometries studied.77 Molecular lengths were defined as the lengths of the van der Waals surfaces78 parallel to the minimum moment of inertia axes, and molecular widths were defined as twice the maximum perpendicular distances from the minimum moment of inertia axes to the van der Waals surfaces. Aspect ratios were calculated as the ratios of these two values.
The bonds lengths were constrained to their equilibrium values during the MD simulations, and consequently the force constants of only the angle bending and dihedral torsions required consideration. The bending term is given by
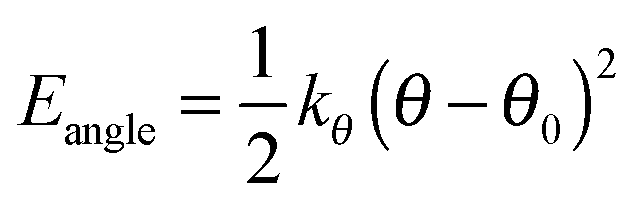 | (4) |
 | (5) |
Cyanobiphenyl and biphenyl torsional force constants have been parameterised for liquid crystal mixtures and resultant simulations shown to match experimental densities and heats of vaporisation.55 Hence, these reported cyanobiphenyl and biphenyl force constants were used here to describe the inter-ring torsions of the cyanobiphenyl host compounds and the inter-ring torsions of the 2,6-disubstituted dyes, respectively.
The force constants determined here for the 1,5-disubstituted dyes were obtained by carrying out relaxed geometry scans at the HF/6-31g(d) level, giving consistency with the level used in the development of the OPLS-AA force field69 and providing an acceptable computation time for the large number of optimisations performed (>2000 optimisations in total). For each dye, a series of HF optimisations was carried out in Gaussian 09 by stepping around a set of fixed values for the bond angle (θ) or dihedral angle (ψ) of interest, with the geometry otherwise being relaxed at each step but with the dihedral angles within the aromatic systems being constrained to maintain the carbon atoms in a planar configuration: this scan provided a series of conformational “HF energies”. The “MD energy” for each of these relaxed geometries at the fixed angles was then calculated in GROMACS 4.5.5 with the force constant(s) relating to the bond or dihedral angle of interest being set to zero. The force constant(s) and equilibrium angle θ0 (where appropriate) were then determined by fitting the variables in either eqn (4) or (5) to the energy difference between the HF and MD energies across the range of fixed θ or ψ angles used in the geometry scans; the fits were carried out using R.82 The specific methods and results for each dye are described in the Results and discussion section, where the fitted parameters are assessed by comparing the HF energies with the MD energies calculated using the fitted values.
Results and discussion
Experimental order parameters
The polarized UV-visible absorption spectra of aligned samples of the dyes in E7 are shown in Fig. 5, which gives spectra with the samples aligned parallel and perpendicular to the electric vector of the incident polarized light. The wavelengths of maximum absorption, λmax, dichroic ratios, and dichroic order parameters of the dyes in E7 are listed in Table 1, along with the λmax values in p-xylene for comparison. The dichroic ratio was effectively constant across the visible absorption band of each dye, which is consistent with each band arising generally from a single electronic transition, as we reported previously,16 and the dichroic ratios across the full spectral range are shown in the ESI† (Fig. S1). The λmax values in Table 1 indicate that the visible absorption peak of each dye occurs at longer wavelength in E7 than in p-xylene, whereas the profiles of these visible bands are very similar in E7 and p-xylene, as shown by an overlay plot of these spectra given in the ESI† (Fig. S2).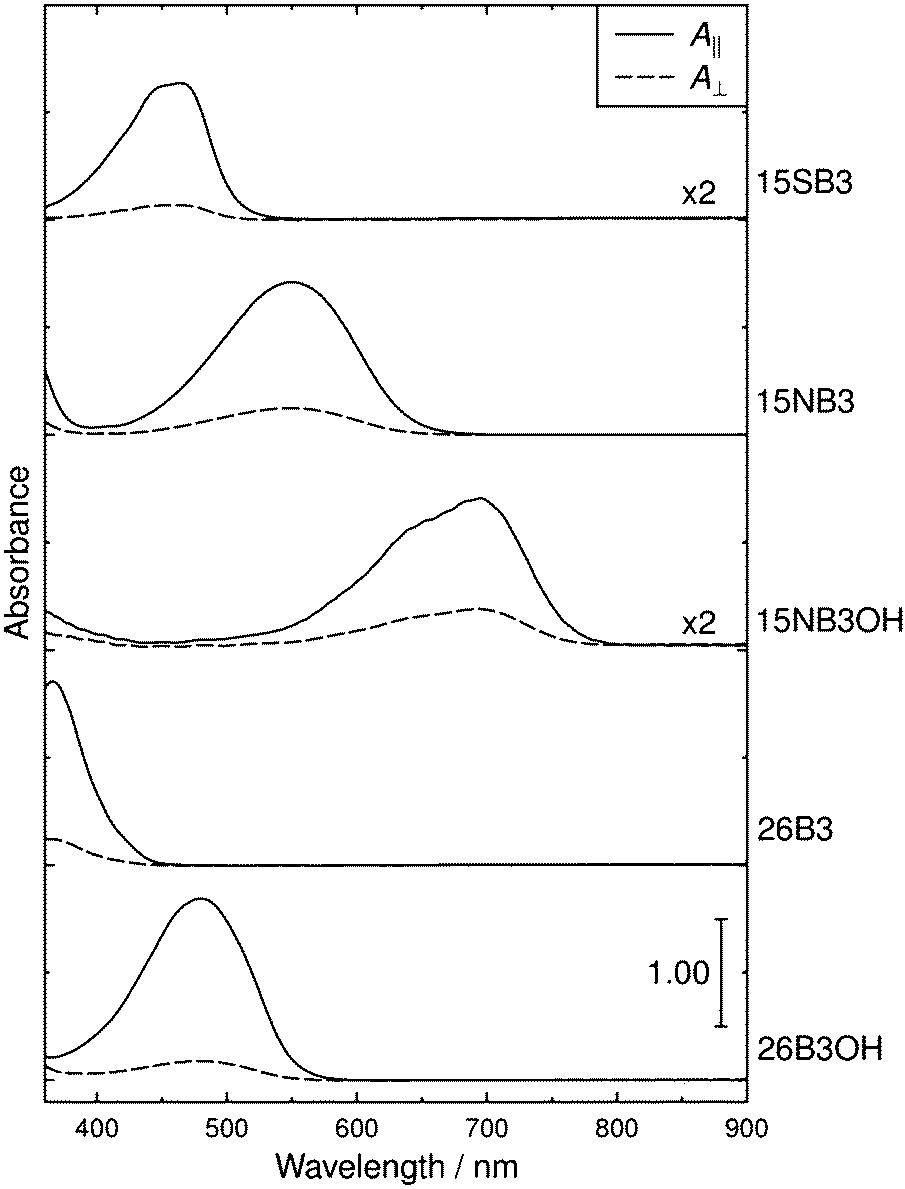 | ||
| Fig. 5 Polarized UV-visible absorption spectra of aligned samples of the dyes in E7. The spectra are offset for clarity. | ||
The consistent absorption profiles obtained from the dyes in E7 and p-xylene indicate that dye aggregation did not occur appreciably in E7 because significant changes in UV-visible absorption profiles typically accompany dye aggregation, and they are widely used to characterise H- and J-aggregates.83 The absence of dye aggregation in E7 was also supported by the absence of any evidence of precipitation on visual or microscope inspection. The shift in λmax values between the two solutions is consistent with that reported for many dyes on going from non-polar isotropic solvents to cyanobiphenyl-based liquid-crystalline solvents;28,84,85 in the case of an oxazine dye, the shift has been attributed to an increase in solvent polarizability on going to the cyanobiphenyl host.86 The magnitudes of the red-shifts observed here are relatively small (6–21 nm) but they result in some subtle changes in the observed colours, and this effect may need to be considered generally in designing dyes to give specific colours for a particular host.
The experimental dichroic ratios and order parameters listed in Table 1 show that there are significant differences in the TDM alignments of the dyes within the E7 host. The relatively high order parameter of 0.73 for 15SB3 is consistent with those reported for other 1,5-diphenylthio substituted anthraquinones.30–33 The change to an amine linking group gives a lower order parameter of 0.61 for 15NB3, which is consistent with the lower values reported generally for 1,5-diphenylamino substituted anthraquinones,29,87 and the addition of 4,8-hydroxyl substituents results in a further decrease in the order parameter to 0.51 for 15NB3OH. The 2,6-disubstituted dyes exhibit relatively high order parameters of 0.68 for 26B3 and 0.74 for 26B3OH.
The trend in the experimental order parameters matches the trend in the calculated values of Sβ shown in Fig. 4. This match indicates that the calculated angles of the TDMs within the molecules can be used, in part, to rationalise the experimental trend, with small angles, β, giving high values of Sβ and thereby high experimental dichroic order parameters viaeqn (3).16 The trend in the experimental order parameters also generally matches the trend in the calculated aspect ratios of the dyes shown in Fig. 4, suggesting that the experimental trend may also be rationalised, in part, by the influence of the aspect ratios on molecular alignment.
MD force field parameterisation
The force constants that required parameterisation for the MD force field to describe the dye structures adequately were identified as those for the C–S–C angle bending and the C–S–C–C, C–N–C–C and H–N–C–C dihedral torsions within 15SB3, 15NB3 and 15NB3OH. In order to simplify the parameterisation process, the model structures M1, M2 and M3 were used, as shown in Fig. 6, where they are labelled with the angles and dihedrals for which force constants were determined. These structures were chosen as appropriate models to generate force constants that may be expected to be transferrable to the respective dye structures, and calculations gave optimised geometries in which the dihedral angles of M2 and M3 were within 1° of those of the respective dyes calculated at the same level of theory.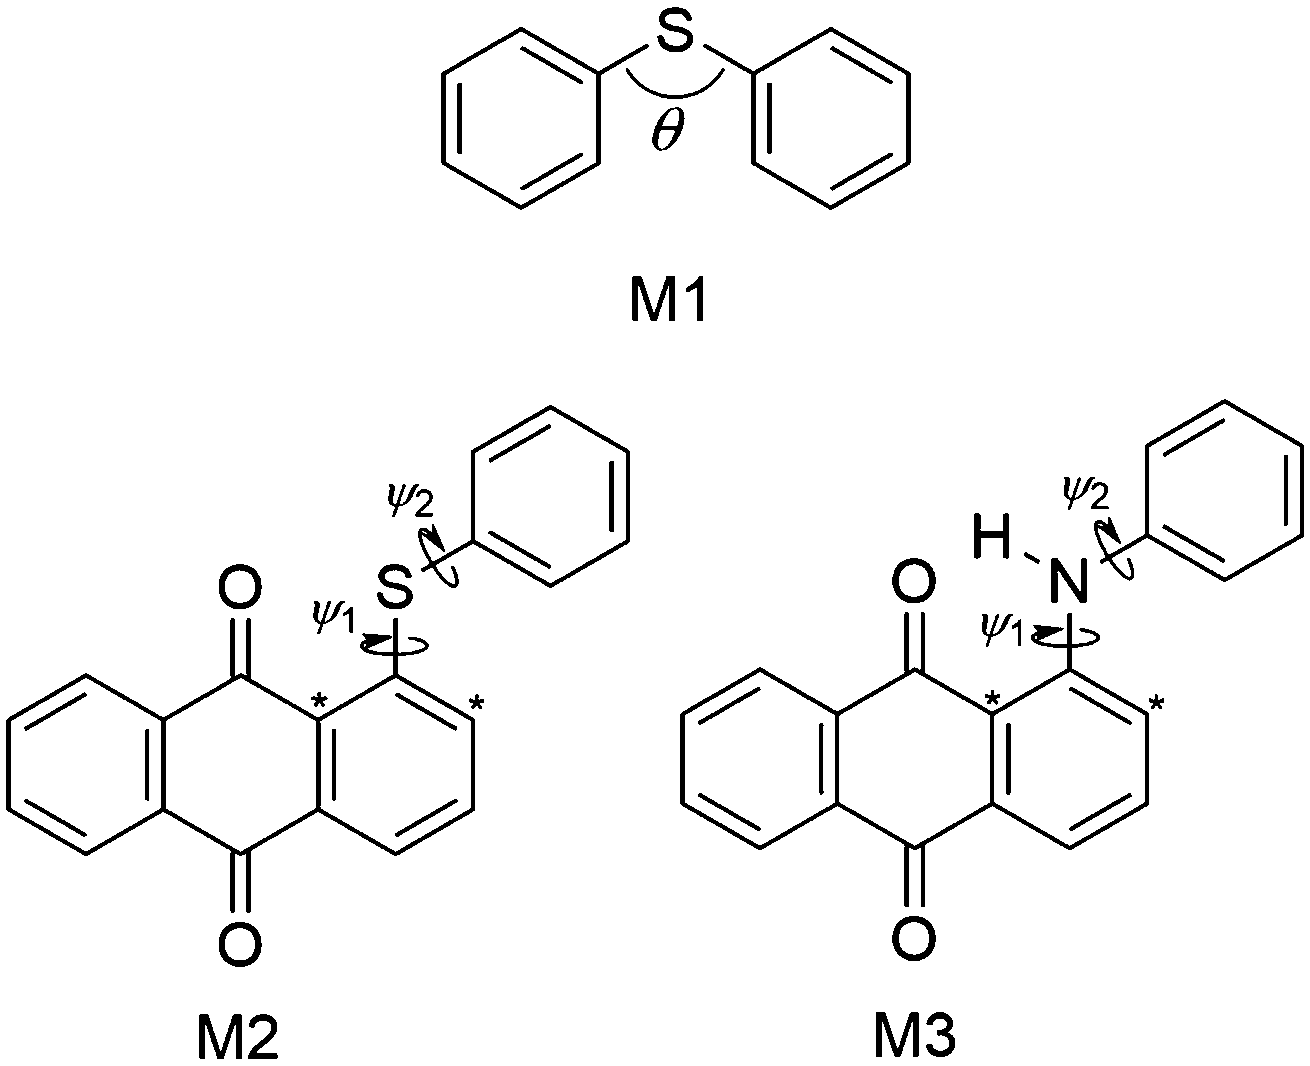 | ||
| Fig. 6 Model structures used to parameterise the force constants associated with the C–S–C angle (M1), the C–S–C–C dihedrals (M2), and the C–N–C–C and H–N–C–C dihedrals (M3) required for 15SB3, 15NB3 and 15NB3OH in the guest–host MD simulations. The asterisks identify different carbon atom types that were used to distinguish ψ1 and ψ2. | ||
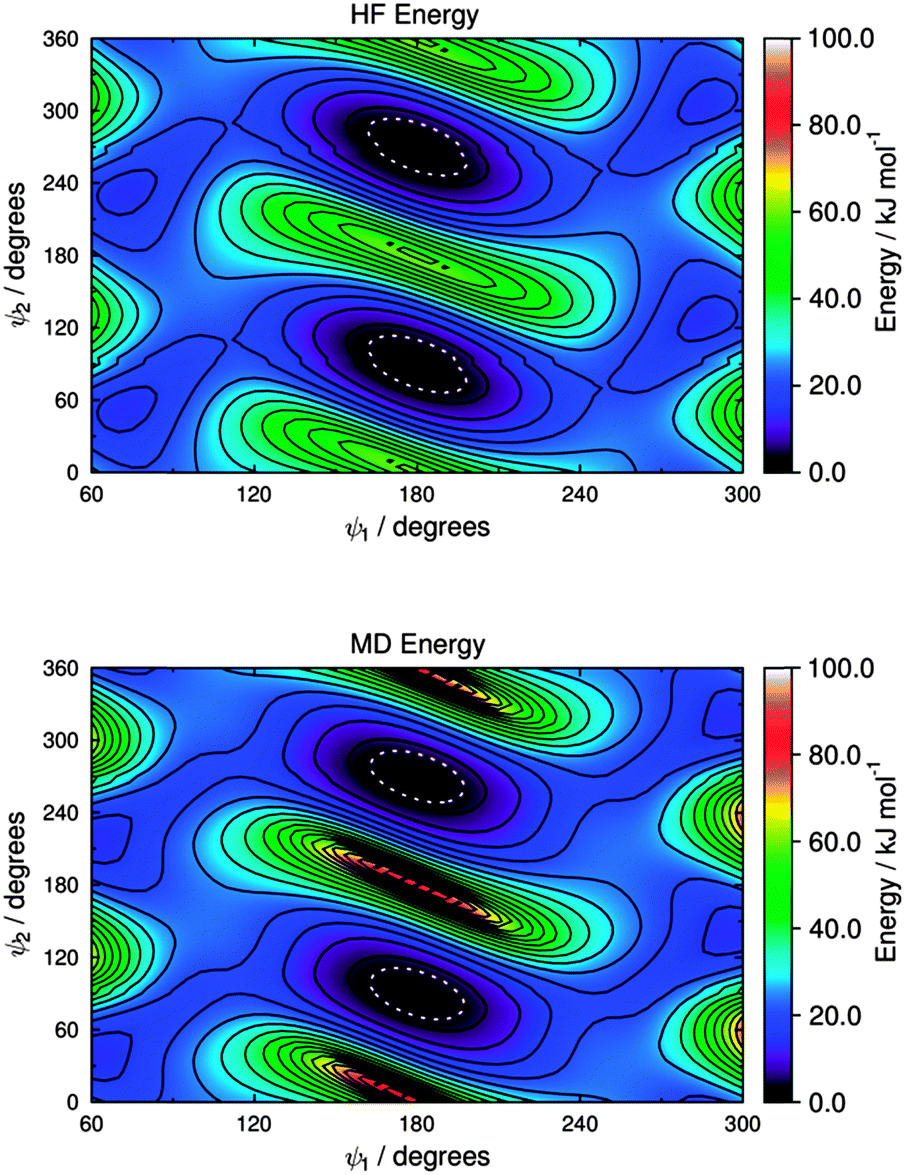
Potential energy curves for fitting the C–S–C bending force constant were obtained by calculating a set of conformational HF and MD energies of M1, as described in the Experimental section. Due to the fact that the C–S–C–C torsional force constants had not been parameterised at this point, four potential energy plots were produced with the C–S–C–C dihedrals fixed at angles of ψ = 90°, 120°, 150° and 180°, enabling the effect of varying the C–S–C angle to be considered at different dihedral angles. Plots of these HF energies are shown in Fig. 7. Fitting to eqn (4) then gave four sets of fitted equilibrium angle and force constant values, from which averages of θ0 = 101.572° and kθ = 556.089 kJ mol−1 rad−1 were determined. The conformational MD energies calculated using these average values gave a good match with the HF energies for each of the fixed dihedral angles, as shown in Fig. 7, and they were used in the MD simulations.
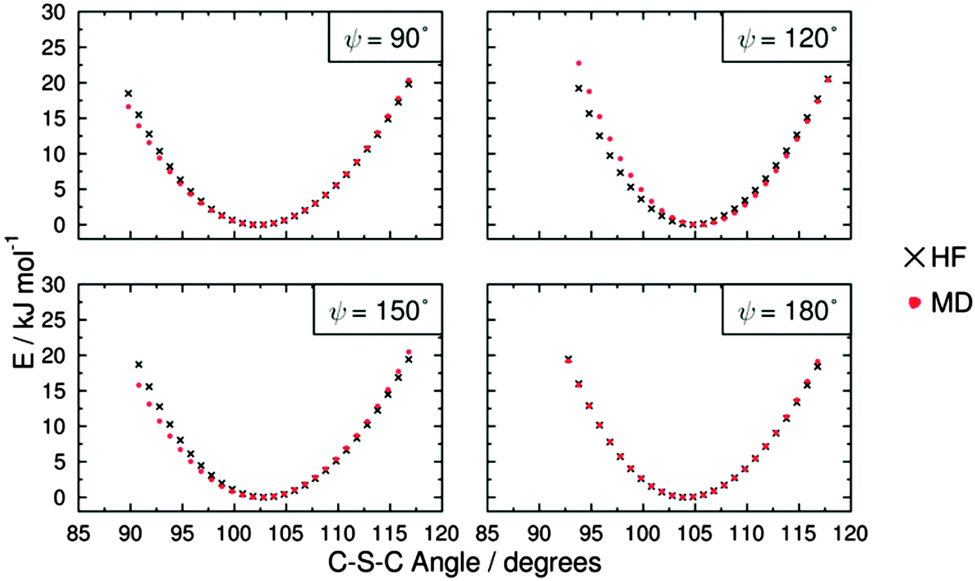 | ||
| Fig. 7 Potential energy curves for the C–S–C bond angle (θ) at four different C–S–C–C dihedral angles (ψ) for M1, showing HF energies and MD energies calculated using the average fitted parameters of θ0 = 101.572° and kθ = 556.089 kJ mol−1 rad−1. | ||
Preliminary calculations indicated that the dihedrals ψ1 and ψ2 were not equivalent, and that torsions around each could not be considered independently of the other for either the sulfide compound (M2) or the amine compound (M3). Hence, torsions about ψ1 and ψ2 were distinguished in the force field by defining the carbon atoms identified with asterisks in Fig. 6 as different atom types from the unlabelled carbon atoms. The HF and MD potential energies for the two dihedrals were calculated by stepping ψ1 across the range 180°–300° and ψ2 across the range 0°–180° at 5° intervals, and then replicating these results for the equivalent structures that occur across the ranges ψ1 = 60°–180° and ψ2 = 180°–360° to generate full plots of the potential energy surfaces.
The HF potential energy surface calculated for M2 is shown in Fig. 8, and it exhibits equivalent minimum energy conformations at ψ1 = 180° and ψ2 = 90°, and at ψ1 = 180° and ψ2 = 270°. The torsional force constants C0–C5 for the C–S–C–C dihedral, ψ2, were fitted by using eqn (5) for the range 20° < ψ2 < 160° and at a fixed value of ψ1 = 180°, which was the angle of ψ1 that gave the minimum energy in the optimised geometry. A subsequent fit for the C*–C–S–C dihedral, ψ1, was carried out for the range 90° < ψ1 < 270° and with ψ2 unconstrained, using the fitted force constants for ψ2. The fitted force constants obtained for M2 are listed in Table 2, and the MD potential energy surface calculated using these force constants is shown in Fig. 8.
 | ||
| Fig. 8 Potential energy surfaces for the two C–S–C–C dihedral angles of M2, showing HF energies (top) and MD energies calculated using the fitted parameters given in Table 2 (bottom). Contours are shown at intervals of 5 kJ mol−1, and the white dotted boundaries show RT at 300 K (2.48 kJ mol−1). | ||
| Compound | Dihedral | Torsional force constants/kJ mol−1 | ||||||
|---|---|---|---|---|---|---|---|---|
| C 0 | C 1 | C 2 | C 3 | C 4 | C 5 | |||
| M2 | ψ 2 | C–C–S–C | 18.27654 | 0.00001 | 2.51901 | −0.00001 | −5.57075 | 0.00001 |
| ψ 1 | C*–C–S–C | 25.61956 | −0.00001 | −13.22398 | 0.00000 | −12.73441 | 0.00001 | |
| M3 | ψ 2 | C–C–N–C | 18.05799 | 0.01619 | −5.53203 | 0.01654 | −5.84963 | −0.02760 |
| ψ 2′ | C–C–N–H | 6.70517 | −0.01274 | −0.40420 | 0.03014 | 0.64107 | −0.02561 | |
| ψ 1 | C*–C–N–C | 20.58734 | 0.00008 | −8.84758 | −0.00038 | −11.67430 | 0.00027 | |
| ψ 1′ | C*–C–N–H | −13.11104 | −0.05736 | 32.32178 | 0.05109 | −18.77205 | −0.02023 | |
The HF potential energy surface calculated for M3 is shown in Fig. 9, and it appears to exhibit equivalent minimum energy conformations at ψ1 = 180° and ψ2 = 90°, and at ψ1 = 180° and ψ2 = 270°, whereas each of these broad wells has two very shallow local minima (e.g., at ψ1 = 180° and ψ2 ≈ 70° and 110° for one of the wells), as shown by an expanded plot at 0–1.5 kJ mol−1 given in the ESI† (Fig. S3). The torsional force constants for the C–N–C–C dihedral, ψ2, were fitted for the range 20° < ψ2 < 160° and at a fixed value of ψ1 = 180°, and the force constants for the H–N–C–C dihedral, ψ2′, were then fitted for the same geometries obtained from this scan. A subsequent fit for the C–N–C–C* dihedral, ψ1, was carried out for the range 90° < ψ1 < 270° and with ψ2 unconstrained, using the fitted force constants for ψ2; the force constants for the H–N–C–C* dihedral, ψ1′, were then fitted for the same geometries obtained from this second scan. The fitted force constants obtained for M3 are listed in Table 2, and the MD potential energy surface calculated for torsion about the C–N–C–C (ψ1) and C–N–C–C* (ψ2) dihedrals using these force constants is shown in Fig. 9; an expanded plot showing the shallow local minima in this MD potential energy surface is given in the ESI† (Fig. S3).
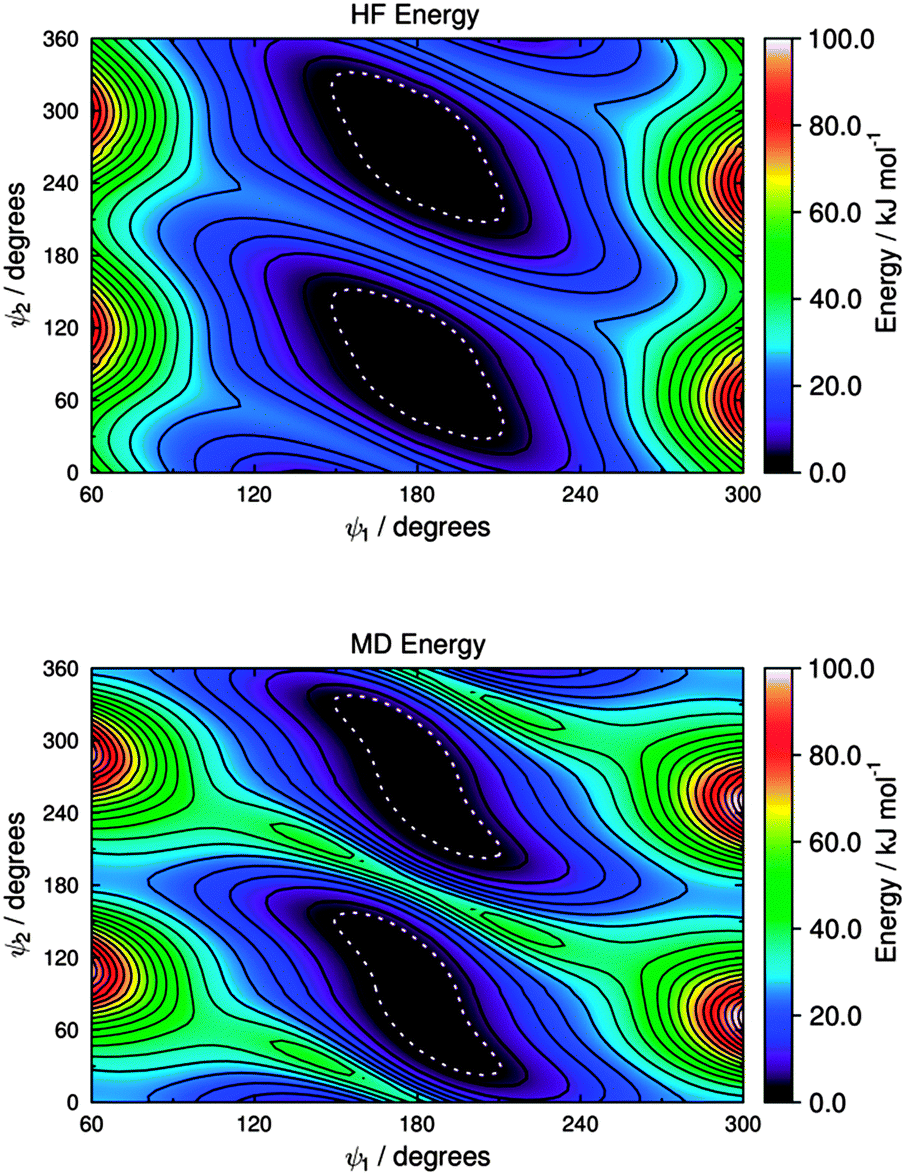 | ||
| Fig. 9 Potential energy surfaces for the two C–N–C–C dihedral angles of M3, showing HF energies (top) and MD energies calculated using the fitted parameters given in Table 2 (bottom). Contours are shown at intervals of 5 kJ mol−1, and the white dotted boundaries show RT at 300 K (2.48 kJ mol−1). | ||
The potential energy surfaces of M2 and M3 in Fig. 8 and 9 show that the sulfide and amine linking groups are flexible, illustrating the importance of obtaining appropriate force constants to use in the MD simulations, and they also show that there is a significant difference in flexibility between the two groups. One way to assess the relative flexibility is to consider the range of angles defined by potential energy wells with the same energy boundaries. The dotted lines in Fig. 8 and 9 show the energy boundaries for RT at 300 K, and the angle ranges defined by these wells are 36° (ψ1) and 46° (ψ2) for M2, and 62° (ψ1) and 124° (ψ2) for M3 (for example, this latter angle range of 124° for M3 results from ψ2 values that extend from 28° to 152°). The differences between these ranges show that the sulfide group is significantly less flexible than the amine group, suggesting that the relative flexibility may be an important contributory factor to the different dichroic order parameters observed generally from dyes with these different linking groups. The results of these calculations contrast an earlier proposal that sulfide groups are more flexible than amine groups, which was based on PPP-CI calculations that gave a lower bond order for C–S than C–N bonds in similar substituted anthraquinone dyes;31,87 our DFT calculations on 15SB3 and 15NB3 also give lower bond orders for C–S than C–N bonds, but the potential energy surfaces show that the bond order is not a good reporter on substituent group flexibility within these compounds.
MD simulations
Our previous report on guest–host MD simulations of 26B3OH in E7 included both isotropic and pseudo-nematic starting geometries, and it discussed the general principles of these approaches.37 In this report, we present simulations of the other four dyes in E7 that were carried out in accordance with the methods we described previously, using pseudo-nematic starting geometries and run times of 500 ns. We also include the results of the simulation of 26B3OH in E7 from a pseudo-nematic starting geometry, which we had described only briefly in our earlier report, in order to present additional analyses and to enable direct comparisons with the other dyes. A verification analysis of all of the simulations discussed here is given in the ESI† (Fig. S4–S9).An assessment of the force constants determined here was carried out by comparing the population distributions for the dihedral angles ψ1 and ψ2 obtained from the guest–host simulations of 15SB3, 15NB3 and 15NB3OH, which are shown in Fig. 10, with the potential energy surfaces of M2 and M3 shown in Fig. 8 and 9. The distribution plots in Fig. 10 show that the two potential wells corresponding to 180° rotations about ψ2 were not explored equally on the time scale of the MD simulations, as shown clearly in Fig. 10(a) and (b), but this does not indicate an insufficient simulation time because the two wells correspond to equivalent conformations and there is a relatively high barrier for interconversion between them, as shown in Fig. 8 and 9. A comparison of the plots in Fig. 10 with those in Fig. 8 and 9 shows that the population distributions of the dyes in the guest–host simulations broadly match the shapes of the potential energy wells calculated for the respective isolated model compounds. This comparability indicates that the lower flexibility of the sulfide than the amine linking groups is maintained on going from the model compounds to the dyes, and also that the dihedral angles ψ1 and ψ2 explored by these groups are relatively unaffected by the presence of the host. A comparison of the population distributions for 15NB3 and 15NB3OH showed that these two dyes explored very similar dihedral angles during the simulations.
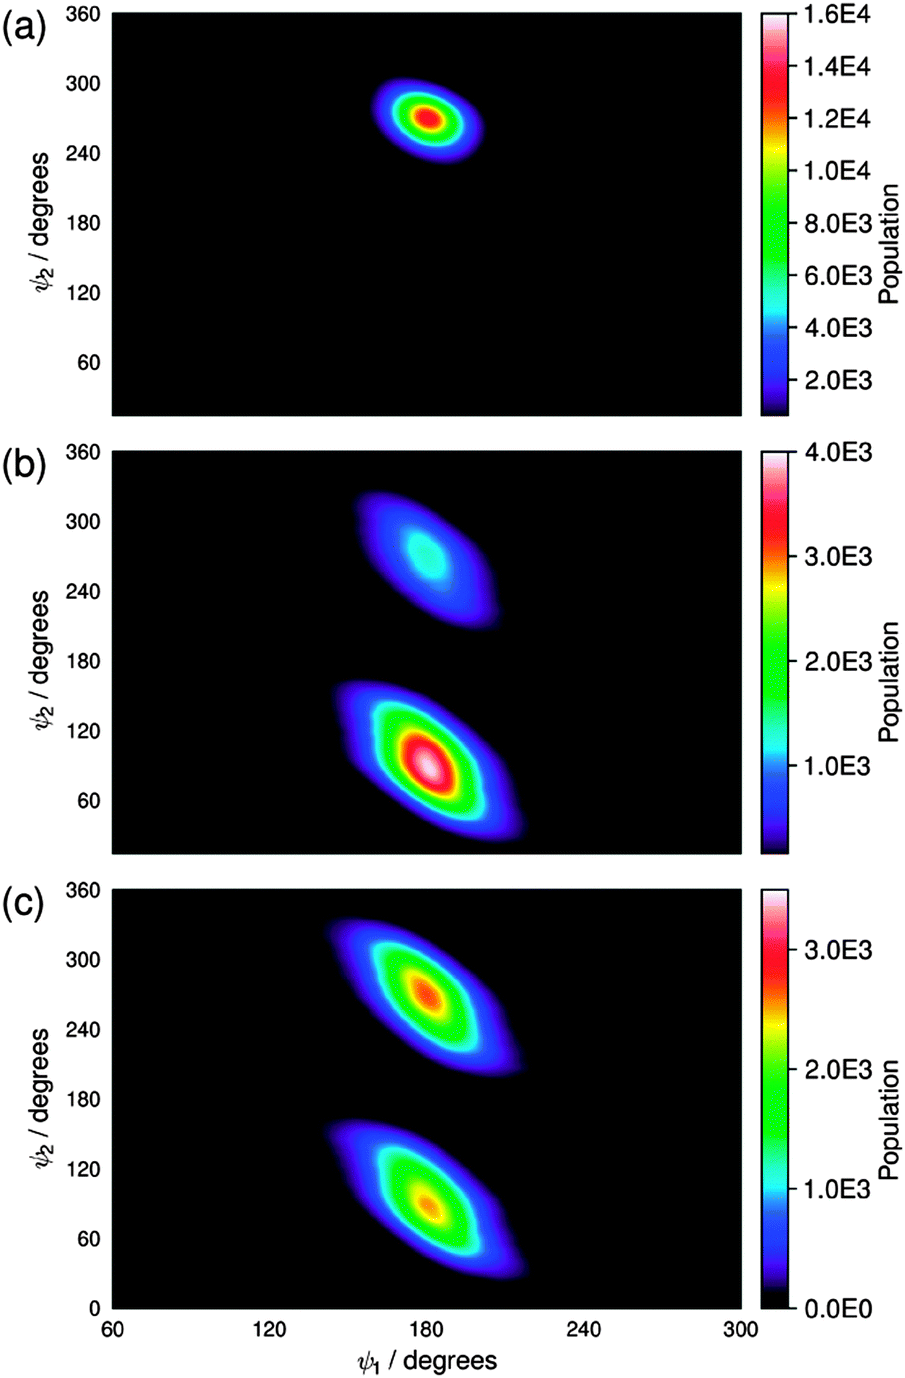 | ||
| Fig. 10 Population distributions of (a) the two C–S–C–C dihedral angles of the five 15SB3 molecules, (b) the two C–N–C–C dihedral angles of the five 15NB3 molecules, and (c) the two C–N–C–C dihedral angles of the five 15NB3OH molecules; all obtained from the MD simulations at 30–500 ns. | ||
The long axes of the host molecules and the dye molecules were defined as the minimum moment of inertia axes, and plots of the molecular order parameters of the host and dye molecules determined from these axes during the simulations are shown in Fig. 11. The values of Sθ (E7) and Sθ (dye) obtained by averaging over 30–500 ns are given in Fig. 11 and are listed in Table 3, and the variation in these values between the different guest–host mixtures is shown graphically in Fig. 12.
| Dye | S θ (E7) | S θ (dye) | Aspect ratio |
|---|---|---|---|
| 15SB3 | 0.880 | 0.836 | 2.86 |
| 15NB3 | 0.871 | 0.869 | 2.53 |
| 15NB3OH | 0.868 | 0.843 | 2.40 |
| 26B3 | 0.873 | 0.880 | 3.03 |
| 26B3OH | 0.879 | 0.896 | 3.09 |
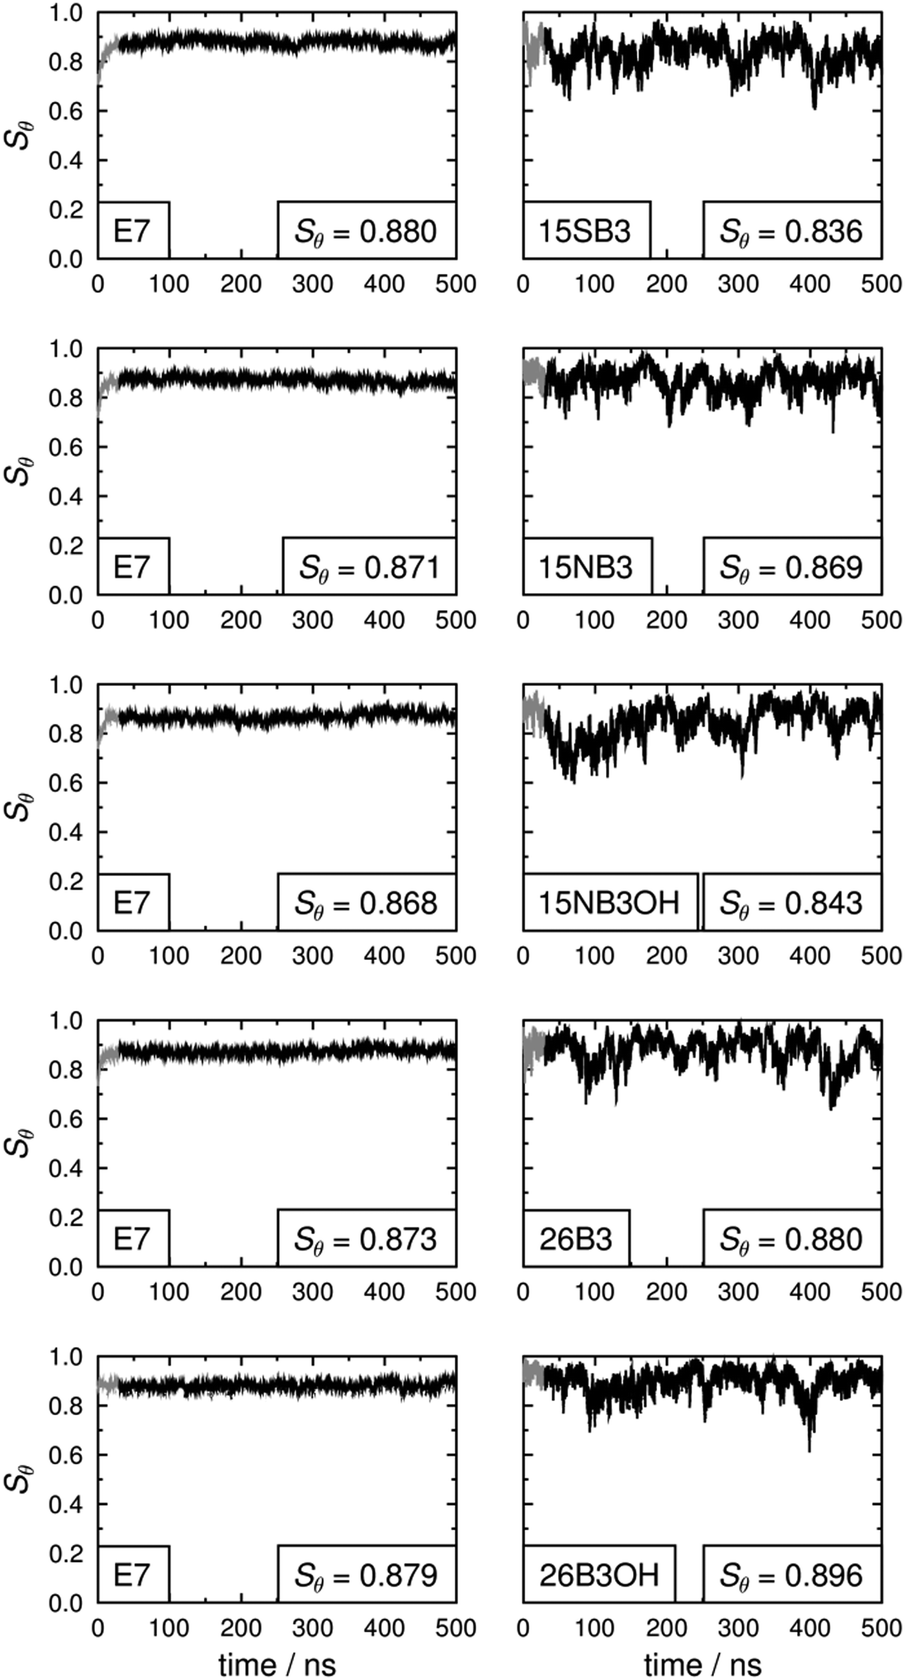 | ||
| Fig. 11 Molecular order parameters of the host, Sθ (E7), (left) and the guest dyes, Sθ (dye), (right) calculated versus the host director and averaged over all 400 E7 host molecules and all 5 dye molecules, respectively, for each time interval. The insets give values obtained by averaging over 30–500 ns, as shown by the ranges plotted in black. | ||
 | ||
| Fig. 12 The molecular order parameters of the host molecules, Sθ (E7), and dye molecules, Sθ (dye), (left) and the aspect ratios of the dye molecules (right), calculated from the MD simulations by averaging over 30–500 ns. | ||
The molecular order parameters simulated here for E7 in the guest–host systems are significantly higher than the experimental order parameter of ca. 0.64 for E7 alone,37,54 and the they indicate an overestimation of the molecular alignment of the host in the simulations that is consistent with other fully atomistic simulations, as reported and discussed previously.37,49,54 In the work reported here, the aim was to compare the behaviour of the different dyes in a simulated nematic environment using default and literature force fields for the host, and not to carry out host parameterisation.
The molecular order parameters indicate that the five dyes have similar molecular alignments in E7, but with small differences giving Sθ (dye) values of 0.836–0.896 that correspond to a range of 0.060. The simulations show that the molecules of the 2,6-disubstituted dyes are more aligned than those of the 1,5-disubstituted dyes, with 26B3OH being more aligned than 26B3. The trend in the molecular order parameters from the simulations of the dyes in E7 generally matches the trend in the experimental dichroic order parameters (Table 1); the exception is 15SB3, which gives the lowest molecular order parameter in the simulations but has a high experimental dichroic order parameter.
The molecular order parameters of E7 indicate that the host molecules have very similar molecular alignments in the presence of the different guest dyes, but with small differences giving Sθ (E7) values of 0.868–0.880 that correspond to a range of 0.012, which is a fifth of the range exhibited by the dyes. The trend in the host order parameters in the simulations matches the trend in the experimental dichroic order parameters of the dyes if the results for 15SB3 and 26B3OH are taken to be comparable. This result from the simulations is consistent with experimental work that has shown guest dyes can change the order parameter of a host; the effect has been attributed to relative molecular sizes, with guest dye molecules that are significantly longer than the host molecules increasing the observed order parameter of the host, and the opposite occurring for guests that are smaller than the host.10 The dye molecules studied here are of comparable size to the constituent molecules of the E7 host, and their influence on the host order parameter may be expected to be relatively small, as indicated by the simulations.
The MD simulations can also be used to provide a dynamic analysis of the flexible molecular structures that is not readily obtainable from electronic structure calculations, and the aspect ratios of the dyes obtained by averaging over 30–500 ns are listed in Table 3. The trend in these aspect ratios is shown graphically in Fig. 12, and it matches the trend in the aspect ratios calculated from the DFT optimised structures of the dyes (Fig. 4), indicating that the range of structures explored in the host does not change the relative aspect ratios of these dyes. The MD simulations give average aspect ratios that are ca. 5% lower than those of the respective DFT optimised structures of the all-trans conformations, illustrating a possible limitation of using a single structure to assess the shapes of flexible molecules that explore a range of conformations at ambient temperatures. The trend in the aspect ratios also generally matches the trend in the Sθ (dye) values of the dyes, consistent with the generally accepted correlation between aspect ratio and molecular alignment.
Molecular and TDM alignment contributions to the calculated dichroic order parameters
The calculated dichroic order parameters of the TDMs of the dyes in the E7 host, Sϕ, can be calculated as the product of the values of Sθ (dye) from the MD simulations (Table 3) and the values of Sβ from our earlier TD-DFT calculations (Fig. 3),16 in accordance with eqn (3). These calculated values of Sϕ are listed in Table 4, and they can be compared directly with the experimental dichroic order parameters, Sexptl, as shown graphically in Fig. 13.| Dye | S ϕ |
|---|---|
| 15SB3 | 0.829 |
| 15NB3 | 0.794 |
| 15NB3OH | 0.748 |
| 26B3 | 0.853 |
| 26B3OH | 0.894 |
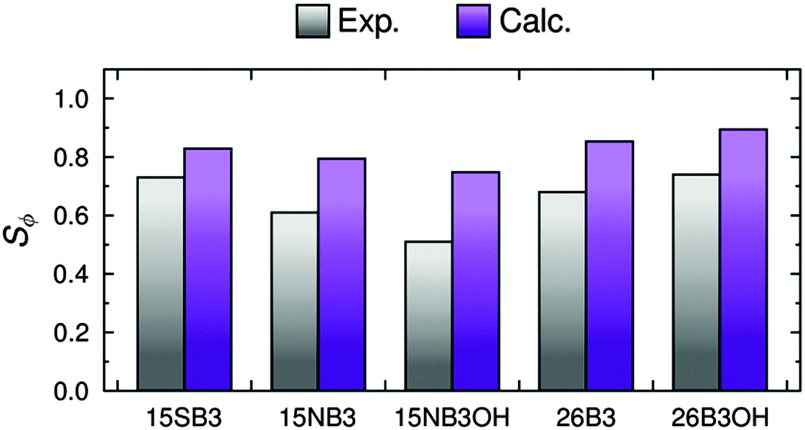 | ||
| Fig. 13 Experimental and calculated dichroic order parameters, Sexptl and Sϕ, respectively. | ||
The trend in the calculated dichroic order parameters generally matches the trend in the experimental values, as shown in Fig. 13. The absolute values of the calculated order parameters are higher than the experimental values, which is consistent with the alignment of the host molecules being overestimated in the MD simulations resulting in overestimated values of Sθ (dye), as discussed above. Although the calculated dichroic order parameters overestimate the experimental values, the ability of the combined MD and DFT approach to provide a general match with the experimental trend indicates that it may be able to provide a useful approach to rationalising experimental trends in guest–host systems generally.
In order to visualise the contributions to the calculated dichroic order parameters of the dyes studied here, the calculated orientations of the long molecular axes of the host and dye molecules versus the host director, and of the TDM vectors versus the long molecular axes of the dyes, are presented schematically in Fig. 14, in the same style as shown for a general system in Fig. 2.
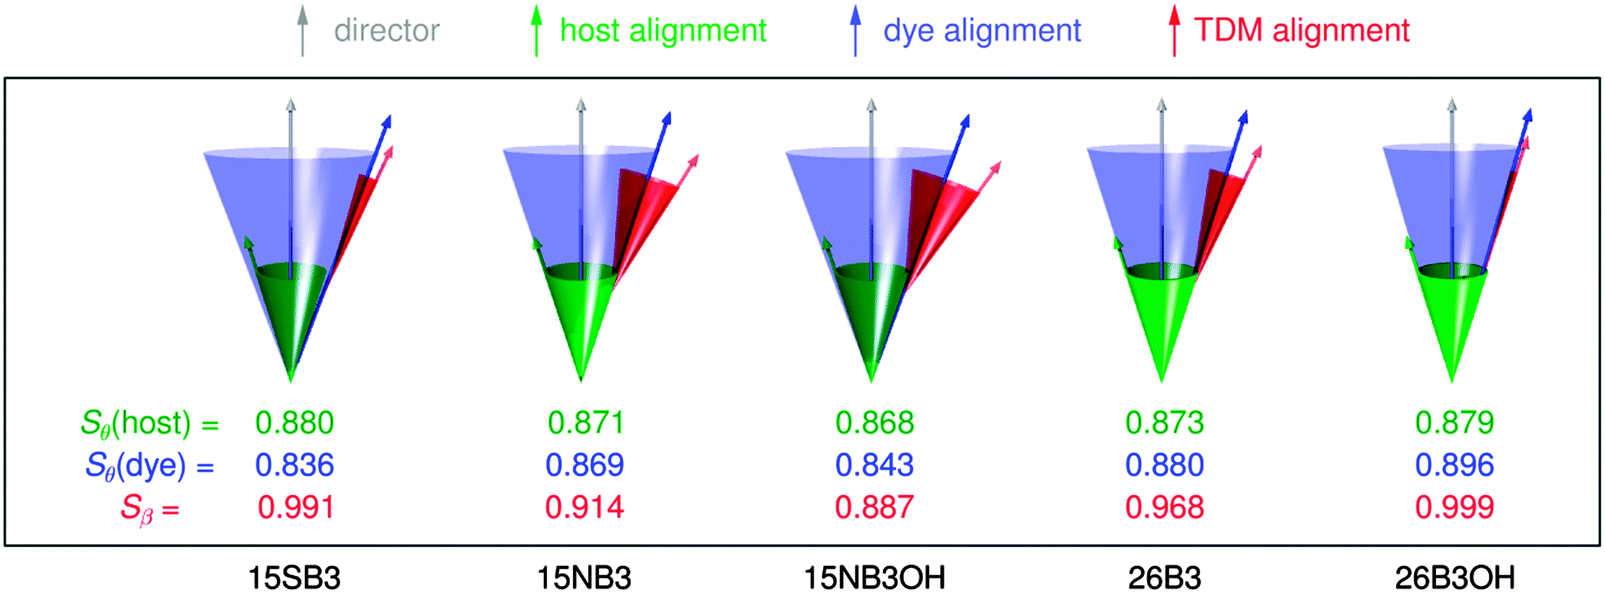 | ||
| Fig. 14 Schematic representation of the relative calculated contributions of the molecular alignment (blue) and the TDM alignment (red) of the dyes to the overall TDM alignment versus the host director (grey), along with the molecular alignment of the host (green). The molecular alignment arrows and cones in this pictorial representation are drawn at single angles corresponding to those that would derive from a hypothetical δ-distribution,88 whereas the values of Sθ actually arise from a range of angles, θ, in the simulations, as shown in the ESI.† | ||
The calculations suggest that the primary factor limiting the dichroic order parameters of the guest–host systems studied here is the molecular alignment of the dyes within the host, as illustrated schematically by the blue arrows and cones in Fig. 14; they indicate that the molecular alignment is similar for all of the dyes, and similar to that of E7, which is shown in green. The calculations also indicate that the variation in the dichroic order parameters between the dyes can be attributed principally to differences in the relative orientations of the TDMs within the dyes, as shown in red in Fig. 14. Hence, these calculated results indicate that a different host with a higher order parameter could increase the dichroic order parameters of the whole set of dyes, and that the orientation of the TDM within the dye molecule is a key design feature that must be optimised to obtain a high dichroic order parameter for a particular dye. These general approaches to guest–host design are already well established from reported experimental work, but here they emerge independently from the calculations, illustrating the potential use of this computational approach for design applications. In particular, the ability to provide a computational assessment of the separate contributions from the alignment of the guest molecules in a host and the alignment of the TDM with a dye molecule may open a route to the rational design of guest dyes.
Considering the dyes studied here, the calculations enable the low experimental dichroic order parameters of 15NB3 and 15NB3OH to be rationalised mainly by their large TDM angles, β, with an additional contribution from having a slightly lower molecular alignment than the E7 host. Conversely, the high experimental dichroic order parameters of 26B3 and 26B3OH can be rationalised mainly by their small β values, with an additional contribution from a slightly higher molecular alignment than the host. The calculations indicate that the primary reason for the high experimental dichroic order parameter of 15SB3 is its small TDM angle, β, rather than a high degree of molecular alignment, which the calculations would appear to underestimate relative to those of the other dyes.
Conclusions
The experimental dichroic order parameters obtained for a set of structurally related anthraquinone dyes in the nematic host E7 show significant differences in the alignments of the TDM vectors of the dyes in the host that may be attributed to the effects of the different substituents. Calculations on model compounds have shown that phenyl–sulfide and –amine substituent linking groups exhibit significant flexibility, with the amine being the more flexible, and force constants have been determined for these groups. MD simulations of each of the dyes in E7, under conditions comparable to those used experimentally, have enabled calculated molecular order parameters to be obtained and assessed for both guest and host molecules. The calculated molecular order parameters of the dyes have been combined with the calculated TDM order parameters, reported previously, to give calculated dichroic order parameters. The trend in the calculated dichroic order parameters generally matches that in the experimental values, enabling the experimental trend to be rationalised principally by variations in the TDM alignments within the dye molecules, with variations in the molecular alignments being relatively small.In this work, the overestimation of the calculated dichroic order parameters is attributed principally to the overestimation of the alignment of host molecules in the MD simulations. The calculations presented here used default or literature intermolecular force constants for the host, and they have enabled a meaningful comparison of the behaviour of different dyes within a nematic environment, with parameterisation being carried out only on the flexible groups within the dyes for which appropriate default or literature values were not available.
The results have demonstrated that a combination of MD and DFT computational methods enables the contributions of the molecular alignment and the TDM alignment to be considered independently across a set of dyes, providing information that is not readily obtainable from experimental data. Such information is extremely useful from the perspective of molecular design because it opens the possibility of directing synthetic efforts towards target structures that are calculated to optimise both of these contributions to the overall TDM alignment of guest dyes in a host. The computational approach demonstrated here offers this type of predictive capability, and the scope for its application is wide because there are no inherent barriers to using it to simulate the alignment of any guest molecule within E7, or another similarly rigorously studied liquid crystal host, without the need to synthesise the guest molecule in question. The methods presented here therefore provide a step towards computational screening of the relative alignment properties of compounds for use in guest–host systems.
Acknowledgements
This work was supported by an EPSRC DTA studentship (EP/J500598/1), EPSRC grant EP/M020584/1 for the development of dyes for liquid crystal applications, and EPSRC Platform Grant EP/D055261/1 and EPSRC grant EP/J007714/1 for the development of liquid crystals for displays. Additionally, we thank The Technology Partnership (UK) and Halation (China) for support on the development of the synthesis of dyes. Data from this article are available by request from the University of York Data Catalogue at http://dx.doi.org/10.15124/09be4b46-07a8-4b4c-826c-5fc5f0fd0ed3.References
- G. H. Heilmeier and L. A. Zanoni, Appl. Phys. Lett., 1968, 13, 91–92 CrossRef CAS.
- B. Bahadur, in Handbook of Liquid Crystals, ed. D. Demus, J. W. Goodby, G. W. Gray, H. W. Spiess and V. Vill, Wiley-VCH, Weinheim, 1998, vol. 2 A, pp. 257–302 Search PubMed.
- T. Uchida, H. Seki, C. Shishido and M. Wada, Proc. SID, 1981, 22, 41–46 Search PubMed.
- M. G. Debije, Adv. Funct. Mater., 2010, 20, 1498–1502 CrossRef CAS.
- A. M. Kendhale, A. P. H. J. Schenning and M. G. Debije, J. Mater. Chem. A, 2013, 1, 229–232 CAS.
- M. R. Lutfor, G. Hegde, S. Kumar, C. Tschierske and V. G. Chigrinov, Opt. Mater., 2009, 32, 176–183 CrossRef CAS.
- Q. K. Liu, C. Beier, J. Evans, T. Lee, S. L. He and I. I. Smalyukh, Langmuir, 2011, 27, 7446–7452 CrossRef CAS PubMed.
- C. Carrasco-Vela, X. Quintana, E. Oton, M. A. Geday and J. M. Oton, Opto-Electron. Rev., 2011, 19, 496–500 Search PubMed.
- E. Peeters, J. Lub, J. A. M. Steenbakkers and D. J. Broer, Adv. Mater., 2006, 18, 2412–2417 CrossRef CAS.
- B. Bahadur, in Liquid Crystals: Applications and Uses, ed. B. Bahadur, World Scientific Publishing Co. Pte. Ltd., Singapore, 1992, vol. 3, pp. 65–208 Search PubMed.
- K. J. Rothschild and N. A. Clark, Biophys. J., 1979, 25, 473–487 CrossRef CAS PubMed.
- M. van Gurp, Colloid Polym. Sci., 1995, 273, 607–625 CAS.
- F. Jones and T. J. Reeve, J. Soc. Dyers Colour., 1979, 95, 352–359 CrossRef CAS.
- B. Bahadur, R. K. Sarna and V. G. Bhide, Mol. Cryst. Liq. Cryst., 1981, 75, 121–132 CrossRef CAS.
- H. Seki, T. Uchida and Y. Shibata, Mol. Cryst. Liq. Cryst., 1986, 138, 349–365 CrossRef CAS.
- M. T. Sims, L. C. Abbott, S. J. Cowling, J. W. Goodby and J. N. Moore, J. Phys. Chem. C, 2016, 120, 11151–11162 CAS.
- G. Pelzl, H. Zaschke and D. Demus, Displays, 1985, 6, 141–147 CrossRef CAS.
- E. Wolarz, H. Moryson and D. Bauman, Displays, 1992, 13, 171–178 CrossRef CAS.
- M. Matsui, N. Tanaka, N. Andoh, K. Funabiki, K. Shibata, H. Muramatsu, Y. Ishigure, E. N. Kohyama, Y. Abe and M. Kaneko, Chem. Mater., 1998, 10, 1921–1930 CrossRef CAS.
- M. Matsui, K. Shirai, N. Tanaka, K. Funabiki, H. Muramatsu, K. Shibata, Y. Abe and Y. Ohgomori, J. Mater. Chem., 1999, 9, 2755–2763 RSC.
- I. Grabchev, I. Moneva, V. Bojinov and S. Guittonneau, J. Mater. Chem., 2000, 10, 1291–1296 RSC.
- M. Matsui, S. Okada, M. Kadowaki and M. Yamada, Liq. Cryst., 2002, 29, 707–712 CrossRef CAS.
- V. B. Bojinov and I. K. Grabchev, Org. Lett., 2003, 5, 2185–2187 CrossRef CAS PubMed.
- Z. H. Chen and T. M. Swager, Org. Lett., 2007, 9, 997–1000 CrossRef CAS PubMed.
- H. Seki, C. Shishido, S. Yasui and T. Uchida, Jpn. J. Appl. Phys., Part 1, 1982, 21, 191–192 CrossRef CAS.
- H. Seki, T. Uchida and C. Shishido, Jpn. J. Appl. Phys., 1980, 19, L501–L503 CrossRef CAS.
- G. W. Gray, Dyes Pigm., 1982, 3, 203–209 CrossRef CAS.
- J. Griffiths and K.-C. Feng, J. Mater. Chem., 1999, 9, 2333–2338 RSC.
- S. Imazeki, Mol. Cryst. Liq. Cryst., 1986, 140, 119–130 CrossRef CAS.
- F. C. Saunders, K. J. Harrison, E. P. Raynes and D. J. Thompson, IEEE Trans. Electron Devices, 1983, 30, 499–503 CrossRef.
- H. Iwanaga, K. Naito and Y. Nakai, Mol. Cryst. Liq. Cryst., 2001, 364, 211–218 CrossRef CAS.
- H. Iwanaga, K. Naito and F. Aiga, J. Mol. Struct., 2010, 975, 110–114 CrossRef CAS.
- H. Iwanaga and F. Aiga, Liq. Cryst., 2011, 38, 135–148 CrossRef CAS.
- K. Naito and H. Iwanaga, Jpn. J. Appl. Phys., Part 1, 1998, 37, 3422–3427 CrossRef CAS.
- D. Jacquemin, E. Bremond, A. Planchat, I. Ciofini and C. Adamo, J. Chem. Theory Comput., 2011, 7, 1882–1892 CrossRef CAS PubMed.
- D. Jacquemin, E. Bremond, I. Ciofini and C. Adamo, J. Phys. Chem. Lett., 2012, 3, 468–471 CrossRef CAS PubMed.
- M. T. Sims, L. C. Abbott, S. J. Cowling, J. W. Goodby and J. N. Moore, Chem. – Eur. J., 2015, 21, 10123–10130 CrossRef CAS PubMed.
- A. Stroobants, H. N. W. Lekkerkerker and D. Frenkel, Phys. Rev. A: At., Mol., Opt. Phys., 1987, 36, 2929–2945 CrossRef CAS.
- J. A. C. Veerman and D. Frenkel, Phys. Rev. A: At., Mol., Opt. Phys., 1991, 43, 4334–4343 CrossRef.
- A. Poniewierski, Phys. Rev. A: At., Mol., Opt. Phys., 1992, 45, 5605–5613 CrossRef.
- J. T. Brown, M. P. Allen, E. Martín del Río and E. de Miguel, Phys. Rev. E: Stat. Phys., Plasmas, Fluids, Relat. Interdiscip. Top., 1998, 57, 6685–6699 CrossRef CAS.
- M. Villanueva-García, A. Martínez-Richa and J. Robles, Mol. Cryst. Liq. Cryst., 2006, 446, 245–254 CrossRef.
- M. I. Capar and E. Cebe, Phys. Rev. E: Stat., Nonlinear, Soft Matter Phys., 2006, 73, 061711 CrossRef PubMed.
- D. H. Song and J. P. Kim, Dyes Pigm., 2009, 80, 219–225 CrossRef CAS.
- J. B. Chang, J. H. Hwang, J. S. Park and J. P. Kim, Dyes Pigm., 2011, 88, 366–371 CrossRef CAS.
- J. B. Chang, S. B. Yuk, J. S. Park and J. P. Kim, Dyes Pigm., 2012, 92, 737–744 CrossRef CAS.
- M. Allen and M. Wilson, J. Comput. – Aided Mol. Des., 1989, 3, 335–353 CrossRef CAS PubMed.
- M. R. Wilson, Chem. Soc. Rev., 2007, 36, 1881–1888 RSC.
- G. Tiberio, L. Muccioli, R. Berardi and C. Zannoni, ChemPhysChem, 2009, 10, 125–136 CrossRef CAS PubMed.
- A. Pizzirusso, R. Berardi, L. Muccioli, M. Ricci and C. Zannoni, Chem. Sci., 2012, 3, 573–579 RSC.
- M. F. Palermo, A. Pizzirusso, L. Muccioli and C. Zannoni, J. Chem. Phys., 2013, 138, 204901 CrossRef PubMed.
- M. R. Wilson, J. Mol. Liq., 1996, 68, 23–31 CrossRef CAS.
- C. McBride, M. R. Wilson and J. A. K. Howard, Mol. Phys., 1998, 93, 955–964 CrossRef CAS.
- J. Peláez and M. Wilson, Phys. Chem. Chem. Phys., 2007, 9, 2968–2975 RSC.
- D. L. Cheung, S. J. Clark and M. R. Wilson, Phys. Rev. E: Stat., Nonlinear, Soft Matter Phys., 2002, 65, 051709 CrossRef CAS PubMed.
- N. J. Boyd and M. R. Wilson, Phys. Chem. Chem. Phys., 2015, 17, 24851–24865 RSC.
- O. M. Roscioni, L. Muccioli, R. G. Della Valle, A. Pizzirusso, M. Ricci and C. Zannoni, Langmuir, 2013, 29, 8950–8958 CrossRef CAS PubMed.
- M. F. Palermo, L. Muccioli and C. Zannoni, Phys. Chem. Chem. Phys., 2015, 17, 26149–26159 RSC.
- E. Kuprusevicius, R. Edge, H. Gopee, A. N. Cammidge, E. J. L. McInnes, M. R. Wilson and V. S. Oganesyan, Chem. – Eur. J., 2010, 16, 11558–11562 CrossRef CAS PubMed.
- F. Chami, M. R. Wilson and V. S. Oganesyan, Soft Matter, 2012, 8, 6823–6833 RSC.
- A. C. J. Weber, A. Pizzirusso, L. Muccioli, C. Zannoni, W. L. Meerts, C. A. de Lange and E. E. Burnell, J. Chem. Phys., 2012, 136, 174506 CrossRef PubMed.
- A. Pizzirusso, M. B. Di Cicco, G. Tiberio, L. Muccioli, R. Berardi and C. Zannoni, J. Phys. Chem. B, 2012, 116, 3760–3771 CrossRef CAS PubMed.
- A. Pizzirusso, M. E. Di Pietro, G. De Luca, G. Celebre, M. Longeri, L. Muccioli and C. Zannoni, ChemPhysChem, 2014, 15, 1356–1367 CrossRef CAS PubMed.
- S. J. Cowling, C. Ellis and J. W. Goodby, Liq. Cryst., 2011, 38, 1683–1698 CrossRef CAS.
- H. J. C. Berendsen, D. Vanderspoel and R. Vandrunen, Comput. Phys. Commun., 1995, 91, 43–56 CrossRef CAS.
- E. Lindahl, B. Hess and D. van der Spoel, J. Mol. Model., 2001, 7, 306–317 CAS.
- D. Van der Spoel, E. Lindahl, B. Hess, G. Groenhof, A. E. Mark and H. J. C. Berendsen, J. Comput. Chem., 2005, 26, 1701–1718 CrossRef CAS PubMed.
- B. Hess, C. Kutzner, D. van der Spoel and E. Lindahl, J. Chem. Theory Comput., 2008, 4, 435–447 CrossRef CAS PubMed.
- W. L. Jorgensen, D. S. Maxwell and J. TiradoRives, J. Am. Chem. Soc., 1996, 118, 11225–11236 CrossRef CAS.
- G. A. Kaminski, R. A. Friesner, J. Tirado-Rives and W. L. Jorgensen, J. Phys. Chem. B, 2001, 105, 6474–6487 CrossRef CAS.
- G. Bussi, D. Donadio and M. Parrinello, J. Chem. Phys., 2007, 126, 014101 CrossRef PubMed.
- M. Parrinello and A. Rahman, J. Appl. Phys., 1981, 52, 7182–7190 CrossRef CAS.
- T. Darden, D. York and L. Pedersen, J. Chem. Phys., 1993, 98, 10089–10092 CrossRef CAS.
- U. Essmann, L. Perera, M. L. Berkowitz, T. Darden, H. Lee and L. G. Pedersen, J. Chem. Phys., 1995, 103, 8577–8593 CrossRef CAS.
- B. Hess, J. Chem. Theory Comput., 2008, 4, 116–122 CrossRef CAS PubMed.
- M. J. Frisch, G. W. Trucks, H. B. Schlegel, G. E. Scuseria, M. A. Robb, J. R. Cheeseman, G. Scalmani, V. Barone, B. Mennucci, G. A. Petersson, H. Nakatsuji, M. Caricato, X. Li, H. P. Hratchian, A. F. Izmaylov, J. Bloino, G. Zheng, J. L. Sonnenberg, M. Hada, M. Ehara, K. Toyota, R. Fukuda, J. Hasegawa, M. Ishida, T. Nakajima, Y. Honda, O. Kitao, H. Nakai, T. Vreven, J. J. A. Montgomery, J. E. Peralta, F. Ogliaro, M. Bearpark, J. J. Heyd, E. Brothers, K. N. Kudin, V. N. Staroverov, R. Kobayashi, J. Normand, K. Raghavachari, A. Rendell, J. C. Burant, S. S. Iyengar, J. Tomasi, M. Cossi, N. Rega, J. M. Millam, M. Klene, J. E. Knox, J. B. Cross, V. Bakken, C. Adamo, J. Jaramillo, R. Gomperts, R. E. Stratmann, O. Yazyev, A. J. Austin, R. Cammi, C. Pomelli, J. W. Ochterski, R. L. Martin, K. Morokuma, V. G. Zakrzewski, G. A. Voth, P. Salvador, J. J. Dannenberg, S. Dapprich, A. D. Daniels, Ö. Farkas, J. B. Foresman, J. V. Ortiz, J. Cioslowski and D. J. Fox, Gaussian 09, Revision B.01, Gaussian Inc., Wallingford CT, 2009 Search PubMed.
- P. F. Bernath, Spectra of Atoms and Molecules, Oxford University Press, Oxford, 2005 Search PubMed.
- A. Bondi, J. Phys. Chem., 1964, 68, 441–451 CrossRef CAS.
- H. Hu, Z. Y. Lu and W. T. Yang, J. Chem. Theory Comput., 2007, 3, 1004–1013 CrossRef CAS PubMed.
- C. T. Lee, W. T. Yang and R. G. Parr, Phys. Rev. B: Condens. Matter Mater. Phys., 1988, 37, 785–789 CrossRef CAS.
- A. D. Becke, J. Chem. Phys., 1993, 98, 5648–5652 CrossRef CAS.
- R Core Team R: A Language and Environment for Statistical Computing, R Foundation for Statistical Computing, Vienna, Austria, 2014, URL: http://www.R-project.org/ Search PubMed.
- F. Würthner, T. E. Kaiser and C. R. Saha-Möller, Angew. Chem., Int. Ed., 2011, 50, 3376–3410 CrossRef PubMed.
- A. Ghanadzadeh Gilani, M. Moghadam, M. S. Zakerhamidi and E. Moradi, Dyes Pigm., 2012, 92, 1320–1330 CrossRef CAS.
- A. G. Gilani, M. Salmanpour and T. Ghorbanpour, J. Mol. Liq., 2013, 179, 118–123 CrossRef CAS.
- A. Ghanadzadeh, A. Zeini, A. Kashef and M. Moghadam, Spectrochim. Acta, Part A, 2009, 73, 324–329 CrossRef CAS PubMed.
- H. Iwanaga, Materials, 2009, 2, 1636–1661 CrossRef CAS.
- A. F. Runge, S. S. Saavedra and S. B. Mendes, J. Phys. Chem. B, 2006, 110, 6721–6731 CrossRef CAS PubMed.
Footnote |
| † Electronic supplementary information (ESI) available. See DOI: 10.1039/c6cp03823a |
| This journal is © the Owner Societies 2016 |