
 Open Access Article
 This Open Access Article is licensed under a
 Creative Commons Attribution 3.0 Unported Licence
Acidity constants and redox potentials of uranyl ions in hydrothermal solutions
Xiandong
Liu
*ab,
Jun
Cheng
*cd,
Mengjia
He
a,
Xiancai
Lu
a and
Rucheng
Wang
a
aState Key Laboratory for Mineral Deposits Research, School of Earth Sciences and Engineering, Nanjing University, Nanjing 210093, P. R. China. E-mail: xiandongliu@nju.edu.cn; Fax: +86 25 83686016; Tel: +86 25 89680700
bDepartment of Chemistry, University of Cambridge, Cambridge CB2 1EW, UK
cCollege of Chemistry and Chemical Engineering, Xiamen University, Xiamen 361005, P. R. China
dDepartment of Chemistry, University of Aberdeen, Aberdeen AB24, 3UE, UK. E-mail: Jcheng@abdn.ac.uk; Fax: +44 (0)1224 272921; Tel: +44 (0)1224 272089
First published on 24th August 2016
Abstract
We report a first principles molecular dynamics (FPMD) study of the structures, acidity constants (pKa) and redox potentials (E0) of uranyl (UO22+) from ambient conditions to 573 K. It is found that UO22+ keeps five coordination up to 573 K whereas UO2+ transforms from 5 to 4-coordinate as temperature increases to 573 K. The FPMD-based vertical energy gap method is used to derive pKas and E0s. The method is validated by comparing with available experimental data (for E0 under the ambient conditions and for pKas from ambient conditions to 367 K), with an uncertainty of 1–2 pKa units and 0.2 V for pKa and E0. The encouraging results demonstrate that the method may be used to predict the pH–Eh diagrams of f-block elements under the conditions of hydrothermal solutions. The results show that the acidity constants of uranyl decrease with temperature and are lower than 3.0 when the temperature is above 473 K, indicating that hydrolytic forms are dominant for U(VI) in the near neutral pH range. The reduction potential increases with temperature, indicating that the reduced state is more significant at higher temperatures.
1. Introduction
Knowledge of the aqueous speciation of uranium is crucial for understanding the properties and behavior of uranium in geo-fluids, sediments, and geological disposal sites for nuclear wastes.1 It has been accepted that changes in acid–base and redox conditions (i.e. pH and Eh) in geological environments play a key role in the transport and deposition of uranium.2,3 Protonation states of U-containing complexes change with the environmental pH, which influences complexation and fixation at mineral–water interfaces.4 The increase in pH and the decrease in Eh facilitate the reduction of U(VI) to U(IV), leading to the precipitation of solid phases.Numerous studies have been carried out to investigate the aqueous properties of uranyl ions,1,5–7 as they are believed to be the most common uranium species in the supergene environment. Under ambient conditions, uranyl ions have 5 1st-shell H2O ligands, i.e. UO2(H2O)52+. The aqueous uranyl ion is a weak acid. A pKa value of 5.2 is recommended by a review5 and 5.58 has been obtained by the latest experiment.8 The reduction potential of the UO22+/UO2+ couple is 0.062 V. UO2+ is not stable in water because it rapidly disproportionates to UO22+ and U4+. Recently, increasing evidence has shown that UO2+ can be stabilized by mineral surfaces.9,10
Uranium species often exist in the geological environments with a large variation of temperature. In deep geological repositories of nuclear wastes, the temperature can reach 200 °C due to radioactive effects.11 It is common that in crustal fluids, the temperature is several hundred degrees. However, the aqueous properties of uranyl ions have been poorly documented under the conditions of elevated temperatures and pressures.1 The hydration structures of UO22+ and UO2+ have not been reported as yet at higher T–P. The direct measurement of the acidity constant of uranyl ions is carried out only up to 367.4 K8 and the reduction potentials have not been measured at elevated temperatures.1,5
Quantum chemistry methods combined with continuum solvent models12–14 have been successfully applied to predict pKa and E0 of many species including transition metal complexes.15–22 For example, Steele et al. calculated E0 of UO22+/UO2+ being 0.14 V vs. SHE (standard hydrogen electrode).23 Hay et al. predicted the 1st pKa of UO22+ to be 9.6.24 However, it is hard to extend these solvent models to high P–T conditions because they are parameterized under the ambient conditions. Furthermore, since continuum models often ignore the atomic level details of the solvated structures, it is difficult, if not impossible, to predict possible structural transformations of metal complexes at elevated temperature.
Density functional theory based first principles molecular dynamics (FPMD) treats the solutes and the solvents on the same level of electronic structure theory25,26 and is a suitable tool for studying metal complexes under the T–P conditions relevant to geo-fluids, e.g.ref. 27–37. As a hard acid, uranyl ions favor complexing with hard base ligands, e.g. H2O, F−, and CO32−. It has been accepted that uranyl ion–carbonate complexes predominate in near-neutral solutions at equilibrium with the atmosphere.7 Bühl et al. successfully applied FPMD to investigate the complexing of UO22+ with both inorganic and organic ligands.38–41 The Car–Parrinello MD based metadynamics method was used to investigate the hydration structures and the hydrolysis of uranium, plutonium and curium ions under ambient conditions and favorable agreement was found between the simulation results and the experiment.42–44
The group of Sprik has developed a FPMD based vertical energy gap method for calculating redox potentials and acidity constants.45–49 Tests on molecular acids and metal cations indicate that for pKa calculations, an accuracy of 2 pKa units can be achieved by GGA functionals (i.e. generalized gradient approximation)28,50–52 and no noticeable differences have been found for GGA and hybrid functionals.45 It has however been found that GGA functionals often underestimate redox potentials due to the delocalization error that exaggerates the hybridization of the localized states of the solutes and the extended band states (i.e. the valence band) of the solvents in FPMD simulations.53–57 The errors correlate with the proximity of the redox potentials and the valence band position; the more positive the redox potentials, i.e. closer to the water valence band, the larger the errors. The accuracy can be improved by using hybrid functionals mixing a fraction of the Hartree–Fock exchange, such as the HSE06 functional.58,59 For the couples with low reduction potentials (e.g., CO2˙−/CO2), GGA functionals have a similar accuracy to hybrid functionals.
Using this method, we calculated the acidity constants of molybdic acid, arsenites and thioarsenites from room temperature to 573 K, and the results showed that the computed pKas agree with experiment within 2 pKa units.28,60,61 These studies give us confidence that the effect of temperature on acidity constants can be reproduced at a reasonable accuracy with the present setup.
In this study, we employ FPMD techniques to investigate the structures, acidity constants and reduction potentials of UO22+ at elevated temperatures up to 573 K. The hydration structures of UO22+ and UO2+ have been characterized in detail. The pKas and redox potentials are calculated using the FPMD based vertical energy gap technique. The favorable agreement with available experimental measurements is encouraging for extending the current method for studying the speciation of f-block elements.
2. Methodology
2.1. Models
The unit cell for all the simulations in this work is a cubic box of 12.43 Å under full 3D periodic boundary conditions. Under ambient conditions, the cell contains 63 H2O molecules, which approximately corresponds to the density of liquid water. The number of water molecules at each elevated temperature (Table 1) reproduces the density of the liquid phase at the corresponding saturated vapor pressure.62 The initial configurations were prepared by placing UO2(H2O)52+/+ complexes at the center of the cell and then inserting appropriate numbers of water molecules around the complexes, and then optimizing and equilibrating with MD simulations.| T–P | Number of H2O molecules |
|---|---|
| Ambient | 63 |
| 373 K–0.1 MPa | 61 |
| 473 K–1.55 MPa | 53 |
| 573 K–8.59 MPa | 43 |
2.2. FPMD details
The FPMD simulations were performed using the freely available CP2K/QUICKSTEP package.26 In QUICKSTEP, the electronic structures are calculated with density functional theory implemented based on a hybrid Gaussian plane wave (GPW) approach.63 The PBE functional was used in this work.64 The core electrons are represented by analytic Goedecker–Teter–Hutter (GTH) pseudopotentials,65,66 and double-ζ basis sets augmented with polarization functions were employed for H, O and U. The pseudopotential and the basis set for U have been successfully applied on a uranium dioxide bulk system.67,68 The plane wave density cutoff was set to be 400 Ry.Born–Oppenheimer molecular dynamics (BOMD) simulations were carried out with a time step of 0.5 fs. The temperature was controlled using the Nosé–Hoover chain thermostat. For each simulation, the production run was performed for at least 5.0 ps following a prior equilibration for at least 2.0 ps.
2.3 pKa calculations
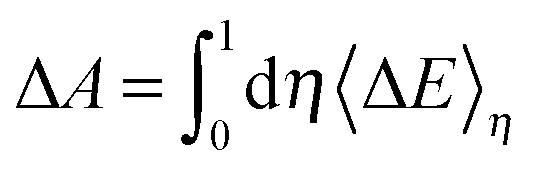
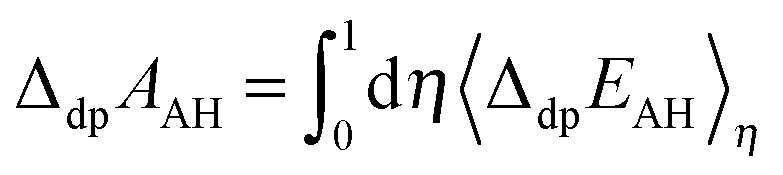
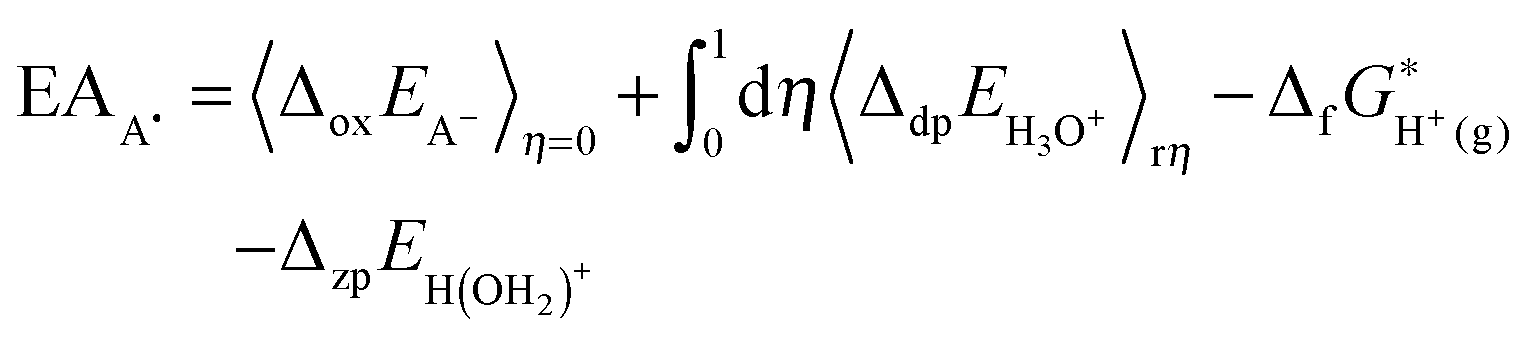
Using the vertical energy gap method, the proton of the acid (denoted AH) is gradually transformed into a dummy atom (i.e. a classical particle with no charge) and the free energy of this transformation (denoted ΔdpAAH) is evaluated by using the thermodynamic integration technique (Section 2.5). The same procedure is applied to transform a proton of a hydronium located in a simulation cell of the same size into a dummy. The corresponding deprotonation integral is denoted ΔdpAH3O+.The formula used to calculate pKa reads:
2.30kBTpKa = ΔdpAHA − ΔdpAH3O+ + kBT![[thin space (1/6-em)]](https://www.rsc.org/images/entities/char_2009.gif) ln[c0ΛH+3] ln[c0ΛH+3] | (1) |
ln[c0ΛH+3] accounts for the translational entropy generated by the acid dissociation, which is approximated by the free energy of a free proton at the standard concentration. This term is equal to −0.19 eV under ambient conditions.69
2.4. Redox potential
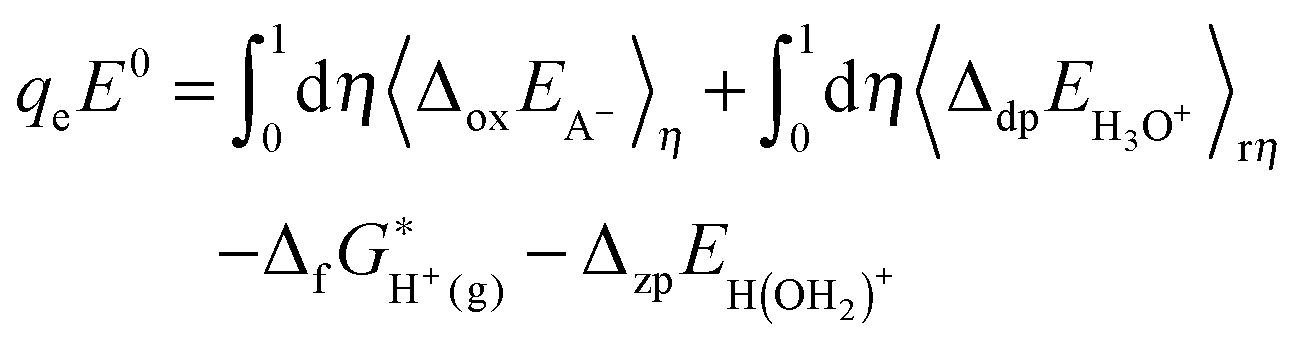
The redox potential of a redox couple (A−/A˙) with respect to SHE is calculated with: | (2) |
 stands for the formation free energy of the gas-phase proton and the values at different temperatures can be found from thermodynamics tables70 and listed in Table 3. ΔzpEH(OH2)+ denotes the zero point energy correction.
2.5. Free energy perturbation method
The free energy changes for the electron transfer (ET) and proton transfer (PT) reactions are calculated with a combination of FPMD and thermodynamic integration. According to this implementation, the reactant is gradually transformed into the product using an auxiliary Hamiltonian:| Hη = (1 − η)HR + ηHP + Vr | (3) |
 | (4) |
| Acid | n d | d 0 | k d | n α | α 0 | k α |
|---|---|---|---|---|---|---|
| UO2(H2O)52+ | 1 | 1.89 (O–Hd) | 0.1 | 2 | 1.87 (H–O–Hd) | 0.1 |
| 2.06 (U–O–Hd) | 0.1 |
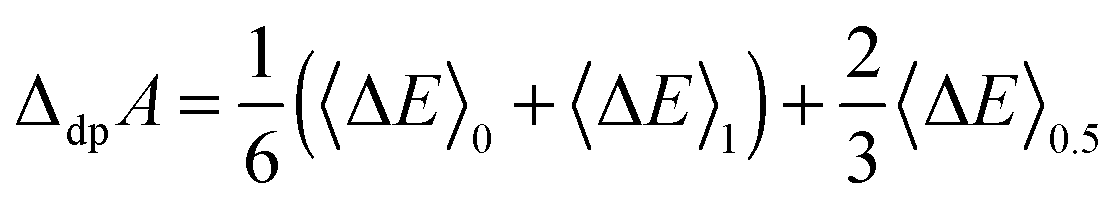
The free energy change of the transformation is calculated from the integral of the vertical energy gap with respect to the coupling parameter:
 | (5) |
For ET reactions, the energy gap is the vertical ionization energy and the oxidation free energy is calculated from,
 | (6) |
 | (7) |
 | (8) |
 | (9) |
 | (10) |
 | (11) |
In those equations, the integrals are computed by using the thermodynamic integration. The used value of ΔzpEH(OH2)+ is 0.35 eV, which is obtained from a previous study.47 The values of the other terms including ΔdpAH3O+, kBTln[c0ΛH+3] and  are summarized in Table 3.
ln[c0ΛH+3] and  at different temperatures. The energy unit is eV
| ΔdpAH3O+ |
k
B
Tln[c0ΛH+3] |
|
|
|---|---|---|---|
| 330 K | 15.35 | −0.19 | 15.81 |
| 363 K | 15.30 | −0.23 | 15.79 |
| 473 K | 14.76 | −0.30 | 15.76 |
| 573 K | 14.11 | −0.36 | 15.71 |

The vertical energy levels can also be aligned with respect to the SHE by using eqn (11), so that they can be compared with the band edges of liquid water.48 In that case, the EA (electron affinity) and IP (ionization potential) levels of the solutes are written as,
 | (12) |
 | (13) |
As shown in our previous publications,45,47,52,54 finite size effects are not the dominant source of error due to the effective screening of liquid water.
Screening in polar liquids is taken into account by the Born cavity model. With the extension under periodic boundary conditions by Hummer et al.,71–75 the correction to the free energy has the following form:
| ΔAL = q2ξEW/2εL − (1 − 1/ε)2πq2R2/3L3 | (14) |
The first term effectively vanishes for aqueous ions due to the high dielectric constant (ε > 80). The second term determines in practice the finite size error, i.e. the error for the oxidation or hydrolysis of Mq+ is proportional to (q + 1)2 − q2 (or equivalently q2 − (q − 1)2). The correction to the redox free energy of the reaction with the net charge change from 1 to 0 such as OH˙/OH− is estimated to be less than 0.1 eV with a box of 9.86 Å, which is within the statistical uncertainty of the FPMD simulations. Notice that in the formulae for pKa and E0 calculations (eqn (10) and (11)), there is an effective error cancellation with the deprotonation reaction of H3O+ (its charge changes from +1 to 0). Such an approach also applies for the reactions for M2+/M1+ or M2−/M−. This has been evidenced by our calculations, e.g. for pKa for HS− (i.e. HS−/S2−),45 the error is found to be less than 0.1 eV (17.1 vs. 17.0). Here for UO22+, with a side length of 12.43 Å, L3 is twice larger than that with a side length of 9.86 Å. The finite size error is further reduced, and therefore we did not include any correction to the results.
3. Results
3.1 Hydration structures
UO22+ has 5 water molecules in the first hydration shell from room temperature to 573 K (Fig. 1A and 2A). For UO22+, the two U![[double bond, length as m-dash]](https://www.rsc.org/images/entities/char_e001.gif) Oax bonds are centered at 1.8 Å, agreeing with the experimental values of 1.76–1.77 Å.76–79 U–OH2O (i.e. the first hydration shells of UO22+) are centered at around 2.42 Å, in close agreement with experiment (2.40–2.42 Å)76–79 and previous FPMD simulations (2.44–2.46 Å).80
Oax bonds are centered at 1.8 Å, agreeing with the experimental values of 1.76–1.77 Å.76–79 U–OH2O (i.e. the first hydration shells of UO22+) are centered at around 2.42 Å, in close agreement with experiment (2.40–2.42 Å)76–79 and previous FPMD simulations (2.44–2.46 Å).80
 | ||
| Fig. 1 RDFs (radial distribution functions) and CNs (coordination numbers) for U–O derived from the simulations of UO22+ and UO2+. | ||
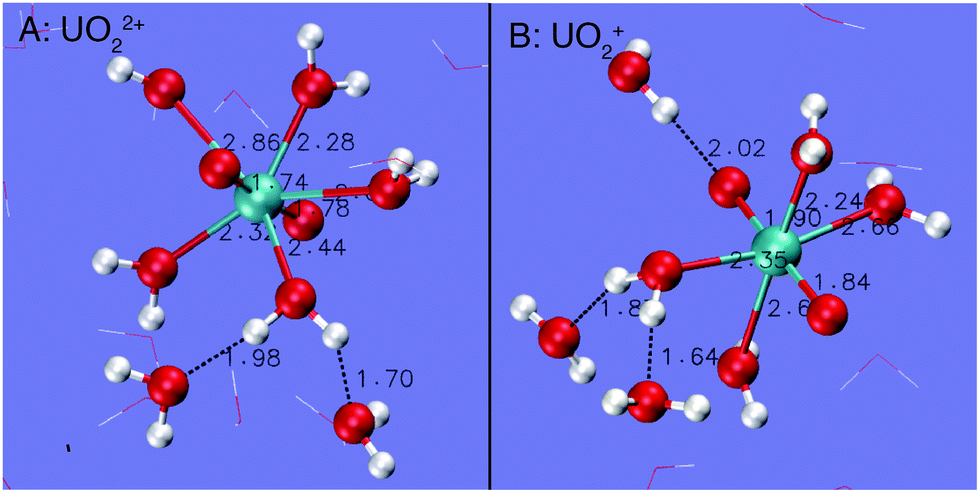 | ||
| Fig. 2 Snapshots of UO22+ and UO2+ derived from the simulations at 573 K. Some water molecules have been removed for clarity. O = red, H = white and U = blue. | ||
From room temperature to 473 K, UO2+ has 5 H2O ligands. The UOax and U–OH2O bond lengths are peaked at 1.86 Å and 2.54 Å (Fig. 1B), respectively, coinciding with previous simulations (1.78–1.83 Å and 2.51–2.62 Å, respectively).42,81–84 At 573 K, UO2+ loses 1 H2O ligand and the central U ion transforms into 6-coordinated. Consequently, the U–OH2O distance decreases to 2.48 Å (see Fig. 1B and the snapshot in Fig. 2B).
Fig. 3 depicts the RDFs and CNs of water O around H of the H2O ligands of UO22+ and UO2+. For both cations under ambient conditions, each H of the H2O ligands donates one H-bond to the solvent water. The distance of the H-bond for UO2+ is centered at around 1.70 Å, which is slightly longer than that for UO22+, i.e. 1.60 Å. As temperature increases to 573 K, the CNs of the H-bonds for both cations decrease to 0.7–0.8 on average.
 | ||
| Fig. 3 RDFs (radial distribution functions) and CNs (coordination numbers) for water O around H of 1st shell H2O ligands of UO22+ and UO2+. | ||
The O of UO22+ hardly accepts H-bonds from solvent water (Fig. 4A). The RDF–CN curves indicate that some H atoms in water are occasionally present in the H-bond range. In contrast, the O of UO2+ can have two H-bonds under ambient conditions (see the snapshot in Fig. 2B and the RDF–CN in Fig. 4B) and at higher temperatures, the average CN of H-bonds decreases to 1.
 | ||
| Fig. 4 RDFs (radial distribution functions) and CNs (coordination numbers) for water H around O of UO22+ and UO2+. | ||
3.2. Acidity constants
Table 4 lists the vertical energy gaps, thermodynamic integrals and pKas for UO22+. It can be seen that all of the vertical energy gaps converge within 0.1 eV and the statistical errors in pKas are within 1 pKa unit. Under ambient conditions, the calculated pKa is 5.8, in good agreement with the latest experiment, 5.58.8 The pKa at 373 K is calculated to be 4.0, which is very close to the values measured at slightly lower temperatures, 4.19 at 367.4 K85 and 4.24 at 358.15 K.8 The pKa values show a decreasing trend with temperature. A similar trend has also been found for other complexes, such as Fe(H2O)3+86 and H3AsO3.61 At 473 K and 573 K, the pKas are 2.8 and 1.4, respectively.
| η = 0 | η = 0.5 | η = 1.0 | Integral | pKas | |
|---|---|---|---|---|---|
| Statistical error in the vertical energy gap is calculated as the semi-difference between the values using the first half or the second half of the trajectory only.a The values were measured at slightly lower temperatures than 373 K, 4.19 at 367.4 K85 and 4.24 at 358.15 K.8 | |||||
| 300 K | 13.14 ± 0.02 | 16.16 ± 0.02 | 17.86 ± 0.01 | 15.94 ± 0.02 | 5.8 ± 0.3 (5.58) |
| 373 K | 13.14 ± 0.10 | 16.09 ± 0.01 | 17.91 ± 0.01 | 15.90 ± 0.02 | 4.0 ± 0.3 (4.19, 4.24)a |
| 473 K | 13.13 ± 0.08 | 15.5 ± 0.07 | 17.32 ± 0.02 | 15.41 ± 0.06 | 2.8 ± 0.6 |
| 573 K | 12.66 ± 0.1 | 14.81 ± 0.09 | 16.57 ± 0.01 | 14.74 ± 0.08 | 1.4 ± 0.7 |
3.3. Redox potentials
The vertical energy gaps for reduction potential calculations are listed in Table 5. The energy levels of the solutes and liquid water are summarized in Table 6 and illustrated in Fig. 5. As shown in our previous study, PBE places the VBM (valence band maximum) of liquid water 3.2 V too high while it estimates the CBM (conduction band minimum) much better (by only 0.5 V too high).48 Due to the hybridization with the too high VBM of liquid water predicted by PBE, the IP level of the solute would also be at a too high position, which then leads to underestimation of the reduction potential. This error is more severe for the more oxidative solutes because the pining with the VBM of liquid water is worse.53 For UO22+/UO2+, the IP level predicted by PBE is 0.95 V (Table 6), over 1.3 V above the PBE water VBM, indicating that the negative effect of the band misalignment is relatively small on the solute levels. This is further confirmed by the energy level diagram (Fig. 5), where it clearly shows a symmetric distribution of IP and EA levels around the redox level (i.e. normal linear response from the Marcus picture88). As previously shown,53 pronounced asymmetry in reorganization energies (energy differences between vertical and redox levels) is a sign of the energy levels suffering from large delocalization errors.| η = 0 | η = 0.5 | η = 1.0 | Integral | E 0 | |
|---|---|---|---|---|---|
| Statistical error in the vertical energy gap is calculated as the semi-difference between the values using the first half or the second half of the trajectory only. | |||||
| 300 K | −0.22 ± 0.02 | 0.73 ± 0.02 | 1.76 ± 0.04 | 0.76 ± 0.02 | −0.05 ± 0.02 (0.062) |
| 373 K | −0.18 ± 0.07 | 1.04 ± 0.10 | 1.98 ± 0.02 | 0.99 ± 0.08 | 0.15 ± 0.08 |
| 473 K | 0.41 ± 0.02 | 1.54 ± 0.02 | 2.54 ± 0.03 | 1.55 ± 0.02 | 0.20 ± 0.02 |
| 573 K | 1.13 ± 0.01 | 2.18 ± 0.01 | 3.32 ± 0.02 | 2.2 ± 0.01 | 0.25 ± 0.01 |
| EA | IP | e 0 E 0 | ||
|---|---|---|---|---|
| a EA and IP of UO22+/UO2+ are obtained by using eqn (12) and (13), respectively. E0 is taken from Table 5. b The VBM is obtained by substituting the integral in eqn (13) with the vertical ionization potential of the water. The CBM is estimated based on orbital energies, i.e. by replacing the integral in eqn (12) with minus the average energy of the LUMO (the lowest unoccupied molecular orbital). c Ref. 48. | ||||
| UO22+/UO2+ | PBEa | −1.03 | 0.95 | −0.05 |
| Liquid water | CBM | VBM | ||
| PBEb | −2.60 | 2.31 | ||
| Exp.c | −3.2 | 5.5 | ||
 | ||
| Fig. 5 Energy level diagram for the UO22+/UO2+ couple under ambient conditions. CBM: water conduction band minimum, VBM: water valence band maximum, EA: vertical electron affinity of UO22+, IP: vertical ionization potential of UO2+, λ: reorganization energy, e0E0: reduction potential. The corresponding energy levels are listed in Table 6. | ||
We believe that this explains why the redox potential computed by PBE functional is reasonably in line with experiment (−0.05 V vs. 0.062 V) at room temperature, and the favorable agreement lends us confidence in the PBE results at elevated temperatures. It is also clear that the symmetric alignment of the energy levels remains at elevated temperatures (Table 5). As temperature increases, the redox potential gradually increases to 0.25 V at 573 K. The increasing trend is the same as that found for the Fe2+/Fe3+ couple.60 However, no experimental data are available for uranyl ions at elevated temperatures.
4. Discussion
It is believed that the crustal fluid is reductive because of the lack of oxygen. So, the increasing trend of redox potentials with the temperature indicates that the reduced state will get more populated at elevated temperatures compared to under ambient conditions. By considering the disproportionation nature of UO2+, aqueous U(IV) could be abundant in geo-fluids at higher temperatures. The acidity constants of UO22+ get very low beyond 373 K (i.e. pKas < 3.0 at 473 K and 573 K). This indicates that under those conditions, the dominant species are hydrolytic complexes instead of UO22+ in the near-neutral pH (the pH of neutral water is around 5.6 at both temperatures89). These findings should be taken into account in future research, such as the surface complexation of uranium. For example, a temperature of 473 K is possible at deep geological storage sites for high level nuclear wastes. However, previous studies only focus on the adsorption of UO22+ whereas little has been done on its hydrolytic forms or the reduced states.90It has been suggested that at elevated U concentration, polymeric complexes such as (UO2)2(OH)22+ and (UO2)3(OH)52+ may be formed.5,91 The entropic contribution gets more significant with increasing T, which is unfavorable to polymeric structures. However, there is no data available for temperatures over 373 K, and therefore it is still unclear if polymerization plays an important role in hydrothermal solutions. The free energies of uranyl ion complexes formed with other ligands (e.g. F− and CO32−.) are also lacking at high temperatures. As shown in the previous studies,38–41 FPMD based methods can provide reasonable estimates for thermodynamic data, and thus we expect the method presented here can be extended to elevated T–P conditions. Such complexing may change pKas and U0 and this can also be addressed by using the FPMD vertical energy gap technique. These unresolved issues will merit future investigations.
Many key thermodynamic parameters are still lacking for important actinides even under ambient conditions, e.g., hydrolysis constants of Ac(IV) are still poorly documented. At elevated temperatures, only limited pKa data are available for actinides and no measurement of reduction potentials has been performed.92 Another issue is the pH-dependent stoichiometry of Ac(VI)–carbonate complexes. It has been found that as pH increases, carbonate complexes get more significant for UO22+, but the detailed mechanism has not been quantified.7 On the other hand, kinetic factors can play an important role and need to be taken into account to fully understand the speciation. The FPMD-based technique provides a feasible way for quantifying these data and mechanisms.
The results above have shown that acidity constants and reduction potentials of uranyl ions are reproduced within 1.0 pKa unit and 0.2 V, respectively. This error margin is similar to that found for the species of main group elements and transition metal cations in our previous calculations.45 For pKas, due to the closed shell nature of proton transfer reactions, GGA functionals can give good prediction and hybrid functionals do not show any obvious difference.45 So, the error in pKa calculation is almost all the statistical error. For E0, the GGA result is reasonable for uranyl ions because their reduction potential is relatively low. For the redox couples of higher reduction potentials, GGA causes serious underestimation whereas hybrid functionals can give better results. This is because hybrid functionals improve the alignment of the VBM of liquid water,87 which effectively reduces the errors in computed redox potentials. For example, the Ag+/Ag2+ couple having a reduction potential as high as 1.98 V is an extreme test case for the present techniques. The GGA result is 1.15 V whereas HSE06 is rather satisfactory, being 1.72 V.54 In light of this promising progress, we are optimistic on the application of the current technique for predicting pH–Eh diagrams of the elements of geological interest under the conditions of hydrothermal fluids. The present work on the U complexes is the first application to f-block species, and the encouraging results indicate that the method is ready to calculate the acid–base and redox chemistry of f-block species at a reasonable accuracy. Finally, we are aware that the UO22+/UO2+ couple has electronic configurations of f0/f1, a relatively safe situation for DFT. Complex electron correlation will be a challenge for the electronic structure theory when there are multiple electrons in f orbitals, which will have to be addressed in future work.
5. Summary
In this study, we investigate the structures, acidity constants and redox potentials of uranyl ions from ambient conditions to 573 K by using FPMD techniques. It is found that UO22+ holds five H2O ligands up to 573 K, whereas UO2+ keeps 5-coordinate up to 473 K and loses one H2O ligand at 573 K. The FPMD based vertical energy gap method is applied to calculate pKas and E0s. The results show that the pKas and E0 can be reproduced with an accuracy of 1 pKa unit and 0.2 V, respectively. This demonstrates that the current methodology is able to predict the aqueous speciation of f-block elements at a good accuracy under the conditions of geological interest. The pKas of the aqueous uranyl ions decrease with temperature and are lower than 3 at temperatures above 473 K, indicating that hydrolytic forms should be dominative. The reduction potentials show an increasing trend with temperature, implying that the reduced states may play more significant roles as T increases. The computed data can be directly used in future studies for understanding the transport and fixation of uranium.Acknowledgements
We thank Matthias Krack for supplying us with the pseudopotential and basis sets for U. We acknowledge the National Science Foundation of China (No. 41222015, 41273074, 41572027 and 21373166), Special Program for Applied Research on Super Computation of the NSFC-Guangdong Joint Fund (the second phase), the Foundation for the Author of National Excellent Doctoral Dissertation of PR China (No. 201228), Newton International Fellowship Program and the financial support from the State Key Laboratory at Nanjing University. We are grateful to the High Performance Computing Center of Nanjing University for allowing us to use the IBM Blade cluster system.References
- M. Altmaier, X. Gaona and T. Fanghaenel, Chem. Rev., 2013, 113, 901–943 CrossRef CAS PubMed.
- D. Langmuir, Geochim. Cosmochim. Acta, 1978, 42, 547–569 CrossRef CAS.
- E. L. Shock, D. C. Sassani and H. Betz, Geochim. Cosmochim. Acta, 1997, 61, 4245–4266 CrossRef CAS.
- H. Geckeis, J. Luetzenkirchen, R. Polly, T. Rabung and M. Schmidt, Chem. Rev., 2013, 113, 1016–1062 CrossRef CAS PubMed.
- I. Grenthe, H. Wanner and I. Forest, Chemical thermodynamics of uranium, North-Holland Amsterdam, 1992 Search PubMed.
- R. Guillaumont and F. J. Mompean, Update on the chemical thermodynamics of uranium, neptunium, plutonium, americium and technetium, North-Holland Amsterdam, 2003 Search PubMed.
- W. M. Murphy and E. L. Shock, Rev. Mineral. Geochem., 1999, 38, 221–253 CAS.
- P. Zanonato, P. Di Bernardo, A. Bismondo, G. K. Liu, X. Y. Chen and L. F. Rao, J. Am. Chem. Soc., 2004, 126, 5515–5522 CrossRef CAS PubMed.
- K. Yuan, E. S. Ilton, M. R. Antonio, Z. Li, P. J. Cook and U. Becker, Environ. Sci. Technol., 2015, 49, 6206–6213 CrossRef CAS PubMed.
- K. Yuan, D. Renock, R. C. Ewing and U. Becker, Geochim. Cosmochim. Acta, 2015, 156, 194–206 CrossRef CAS.
- E. Tertre, G. Berger, E. Simoni, S. Castet, E. Giffaut, M. Loubet and H. Catalette, Geochim. Cosmochim. Acta, 2006, 70, 4563–4578 CrossRef CAS.
- J. Tomasi, B. Mennucci and R. Cammi, Chem. Rev., 2005, 105, 2999–3094 CrossRef CAS PubMed.
- A. V. Marenich, J. Ho, M. L. Coote, C. J. Cramer and D. G. Truhlar, Phys. Chem. Chem. Phys., 2014, 16, 15068–15106 RSC.
- K. Arumugam and U. Becker, Minerals, 2014, 4, 345–387 CrossRef CAS.
- J. R. Rustad, D. A. Dixon, J. D. Kubicki and A. R. Felmy, J. Phys. Chem. A, 2000, 104, 4051–4057 CrossRef CAS.
- M. C. F. Wander, J. R. Rustad and W. H. Casey, J. Phys. Chem. A, 2010, 114, 1917–1925 CrossRef CAS PubMed.
- W. H. Casey, J. R. Rustad and L. Spiccia, Chem. – Eur. J., 2009, 15, 4496–4515 CrossRef CAS PubMed.
- K. M. Rosso and J. R. Rustad, J. Phys. Chem. A, 2000, 104, 6718–6725 CrossRef CAS.
- P. Jaque, A. V. Marenich, C. J. Cramer and D. G. Truhlar, J. Phys. Chem. C, 2007, 111, 5783–5799 CAS.
- J. Li, C. L. Fisher, J. L. Chen, D. Bashford and L. Noodleman, Inorg. Chem., 1996, 35, 4694–4702 CrossRef CAS.
- M. Uudsemaa and T. Tamm, J. Phys. Chem. A, 2003, 107, 9997–10003 CrossRef CAS.
- L.-P. Wang and T. Van Voorhis, J. Chem. Theory Comput., 2012, 8, 610–617 CrossRef CAS PubMed.
- H. M. Steele, D. Guillaumont and P. Moisy, J. Phys. Chem. A, 2013, 117, 4500–4505 CrossRef CAS PubMed.
- P. J. Hay, R. L. Martin and G. Schreckenbach, J. Phys. Chem. A, 2000, 104, 6259–6270 CrossRef CAS.
- D. Marx and J. Hutter, Ab Initio Molecular Dynamics: Basic Theory and Advanced Methods, Cambridge University Press, Cambridge, 2009 Search PubMed.
- J. VandeVondele, M. Krack, F. Mohamed, M. Parrinello, T. Chassaing and J. Hutter, Comput. Phys. Commun., 2005, 167, 103–128 CrossRef CAS.
- D. M. Sherman, Geofluids, 2010, 10, 41–57 CAS.
- X. Liu, J. Cheng, M. Sprik and X. Lu, J. Phys. Chem. Lett., 2013, 4, 2926–2930 CrossRef CAS.
- X. D. Liu, X. C. Lu, R. C. Wang and E. J. Meijer, Phys. Chem. Chem. Phys., 2011, 13, 13305–13309 RSC.
- X. D. Liu, X. C. Lu, R. C. Wang and H. Q. Zhou, Chem. Geol., 2012, 294, 103–112 CrossRef.
- X. D. Liu, X. C. Lu, R. C. Wang, H. Q. Zhou and S. J. Xu, Geochim. Cosmochim. Acta, 2011, 75, 185–194 CrossRef CAS.
- Y. Mei, W. H. Liu, D. M. Sherman and J. Brugger, Geochim. Cosmochim. Acta, 2014, 131, 196–212 CrossRef CAS.
- Y. Mei, D. M. Sherman, W. H. Liu and J. Brugger, Geochim. Cosmochim. Acta, 2013, 102, 45–64 CrossRef CAS.
- G. S. Pokrovski, J. Roux, G. Ferlat, R. Jonchiere, A. P. Seitsonen, R. Vuilleumier and J. L. Hazemann, Geochim. Cosmochim. Acta, 2013, 106, 501–523 CrossRef CAS.
- G. S. Pokrovski, A. Y. Borisova and A. Y. Bychkov, Rev. Mineral. Geochem., 2013, 76, 165–218 CrossRef CAS.
- G. S. Pokrovski, M. A. Kokh, D. Guillaume, A. Y. Borisova, P. Gisquet, J.-L. Hazemann, E. Lahera, W. Del Net, O. Proux and D. Testemale, Proc. Natl. Acad. Sci. U. S. A., 2015, 112, 13484–13489 CrossRef CAS PubMed.
- S. Jahn, J. Dubrail and M. Wilke, Chem. Geol., 2014, 418, 30–39 CrossRef.
- M. Bühl and V. Golubnychiy, Inorg. Chem., 2007, 46, 8129–8131 CrossRef PubMed.
- M. Bühl and I. Grenthe, Dalton Trans., 2011, 40, 11192–11199 RSC.
- M. Bühl, H. Kabrede, R. Diss and G. Wipff, J. Am. Chem. Soc., 2006, 128, 6357–6368 CrossRef PubMed.
- M. Bühl, N. Sieffert, V. Golubnychiy and G. Wipff, J. Phys. Chem. A, 2008, 112, 2428–2436 CrossRef PubMed.
- R. Atta-Fynn, D. F. Johnson, E. J. Bylaska, E. S. Ilton, G. K. Schenter and W. A. de Jong, Inorg. Chem., 2012, 51, 3016–3024 CrossRef CAS PubMed.
- S. O. Odoh, E. J. Bylaska and W. A. De Jong, J. Phys. Chem. A, 2013, 117, 12256–12267 CrossRef CAS PubMed.
- R. Atta-Fynn, E. J. Bylaska and W. A. De Jong, J. Phys. Chem. Lett., 2013, 4, 2166–2170 CrossRef CAS.
- J. Cheng, X. Liu, J. VandeVondele, M. Sulpizi and M. Sprik, Acc. Chem. Res., 2014, 47, 3522–3529 CrossRef CAS PubMed.
- M. Sulpizi and M. Sprik, Phys. Chem. Chem. Phys., 2008, 10, 5238–5249 RSC.
- F. Costanzo, M. Sulpizi, R. G. Della Valle and M. Sprik, J. Chem. Phys., 2011, 134, 244508 CrossRef PubMed.
- J. Cheng and M. Sprik, Phys. Chem. Chem. Phys., 2012, 14, 11245–11267 RSC.
- J. Cheng, M. Sulpizi, J. VandeVondele and M. Sprik, ChemCatChem, 2012, 4, 636–640 CrossRef CAS.
- M. Sulpizi and M. Sprik, J. Phys.: Condens. Matter, 2010, 22, 284116 CrossRef PubMed.
- X. Liu, M. Sprik and J. Cheng, Chem. Phys. Lett., 2013, 563, 9–14 CrossRef CAS.
- J. Cheng, M. Sulpizi and M. Sprik, J. Chem. Phys., 2009, 131, 154504 CrossRef PubMed.
- C. Adriaanse, J. Cheng, V. Chau, M. Sulpizi, J. VandeVondele and M. Sprik, J. Phys. Chem. Lett., 2012, 3, 3411–3415 CrossRef CAS PubMed.
- X. Liu, J. Cheng and M. Sprik, J. Phys. Chem. B, 2015, 119, 1152–1163 CrossRef CAS PubMed.
- X. Liu, J. Cheng, X. Lu, M. He and R. Wang, Phys. Chem. Chem. Phys., 2016, 18, 14911–14917 RSC.
- J. Blumberger, L. Bernasconi, I. Tavernelli, R. Vuilleumier and M. Sprik, J. Am. Chem. Soc., 2004, 126, 3928–3938 CrossRef CAS PubMed.
- J. Blumberger, I. Tavernelli, M. L. Klein and M. Sprik, J. Chem. Phys., 2006, 124, 64507 CrossRef PubMed.
- J. Heyd, G. E. Scuseria and M. Ernzerhof, J. Chem. Phys., 2003, 118, 8207–8215 CrossRef CAS.
- A. V. Krukau, O. A. Vydrov, A. F. Izmaylov and G. E. Scuseria, J. Chem. Phys., 2006, 125, 224106 CrossRef PubMed.
- B. R. Tagirov, I. I. Diakonov, O. A. Devina and A. V. Zotov, Chem. Geol., 2000, 162, 193–219 CrossRef CAS.
- X. Liu, M. He, X. Lu and R. Wang, Chem. Geol., 2015, 411, 192–199 CrossRef CAS.
- W. Wagner, J. R. Cooper, A. Dittmann, J. Kijima, H. J. Kretzschmar, A. Kruse, R. Mares, K. Oguchi, H. Sato, I. Stocker, O. Sifner, Y. Takaishi, I. Tanishita, J. Trubenbach and T. Willkommen, Trans. ASME: J. Eng. Gas Turbines Power, 2000, 122, 150–182 CrossRef CAS.
- G. Lippert, J. Hutter and M. Parrinello, Mol. Phys., 1997, 92, 477–487 CrossRef CAS.
- J. P. Perdew, K. Burke and M. Ernzerhof, Phys. Rev. Lett., 1996, 77, 3865–3868 CrossRef CAS PubMed.
- S. Goedecker, M. Teter and J. Hutter, Phys. Rev. B: Condens. Matter Mater. Phys., 1996, 54, 1703 CrossRef CAS.
- M. Krack, Theor. Chem. Acc., 2005, 114, 145–152 CrossRef CAS.
- M. Krack, Phys. Scr., 2015, 90, 094014 CrossRef.
- J. Rabone and M. Krack, Comput. Mater. Sci., 2013, 71, 157–164 CrossRef CAS.
- F. Costanzo, M. Sulpizi, R. G. Della Valle and M. Sprik, J. Chem. Phys., 2011, 134, 244508 CrossRef PubMed.
- D. R. Lide, CRC handbook of chemistry and physics, CRC press, 2004 Search PubMed.
- R. Ayala and M. Sprik, J. Phys. Chem. B, 2008, 112, 257–269 CrossRef CAS PubMed.
- G. Hummer, L. R. Pratt and A. E. Garcia, J. Phys. Chem., 1996, 100, 1206–1215 CrossRef CAS.
- G. Hummer, L. R. Pratt and A. E. Garcia, J. Chem. Phys., 1997, 107, 9275–9277 CrossRef CAS.
- G. Hummer, L. R. Pratt and A. E. García, J. Phys. Chem. A, 1998, 102, 7885–7895 CrossRef CAS.
- P. H. Hünenberger and J. A. McCammon, J. Chem. Phys., 1999, 110, 1856–1872 CrossRef.
- L. Soderholm, S. Skanthakumar and J. Neuefeind, Anal. Bioanal. Chem., 2005, 383, 48–55 CrossRef CAS PubMed.
- P. G. Allen, J. J. Bucher, D. K. Shuh, N. M. Edelstein and T. Reich, Inorg. Chem., 1997, 36, 4676–4683 CrossRef CAS PubMed.
- J. Neuefeind, L. Soderholm and S. Skanthakumar, J. Phys. Chem. A, 2004, 108, 2733–2739 CrossRef CAS.
- L. Semon, C. Boehme, I. Billard, C. Hennig, K. Lutzenkirchen, T. Reich, A. Rossberg, I. Rossini and G. Wipff, ChemPhysChem, 2001, 2, 591–598 CrossRef CAS PubMed.
- P. Nichols, E. J. Bylaska, G. K. Schenter and W. de Jong, J. Chem. Phys., 2008, 128, 124507 CrossRef PubMed.
- J. P. Austin, M. Sundararajan, M. A. Vincent and I. H. Hillier, Dalton Trans., 2009, 5902–5909 RSC.
- R. J. Frick, T. S. Hofer, A. B. Pribil, B. R. Randolf and B. M. Rode, Phys. Chem. Chem. Phys., 2010, 12, 11736–11743 RSC.
- L. Gagliardi and B. O. Roos, Chem. Phys. Lett., 2000, 331, 229–234 CrossRef CAS.
- G. A. Shamov and G. Schreckenbach, J. Phys. Chem. A, 2005, 109, 10961–10974 CrossRef CAS PubMed.
- C. Baes Jr and N. J. Meyer, Inorg. Chem., 1962, 1, 780–789 CrossRef.
- A. Stefansson and T. M. Seward, Chem. Geol., 2008, 249, 227–235 CrossRef CAS.
- J. Cheng, X. Liu, J. A. Kattirtzi, J. VandeVondele and M. Sprik, Angew. Chem., 2014, 126, 12242–12246 CrossRef.
- R. A. Marcus, Rev. Mod. Phys., 1993, 65, 599 CrossRef CAS.
- A. V. Bandura and S. N. Lvov, J. Phys. Chem. Ref. Data, 2006, 35, 15–30 CrossRef CAS.
- H. Geckeis, J. Lutzenkirchen, R. Polly, T. Rabung and M. Schmidt, Chem. Rev., 2013, 113, 1016–1062 CrossRef CAS PubMed.
- R. L. Johnson, C. A. Ohlin, K. Pellegrini, P. C. Burns and W. H. Casey, Angew. Chem., Int. Ed., 2013, 52, 7464–7467 CrossRef CAS PubMed.
- M. Altmaier, X. Gaona and T. Fanghänel, Chem. Rev., 2013, 113, 901–943 CrossRef CAS PubMed.
| This journal is © the Owner Societies 2016 |