
 Open Access Article
 This Open Access Article is licensed under a Creative Commons Attribution-Non Commercial 3.0 Unported Licence
Spectroscopy and dynamics of double proton transfer in formic acid dimer†
Kasper
Mackeprang
a,
Zhen-Hao
Xu
b,
Zeina
Maroun
a,
Markus
Meuwly
*b and
Henrik G.
Kjaergaard
 *a
*a
aDepartment of Chemistry, University of Copenhagen, Universitetsparken 5, DK-2100 Copenhagen Ø, Denmark. E-mail: hgk@chem.ku.dk; Fax: +45 35320322; Tel: +45 35320334
bDepartment of Chemistry, University of Basel, Klingelbergstrasse 80, 4056 Basel, Switzerland. E-mail: m.meuwly@unibas.ch; Fax: +41 (0)612673855; Tel: +41 (0)612673821
First published on 11th August 2016
Abstract
We present the isolated gas phase infrared spectra of formic acid dimer, (HCOOH)2, and its deuterated counterpart formic-d acid, (DCOOH)2, at room temperature. The formic acid dimer spectrum was obtained by spectral subtraction of a spectrum of formic acid vapor recorded at low pressure from that recorded at a higher pressure. The spectra of formic acid vapor contain features from both formic acid monomer and formic acid dimer, but at low and high pressures of formic acid, the equilibrium is pushed towards the monomer and dimer, respectively. A similar approach was used for the formic-d acid dimer. Building on the previous development of the Molecular Mechanics with Proton Transfer (MMPT) force field for simulating proton transfer reactions, molecular dynamics (MD) simulations were carried out to interpret the experimental spectra in the OH-stretching region. Within the framework of MMPT, a combination of symmetric single and double minimum potential energy surfaces (PESs) provides a good description of the double proton transfer PES. In a next step, potential morphing together with electronic structure calculations at the B3LYP and MP2 level of theory was used to align the computed and experimentally observed spectral features in the OH-stretching region. From this analysis, a barrier for double proton transfer between 5 and 7 kcal mol−1 was derived, which compares with a CCSD(T)/aug-cc-pVTZ calculated barrier of 7.9 kcal mol−1. Such a combination of experimental and computational techniques for estimating barriers for proton transfer in gas phase systems is generic and holds promise for further improved PESs and energetics of these important systems. Additional MD simulations at the semi-empirical DFTB level of theory agree quite well for the center band position but underestimate the width of the OH-stretching band.
1 Introduction
Aerosols play an important role in atmospheric and health sciences, and organic acids have been investigated as possible precursors to the formation of aerosols.1–5 The simplest organic acid, formic acid, is among the most abundant trace gases in the atmosphere, with a concentration on the order of 10 parts per billion by volume detected in urban areas and slightly lower concentrations in rural areas.6–11 Formic acid also serves as a useful model system for larger carboxylic acids, especially in theoretical studies, in which calculations on larger organic acids quickly become unfeasible. For this reason, numerous studies on formic acid exist in the literature.12–18 In the gas phase, organic acids primarily exist in their dimeric form. These dimers are characterized by a cyclic form and are held together by two hydrogen bonds (see Fig. 1). The ability of the organic acids to form these strong dimers influences their atmospheric impact significantly, as it changes the amount of organic acid available to form precursor complexes with e.g. water.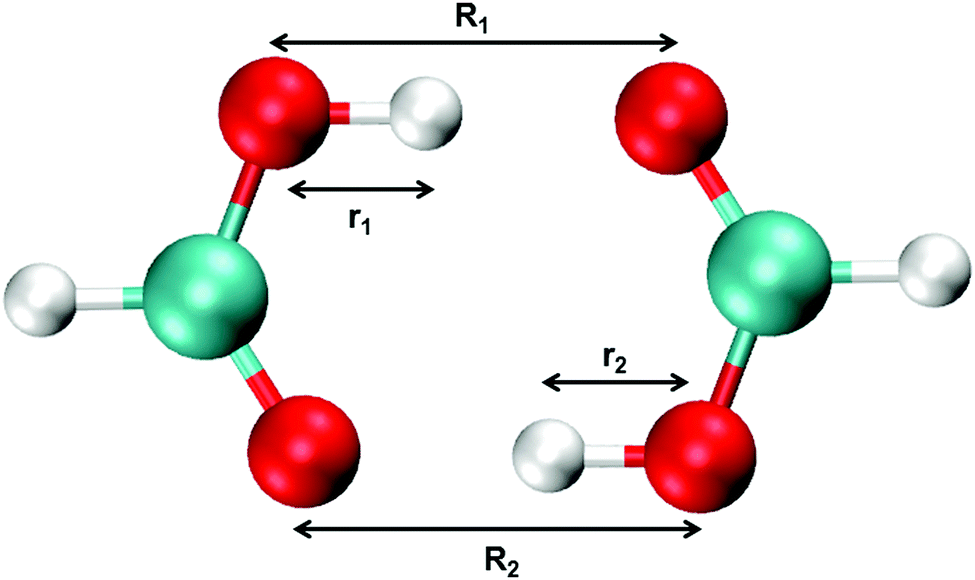 | ||
| Fig. 1 Structure of formic acid dimer (FAD) with the definition of bond lengths. | ||
Infrared spectroscopy is a powerful tool to detect, investigate and characterize hydrogen bonded systems, XH⋯Y, where the donor atom X is more electronegative than H, and Y is the acceptor atom or group of atoms.19–37 The gas-phase infrared spectra of formic acid monomer and dimer have been studied extensively.16,38–49 Upon hydrogen bond formation a redshift, intensity enhancement, and line broadening of the XH-stretching transition usually occur.19,20 These hydrogen bond characteristics are often used to detect and identify hydrogen bonded systems. However, for formic acid these characteristics complicate the spectrum and its interpretation, as the OH-stretching transition shifts and broadens, such that it overlaps with bands in the CH-stretching region. Additionally, the monomer and dimer equilibrium is shifted towards the strongly bound dimer with an equilibrium constant for formic acid dimerization, K, of ∼300 at room temperature (values in the range 135–405 have been reported in the literature).13–16,39,50–55 As such, features from both the monomer and the dimer will be present at all sample pressures in the gas phase infrared (IR) spectrum, which further complicates band interpretation in the CH- and OH-stretching region.
Previously, the line shape and broadening of the fundamental OH-stretching band in formic acid dimer were simulated using first-principles anharmonic couplings.45 In that study, a cubic force field was calculated along the internal coordinates of the dimer and projected onto a normal mode basis. Mixed vibrational states were generated and the line shape and broadening in the OH-stretching region were predicted, assuming Gaussian line shapes for the calculated vibrational transitions. The experimental broadening and line shape in the OH-stretching region was reproduced reasonably well. The line shape of vibrational transitions depends on several elements such as the transition dipole moment, but it is also related to the dynamics of the system, especially the proton transfer (PT) of formic acid dimer.43 Previously, the line shape of the HCl-stretching transition in the HCl–acetonitrile complex and the OH-stretching transition in the deuterated and undeuterated single proton embedded oxalate anion have been modelled using a combination of ensemble averaging and normal mode harmonic oscillator calculations.56,57 In the former, the ensemble averaging is based on an MD simulation, and in the latter, the averaging is based on a Monte Carlo simulation. MD is often used to study dynamic systems and has been used to determine that the two PT motifs in formic acid dimer are coupled.58–60 With the advantages of low computing costs, the force field methods have been extensively developed to perform proton transfer reactions in simulations. An early example is the empirical valence bond (EVB) method61 which treats a reactive system with resonance forms of ionic and covalent states. The multistate(MS)-EVB method is an extension of EVB which allows simulations with multiple excess protons.62–65 More recently, proton transfer reactions have been studied using ReaxFF66 and Hydrogen Dynamics,67 a method in which a proton moves by morphing between a hydronium ion and a water molecule.
The MMPT force field is more akin to a mixed quantum mechanics/molecular mechanics (QM/MM) formulation. It has been shown to provide QM qualities at much reduced computational cost.68–71 Recently, MMPT has been used to study the molecular dynamics and infrared spectrum of the enol form of acetylacetone (AcAc).72 The spectral features of AcAc were satisfactorily reproduced and the MD simulations were compared with the measured OH-stretching region to estimate the proton transfer barrier height to be 2.4 kcal mol−1. Furthermore, double proton transfer (DPT) was investigated in a Pt-containing organometallic complex by independent treatment of NH⋯N and OH⋯O as PT motifs, but not including the coupling between the individual PT motifs.73
In the present study, we have successfully obtained the isolated infrared spectrum of formic acid dimer (FAD) and the dimer of the deuterated species, DCOOH (d-FAD), in the fundamental OH- and CH-stretching region by spectral subtraction of a low pressure infrared spectrum of formic acid vapor from a spectrum recorded at a higher pressure. These spectra have been compared with those obtained from MD simulations using a modified MMPT force field generalized to DPT and on-the-fly MD simulations, where the potential energy surface (PES) is calculated using the semi-empirical DFTB method.74–78 From the comparison of the experimental and simulated spectra, the barrier height for DPT is estimated.
2 Methods
2.1 Experimental
Formic acid (HCOOH, Aldrich, 98%) and formic-d acid (DCOOH, Aldrich, 98% D, 95% in H2O) were purified with several freeze, pump and thaw cycles. The IR spectra were recorded with a VERTEX 70 (Bruker) Fourier transform infrared (FTIR) spectrometer with a 1 cm−1 resolution and 500 scans at room temperature (296 ± 1 K). The spectrometer was fitted with a mid-infrared (MIR) light source, KBr beamsplitter and a liquid nitrogen cooled MCT (Mercury Cadmium Telluride) detector. The spectra of formic acid and formic-d acid were recorded with a 10 cm and 19 cm cell, respectively. The samples were introduced in to the cell through a glass vacuum line (J. Young) equipped with valves to control the sample pressure, which was measured with a Varian PCG-750 pressure gauge. The sample was left to equilibrate until the pressure was stable before the spectrum was recorded. The spectral subtractions were performed with OPUS 6.5.2.2 Molecular dynamics simulations
| V(Q) = VMM(q) + VPT(R, r, θ), | (1) |
MMPT treats the proton transfer process in its full dimensionality while addressing three important aspects of the problem: speed, accuracy, and versatility. While speed and accuracy are rooted in the QM/MM formulation, the versatility of the approach is exploited by using the morphing potential method.81 To this end, it is important to realize that a wide range of proton transfer processes can be described based on three prototype model systems: (a) symmetric single minimum (SSM, the optimized structure of the system has equal sharing of the proton between X and Y), (b) symmetric double-minimum (SDM, the optimized structure of the system has unequal sharing of the proton between X and Y but is symmetric with respect to the transition state), and (c) asymmetric single minimum (ASM, the optimized structure of the system has unequal sharing of the proton and is asymmetric with respect to the transition state).69 The PES of these three model systems (SSM, SDM, or ASM), can be morphed into a suitable PES to reproduce important topological features of the target PES by a transformation of the type
| Vmorph(R′, r′, θ′) = λ(R, r, θ)Vorig(R, r, θ), | (2) |
Standard MMPT, as described above, treats proton transfers independently and is not necessarily suitable to describe double proton transfer (DPT).73 Therefore, a modified MMPT approach is required. Such an extension is afforded by working with a DPT potential, VDPT, which explicitly couples both X–Y distances (R1, R2) and both donor-hydrogen distances (r1, r2) (see Fig. 1) in the following fashion:
| VDPT(r1, r2, R1, R2, θ1, θ2) = [VSDM(r1, R1, θ1)·γ + VSSM(r1, R1, θ1)·(1 − γ)] + [VSDM(r2, R2, θ2)·γ + VSSM(r2, R2, θ2)·(1 − γ)] | (3) |
 | (4) |
| B3LYP | MMPT-B3LYP | ||||
|---|---|---|---|---|---|
| MON | MIN | TS | MIN | TS | |
| O–H | 0.9738 | 1.0075 | 1.2093 | 1.0035 | 1.2089 |
| O–O | 2.6509 | 2.4183 | 2.6574 | 2.4178 | |
| MP2 | MMPT-MP2 | ||||
|---|---|---|---|---|---|
| MON | MIN | TS | MIN | TS | |
| O–H | 0.9675 | 0.9924 | 1.2042 | 0.9871 | 1.2031 |
| O–O | 2.6853 | 2.4074 | 2.6868 | 2.4062 | |
| CCSD(T) | |||
|---|---|---|---|
| MON | MIN | TS | |
| O–H | 0.9701 | 0.9957 | 1.2040 |
| O–O | 2.6741 | 2.4070 | |
Starting from the minimized structures, PES scans along R = R1 = R2, ranging from 2.2 Å to 3.2 Å with an increment of 0.1 Å and r = r1 = r2 from 0.8 Å to R − 0.8 Å with an increment of 0.05 Å were carried out for both methods in order to parametrize VSDM. For parametrizing VSSM similar PES scans were carried out for r1 = R − r2. Next, the parameter σ in eqn (4) has been fitted to best reproduce the target data at the B3LYP level, which yields σ = 2.639 Å−2. The quality of this fit is r2 = 0.999 for B3LYP as the target energies, and r2 = 0.998 for MP2. Given this good agreement, no further optimization of σ was considered for the MP2 reference data. The two PESs are labelled as MMPT-B3LYP and MMPT-MP2 in the following, respectively (see Fig. S3, ESI†).
The fitted MMPT-MP2 PES has an optimized O–H bond length of 0.9871 Å which differs by ∼0.005 Å from the MP2 reference calculations, and the O–O distance differs even less. On the other hand, B3LYP gives a slightly longer O–H bond length and a shorter O–O distance. For the TS structures, both MMPT-MP2 and MMPT-B3LYP yield results close to their respective QM references. Moreover, the reaction barriers were well reproduced to within <0.1 kcal mol−1, which further establishes the quality of the parametrized PESs.
![[M with combining right harpoon above (vector)]](https://www.rsc.org/images/entities/i_char_004d_20d1.gif) (t), obtained from each step in the MD trajectory. The dipole–dipole correlation, C(t), is given by
(t), obtained from each step in the MD trajectory. The dipole–dipole correlation, C(t), is given by| C(t) = 〈(0)(t)〉, | (5) |
(t) is the total molecular dipole moment at time t along the MD trajectory determined from the charge model given in Table S3 (ESI†). The angular brackets denote an average over the time origins. If C(ω), the Fourier transform of C(t), is weighted with the Boltzmann distribution, the classical infrared spectrum, A(ω), is obtained:93,94
| A(ω) = ω{1 − exp[−ħω/(kBT)]}C(ω) | (6) |
 . Therefore, the spectra reported here are all determined from eqn (6). It is also possible to determine power spectra corresponding to specific internal coordinates, q, from the MD trajectory. This is particularly useful to assign spectroscopic features to the motion along these coordinates and identify couplings between internal degrees of freedom. For this purpose, the correlation function 〈q(0)q(t)〉 is Fourier transformed and weighted with the Boltzmann distribution to yield the power spectrum.
3 Results and discussion
We have obtained isolated gas phase spectra of the pure FAD and pure d-FAD at room temperature as described in the Experimental section, and show these in Fig. 2. The spectral signatures for the two systems are very similar, especially the structure of the band associated with the OH-stretching transition. As expected upon deuteration, the fundamental CH/CD-stretching transition is shifted from 2939 cm−1 in the FAD spectrum to 2210 cm−1 in the spectrum of d-FAD. The OH-stretching transition in both spectra is very broad and the transition assigned to the OH-stretch is observed in the region from 2600–3400 cm−1 in agreement with previously recorded spectra that contain a mixture of formic acid monomer and dimer.40,48 Broad OH-stretching transitions are very common in hydrogen bonded complexes72,98,99 and have also been observed for overtone transitions of the intramolecular hydrogen bond in pyruvic acid.100 It is the spectral features in the OH-stretching region that are of particular interest here as these features are ideally suited to relate experiment, proton transfer energetics and dynamics, and computed IR spectra. Typically, such spectral features are not readily explained by standard static vibrational models such as the harmonic oscillator normal mode model, anharmonic local mode theory, or second-order vibrational perturbation theory (VPT2).101–103 | ||
| Fig. 2 Experimentally recorded IR spectra of FAD (upper dashed trace) and d-FAD (lower solid trace). | ||
The MD simulated IR-spectra of FAD with the different PESs are compared in Fig. 3. In the region near 3000 cm−1, spectral features arise from a very broad OH-stretching band and a sharp CH-stretching peak near 2900 cm−1. The OH- and CH-stretching power spectra are compared with the measured IR-spectrum in Fig. 3. The position of the CH-stretching peak predicted by the MD simulated spectra compares well with that of the experimental spectrum. However, the broad OH-stretching band is blue shifted compared to that of the experiment in all three simulations in Fig. 3. Recently, it was shown that the center frequency of the broad OH-stretching band in acetylacetone was affected significantly by the height of the proton transfer barrier.72 This is not surprising, as a change in the barrier height inevitably affects the shape of the PES in the region near the two global minima. In order to investigate the correlation between the OH-stretching peak position and the DPT reaction barrier, the height of the reaction barrier was changed in the MMPT-MP2 force field by morphing with the parameter λ (see the Methods section). The MMPT-MP2 force field has a DPT barrier height of 8.2 kcal mol−1 and features from the OH-stretching transition were observed centered around 3300 cm−1. If the barrier height is lowered to, for example, 5.2 or 2.2 kcal mol−1 the center of the OH-stretching transition red shifts significantly to ∼2700 or ∼1700 cm−1, respectively, compared to the original spectrum (see Fig. 4). All remaining transitions are more or less unaffected.
 | ||
| Fig. 3 Spectra obtained from MD simulations with different energy functions. From top to bottom: MD-DFTB (DPT barrier of 7.5 kcal mol−1) and its OH and CH power spectra (green); MMPT-MP2 (DPT barrier of 8.2 kcal mol−1) and the OH and CH power spectra (green), and MMPT-B3LYP (DPT barrier of 5.4 kcal mol−1). The experimentally recorded spectrum of FAD has been included for comparison (bottom). | ||
 | ||
| Fig. 4 MD simulated spectra with the MMPT-MP2 force field of FAD, with morphed barrier heights of 2.2 kcal mol−1 (top), 5.2 kcal mol−1 (middle) and 8.2 kcal mol−1 (unscaled, bottom). The experimental spectrum has been included for comparison. | ||
The unmorphed barrier height of the MMPT-B3LYP force field is 5.4 kcal mol−1, which is similar to the morphed MMPT-MP2 barrier height (5.2 kcal mol−1). However, the centers of the OH-stretching bands in the two infrared spectra differ substantially (see Fig. 3 and 4), despite the fact that the barrier heights only differ by 0.2 kcal mol−1. Hence, factors other than the barrier height alone, such as the local curvature of the PES, influence the position of the OH-stretching band position. We found that if the proton transfer reaction barriers are morphed to 5.1 kcal mol−1 and 7.2 kcal mol−1 for the MMPT-B3LYP and MMPT-MP2 force field, respectively, the position of the simulated OH-stretching band fits well with the experimental OH-stretching band position. In other words, the barrier to proton transfer can at best be determined to within ±1 kcal mol−1. In comparison, the CCSD(T)/aug-cc-pVTZ calculated barrier is 7.9 kcal mol−1 using MOLPRO,104 which is close to the barrier of 7.2 kcal mol−1 found with the morphed MMPT-MP2 force field, but is higher than the barrier obtained with the MMPT-B3LYP force field.
Up to this point the parameters in the conventional force field (see VMM(q) in eqn (1)) were those of the C36 force field105 and the only modifications of the MMPT-force field concerned the height of the barrier for DPT. Considering Fig. 3 and 4 slight adjustments in the force field may improve in particular the position of the CH-stretching band. Hence, in order to improve the simulated spectra the harmonic force constant for the CH/CD-stretch was rescaled from 330 to 340 kcal mol−1 Å−2. Furthermore, ab initio calculations at the B3LYP/6-31G(d,p) level along the bending potential of the transferring hydrogen (HOO-bend) in FAD suggest that the bending force constant from the SSM and SDM model potentials (k = 33 kcal mol−1 rad−2, see eqn (S3) in ESI†) should be decreased to k = 17.5 kcal mol−1 rad−2 to match the reference calculations. With these adjustments the IR spectra for FAD and d-FAD were recomputed and are reported in Fig. 5. For the simulated spectra with the modified DPT barriers and force constants the agreement in the fundamental OH-stretching region compared to that of the experimental spectrum has improved (see Fig. 5). For the B3LYP-MMPT force field, the CH-stretching frequency for FAD shifts from 2910 to 2950 cm−1 as the arrow around 2900 cm−1 in the left hand panel of Fig. 5 indicates. Also, the H-transfer band shifts its maximum from 3200 cm−1 to 3100 cm−1 upon morphing the barrier height from 5.4 to 5.1 kcal mol−1. The signal at ∼2700 cm−1 for d-FAD with k = 33 kcal mol−1 rad−2 shifts to 2900 cm−1 for k = 17.5 kcal mol−1 rad−2 and can be associated with the unbound H–O stretch frequency from analysis of the power spectra, however, the mode is heavily mixed. The width and position of the OH- and CH-stretching band depend only little on the bending force constant, k, (see dashed and solid lines in Fig. 5) and are satisfactorily reproduced compared to previous line shape studies on formic and acetic acid dimer.45,106 Depending on the force constant k, the fundamental COH-bend is located at ∼1400 cm−1 and ∼1500 cm−1 for k = 17.5 and k = 33 kcal mol−1 rad−2 for FAD, respectively. Experimentally this transition is observed at 1220 cm−1.
 | ||
| Fig. 5 Comparison of experimental spectra (black traces) with simulated spectra (average over 10 independent MD simulations of 100 ns each) for FAD (left panel) and d-FAD (right panel). Red and blue traces for the MMPT-B3LYP and MMPT-MP2 parametrizations, respectively, with morphed barriers of 5.1 kcal mol−1 and 7.2 kcal mol−1 and the CH-stretching force constant adjusted to reproduce the experimentally observed value. Solid traces for simulations with k = 33 kcal mol−1 rad−2 and dashed traces for k = 17.5 kcal mol−1 rad−2 (see text). The orange line in the left panel is for the unmorphed DPT barrier height (MMPT-B3LYP) and the original CH force constant (330 kcal mol−1 Å−2) with the arrows indicating in which direction the bands shift upon changing the force field. | ||
It is also of interest to comment on the clearly discernible and almost equally-spaced progressions (∼125 cm−1) in the experimental spectra. Most of the sub-structure in the OH-stretching region have previously been attributed the coupling between the OH-stretch and the symmetric and anti-symmetric COH-bend.45 Giese et al. observed a similar progression in the OH-stretching region of the simulated stick spectrum of malonaldehyde.107 They found that the progression was a result of strong mixing of the intramolecular hydrogen bound OH-stretching vibration with the in-plane OH-bending vibration. As such, we conclude that the progressions in the OH-stretching spectra of FAD and d-FAD is due to the coupling between the OH-stretching vibration and vibrations that partially break the hydrogen bond such as the COH-bending and in-plane OH-bending vibration.
During 250 ns of MD simulations with the MMPT-B3LYP (with the morphed barrier height of 5.1 kcal mol−1) 25 proton transfers were observed, i.e. corresponding to a DPT rate of 0.1 ns−1. Test calculations show that irrespective of the number of DPT events the IR spectra are all very similar. For this, IR spectra were determined over several separate 50 ns intervals and compared. In the 250 ns simulations with the MMPT-MP2 PES (with the unmorphed barrier of 8.2 kcal mol−1) and in the 10 ns MD-DFTB simulation no DPT was observed. Previously, PT has been explicitly been linked to the spectra features of the OH-stretching band,43 but we find here that the actual occurrence of DPT is not necessarily required for observing a broad OH-absorption in the IR spectrum.
One increasingly important aspect of current force field development is the issue of transferability, i.e. the question how easily a given parametrization can be adapted to a chemically related situation. For halogenated molecules this has recently been assessed and it was found that scaling van der Waals parameters can lead to largely transferable parametrizations.108 For single- and double proton transfer the overall shape (symmetric single minimum, symmetric double minimum, asymmetric double minimum) of the potential energy surface is usually known a priori. Hence, starting from a correct topology, morphing transformations between the correct topology and the target PES, characterized by the barrier height and the relative stabilizations of the two minima (for asymmetric double minimum), morphing transformations will be an efficient means to develop appropriate force fields for a new system. As an example, for derivatives RCOOH–HOOCR of FAD (e.g. acetic acid dimer) it is reasonable to assume that the general topology of the PES is related to that of FAD. Depending on the chemical identity of the R-group (e.g. CH3, halogen) the height of the DPT barrier will change, though. This can be accounted for by suitable linear or nonlinear morphing transformations. Hence, with a limited number of electronic structure calculations the necessary information about the target PES can be obtained and the morphing parameters which describe DPT in RCOOH–HOOCR can be determined.
4 Conclusion
The vibrational spectroscopy of FAD has been investigated experimentally and by computer simulations. Spectra at low pressures of formic acid, HCOOH, and formic-d acid, DCOOH, vapor were recorded to push the equilibrium towards the monomer. These spectra were scaled and subtracted from the corresponding spectra recorded at higher pressures of formic acid and formic-d acid vapor, where the equilibrium is pushed towards the dimer. Successful subtractions of the monomer from the high pressure spectra were achieved, and the isolated gas phase spectra of formic acid and formic-d acid dimer (FAD and d-FAD) at room temperature were obtained. A modified version of the MMPT force field was developed and successfully applied to FAD and d-FAD to facilitate interpretation of the isolated dimer spectra in the OH-stretching region. After rescaling the proton transfer barrier of the MMPT force field and changing the CH/CD-stretching and HOO-bending force constants, the computed infrared spectra of FAD and d-FAD favorably agreed with those from experiment in the OH-stretching region. The scaled proton transfer barrier of 7.2 kcal mol−1 in the MMPT-MP2 force field was found to be comparable to the barrier height of 7.9 kcal mol−1 obtained at the CCSD(T)/aug-cc-pVTZ level of theory. However, the scaled barrier height includes entropic contributions as it involves dynamics on the full-dimensional PES from which the spectroscopy was determined. The T = 0 K calculation at the higher CCSD(T)/aug-cc-PVTZ level of theory does not include such entropic contributions. It is reassuring that the T = 0 K value is an upper bound to the barrier height from finite-temperature MD simulations, as it should be. The scaled barrier height in the MMPT-B3LYP force field that provided a good fit of the central OH-stretching frequency was lower by 2 kcal mol−1 compared to that of the MMPT-MP2 force field which is considered to be the more realistic value. The present work shows that MMPT can be extended to treat DPT in a meaningful fashion which is also applicable to larger carboxylic acids where more computationally demanding on-the-fly MD simulations are not feasible.Acknowledgements
We thank the Danish Council for Independent Research—Natural Sciences, the Danish Center for Scientific Computing (DCSC), and the Department of Chemistry at the University of Copenhagen for funding. KM is grateful to the Ministry of Higher Education and Science for the “EliteForsk” travel scholarship. The work in Basel is supported by the Swiss National Science Foundation (Grant 200020-132406 and the NCCR MUST) and the University of Basel.References
- G. Myhre, D. Shindell, F.-W. Bréon, W. Collins, J. Fuglestvedt, J. Huang, D. Koch, J.-F. Lamarque, D. Lee, B. Mendoza, T. Nakajima, A. Robock, G. Stephens, T. Takamura and H. Zhang, Climate Change 2013: The Physical Science Basis. Contribution of Working Group I to the Fifth Assessment Report of Intergovernmental Panel on Climate Change, 2013 Search PubMed.
- A. Chebbi and P. Carlier, Atmos. Environ., 1996, 30, 4233–4249 CrossRef CAS.
- S. Yu, Atmos. Res., 2000, 53, 185–217 CrossRef CAS.
- M. Kanakidou, J. H. Seinfeld, S. N. Pandis, I. Barnes, F. J. Dentener, M. C. Facchini, R. Van Dingenen, B. Ervens, A. Nenes, C. J. Nielsen, E. Swietlicki, J. P. Putaud, Y. Balkanski, S. Fuzzi, J. Horth, G. K. Moortgat, R. Winterhalter, C. E. L. Myhre, K. Tsigaridis, E. Vignati, E. G. Stephanou and J. Wilson, Atmos. Chem. Phys., 2005, 5, 1053–1123 CrossRef CAS.
- M. Hallquist, J. C. Wenger, U. Baltensperger, Y. Rudich, D. Simpson, M. Claeys, J. Dommen, N. M. Donahue, C. George, A. H. Goldstein, J. F. Hamilton, H. Herrmann, T. Hoffmann, Y. Iinuma, M. Jang, M. E. Jenkin, J. L. Jimenez, A. Kiendler-Scharr, W. Maenhaut, G. McFiggans, T. F. Mentel, A. Monod, A. S. H. Prévôt, J. H. Seinfeld, J. D. Surratt, R. Szmigielski and J. Wildt, Atmos. Chem. Phys., 2009, 9, 5155–5236 CrossRef CAS.
- G. A. Dawson, J. C. Farmer and J. L. Moyers, Geophys. Res. Lett., 1980, 7, 725–728 CrossRef CAS.
- J. C. Farmer and G. A. Dawson, J. Geophys. Res.: Oceans, 1982, 87, 8931–8942 CrossRef CAS.
- P. L. Hanst, N. W. Wong and J. Bragin, Atmos. Environ., 1982, 16, 969–981 CrossRef CAS.
- R. W. Talbot, K. M. Beecher, R. C. Harriss and W. R. Cofer, J. Geophys. Res.: Atmos., 1988, 93, 1638–1652 CrossRef CAS.
- M. O. Andreae, R. W. Talbot, T. W. Andreae and R. C. Harriss, J. Geophys. Res.: Atmos., 1988, 93, 1616–1624 CrossRef CAS.
- J. E. Lawrence and P. Koutrakis, Environ. Sci. Technol., 1994, 28, 957–964 CrossRef CAS PubMed.
- L. George and W. Sander, Spectrochim. Acta, Part A, 2004, 60, 3225–3232 CrossRef PubMed.
- M. D. Taylor and J. Bruton, J. Am. Chem. Soc., 1952, 74, 4151–4152 CrossRef CAS.
- J. R. Barton and C. C. Hsu, J. Chem. Eng. Data, 1969, 14, 184–187 CrossRef CAS.
- R. Büttner and G. Maurer, Ber. Bunsenges. Phys. Chem., 1983, 87, 877–882 CrossRef.
- J. Vander Auwera, K. Didriche, A. Perrin and F. Keller, J. Chem. Phys., 2007, 126, 124311 CrossRef CAS PubMed.
- J. E. Bertie and K. H. Michaelian, J. Chem. Phys., 1982, 76, 886–894 CrossRef CAS.
- J. E. Bertie, K. H. Michaelian, H. H. Eysel and D. Hager, J. Chem. Phys., 1986, 85, 4779–4789 CrossRef CAS.
- E. Arunan, G. R. Desiraju, R. A. Klein, J. Sadlej, S. Scheiner, I. Alkorta, D. C. Clary, R. H. Crabtree, J. J. Dannenberg, P. Hobza, H. G. Kjaergaard, A. C. Legon, B. Mennucci and D. J. Nesbitt, Pure Appl. Chem., 2011, 83, 1619–1636 CAS.
- E. Arunan, G. R. Desiraju, R. A. Klein, J. Sadlej, S. Scheiner, I. Alkorta, D. C. Clary, R. H. Crabtree, J. J. Dannenberg, P. Hobza, H. G. Kjaergaard, A. C. Legon, B. Mennucci and D. J. Nesbitt, Pure Appl. Chem., 2011, 83, 1637–1641 CAS.
- S. Chung and M. Hippler, J. Chem. Phys., 2006, 124, 214316 CrossRef PubMed.
- M. Hippler, J. Chem. Phys., 2007, 127, 084306 CrossRef PubMed.
- M. Hippler, S. Hesse and M. A. Suhm, Phys. Chem. Chem. Phys., 2010, 12, 13555–13565 RSC.
- B. Michielsen, J. J. J. Dom, B. J. v. d. Veken, S. Hesse, Z. Xue, M. A. Suhm and W. A. Herrebout, Phys. Chem. Chem. Phys., 2010, 12, 14034–14044 RSC.
- L. Du and H. G. Kjaergaard, J. Phys. Chem. A, 2011, 115, 12097–12104 CrossRef CAS PubMed.
- J. J. J. Dom, B. J. van der Veken, B. Michielsen, S. Jacobs, Z. Xue, S. Hesse, H.-M. Loritz, M. A. Suhm and W. A. Herrebout, Phys. Chem. Chem. Phys., 2011, 13, 14142–14152 RSC.
- L. Du, J. R. Lane and H. G. Kjaergaard, J. Chem. Phys., 2012, 136, 184305 CrossRef PubMed.
- B. Michielsen, C. Verlackt, B. van der Veken and W. Herrebout, J. Mol. Struct., 2012, 1023, 90–95 CrossRef CAS.
- L. Du, K. Mackeprang and H. G. Kjaergaard, Phys. Chem. Chem. Phys., 2013, 15, 10194–10206 RSC.
- N. Bork, L. Du and H. G. Kjaergaard, J. Phys. Chem. A, 2014, 118, 1384–1389 CrossRef CAS PubMed.
- N. Bork, L. Du, H. Reiman, T. Kurtèn and H. G. Kjaergaard, J. Phys. Chem. A, 2014, 118, 5316–5322 CrossRef CAS PubMed.
- A. S. Hansen, L. Du and H. G. Kjaergaard, Phys. Chem. Chem. Phys., 2014, 16, 22882–22891 RSC.
- A. S. Hansen, L. Du and H. G. Kjaergaard, J. Phys. Chem. Lett., 2014, 5, 4225–4231 CrossRef CAS PubMed.
- C. L. Andersen, C. S. Jensen, K. Mackeprang, L. Du, S. Jørgensen and H. G. Kjaergaard, J. Phys. Chem. A, 2014, 118, 11074–11082 CrossRef CAS PubMed.
- K. H. Møller, A. S. Hansen and H. G. Kjaergaard, J. Phys. Chem. A, 2015, 119, 10988–10998 CrossRef PubMed.
- M. Heger, M. A. Suhm and R. A. Mata, J. Chem. Phys., 2014, 141, 101105 CrossRef PubMed.
- M. Heger, R. A. Mata and M. A. Suhm, Chem. Sci., 2015, 6, 3738–3745 RSC.
- L. G. Bonner and R. Hofstadter, J. Chem. Phys., 1938, 6, 531–534 CrossRef CAS.
- A. Clague and H. Bernstein, Spectrochim. Acta, Part A, 1969, 25, 593–596 CrossRef CAS.
- P. Excoffon and Y. Maréchal, Spectrochim. Acta, Part A, 1972, 28, 269–283 CrossRef CAS.
- Y. Maréchal, J. Chem. Phys., 1987, 87, 6344–6353 CrossRef.
- D. Hurtmans, F. Herregodts, M. Herman, J. Liévin, A. Campargue, A. Garnache and A. A. Kachanov, J. Chem. Phys., 2000, 113, 1535–1545 CrossRef CAS.
- M. V. Vener, O. Kühn and J. M. Bowman, Chem. Phys. Lett., 2001, 349, 562–570 CrossRef CAS.
- M. Freytes, D. Hurtmans, S. Kassi, J. Liévin, J. V. Auwera, A. Campargue and M. Herman, Chem. Phys., 2002, 283, 47–61 CrossRef CAS.
- G. M. Florio, T. S. Zwier, E. M. Myshakin, K. D. Jordan and E. L. Sibert, J. Chem. Phys., 2003, 118, 1735–1746 CrossRef CAS.
- R. Georges, M. Freytes, D. Hurtmans, I. Kleiner, J. V. Auwera and M. Herman, Chem. Phys., 2004, 305, 187–196 CrossRef CAS.
- D. L. Howard and H. G. Kjaergaard, J. Chem. Phys., 2004, 121, 136–140 CrossRef CAS PubMed.
- F. Ito, J. Chem. Phys., 2008, 128, 114310 CrossRef PubMed.
- A. Perrin, J. V. Auwera and Z. Zelinger, J. Quant. Spectrosc. Radiat. Transfer, 2009, 110, 743–755 CrossRef CAS.
- H. C. Ramsperger and C. W. Porter, J. Am. Chem. Soc., 1926, 48, 1267–1273 CrossRef.
- A. S. Coolidge, J. Am. Chem. Soc., 1928, 50, 2166–2178 CrossRef CAS.
- R. C. Herman, J. Chem. Phys., 1940, 8, 252–258 CrossRef CAS.
- A. Winkler and P. Hess, J. Am. Chem. Soc., 1994, 116, 9233–9240 CrossRef CAS.
- S. Miyamoto, S. Nakamura, Y. Iwai and Y. Arai, J. Chem. Eng. Data, 1999, 44, 48–51 CrossRef CAS.
- F. Kollipost, R. W. Larsen, A. V. Domanskaya, M. Nörenberg and M. A. Suhm, J. Chem. Phys., 2012, 136, 151101 CrossRef CAS PubMed.
- N. Bork, V. Loukonen, H. G. Kjaergaard and H. Vehkamaki, Phys. Chem. Chem. Phys., 2014, 16, 24685–24690 RSC.
- C. T. Wolke, A. F. DeBlase, C. M. Leavitt, A. B. McCoy and M. A. Johnson, J. Phys. Chem. A, 2015, 119, 13018–13024 CrossRef CAS PubMed.
- H. Ushiyama and K. Takatsuka, J. Chem. Phys., 2001, 115, 5903–5912 CrossRef CAS.
- P. R. L. Markwick, N. L. Doltsinis and D. Marx, J. Chem. Phys., 2005, 122, 054112 CrossRef PubMed.
- L. C. T. Pierce, P. R. L. Markwick, J. A. McCammon and N. L. Doltsinis, J. Chem. Phys., 2011, 134, 174107 CrossRef PubMed.
- A. Warshel and R. M. Weiss, J. Am. Chem. Soc., 1980, 102, 6218–6226 CrossRef CAS.
- U. Schmitt and G. Voth, J. Phys. Chem. B, 1998, 102, 5547–5551 CrossRef CAS.
- T. Day, A. Soudackov, M. Cuma, U. Schmitt and G. Voth, J. Chem. Phys., 2002, 117, 5839–5849 CrossRef CAS.
- Y. Wu, H. Chen, F. Wang, F. Paesani and G. A. Voth, J. Phys. Chem. B, 2008, 112, 467–482 CrossRef CAS PubMed.
- J. M. J. Swanson, C. M. Maupin, H. Chen, M. K. Petersen, J. Xu, Y. Wu and G. A. Voth, J. Phys. Chem. B, 2007, 111, 4300–4314 CrossRef CAS PubMed.
- O. Rahaman, A. C. T. van Duin, W. A. Goddard, III and D. J. Doren, J. Phys. Chem. B, 2011, 115, 249–261 CrossRef CAS PubMed.
- M. G. Wolf and G. Groenhof, J. Comput. Chem., 2014, 35, 657–671 CrossRef CAS PubMed.
- S. Lammers and M. Meuwly, J. Phys. Chem. A, 2007, 111, 1638–1647 CrossRef CAS PubMed.
- S. Lammers, S. Lutz and M. Meuwly, J. Comput. Chem., 2008, 29, 1048–1063 CrossRef CAS PubMed.
- Y. Yang and M. Meuwly, J. Chem. Phys., 2010, 133, 064503 CrossRef PubMed.
- S. Lutz, I. Tubert-Brohman, Y. Yang and M. Meuwly, J. Biol. Chem., 2011, 286, 23679–23687 CrossRef CAS PubMed.
- D. L. Howard, H. G. Kjaergaard, J. Huang and M. Meuwly, J. Phys. Chem. A, 2015, 119, 7980–7990 CrossRef CAS PubMed.
- J. Huang, D. Haeussinger, U. Gellrich, W. Seiche, B. Breit and M. Meuwly, J. Phys. Chem. B, 2012, 116, 14406–14415 CrossRef CAS PubMed.
- M. Elstner, D. Porezag, G. Jungnickel, J. Elsner, M. Haugk, T. Frauenheim, S. Suhai and G. Seifert, Phys. Rev. B: Condens. Matter Mater. Phys., 1998, 58, 7260–7268 CrossRef CAS.
- M. Elstner, T. Frauenheim, E. Kaxiras, G. Seifert and S. Suhai, Phys. Status Solidi B, 2000, 217, 357–376 CrossRef CAS.
- T. Frauenheim, G. Seifert, M. Elstner, T. Niehaus, C. Köhler, M. Amkreutz, M. Sternberg, Z. Hajnal, A. D. Carlo and S. Suhai, J. Phys.: Condens. Matter, 2002, 14, 3015 CrossRef CAS.
- Q. Cui, M. Elstner, E. Kaxiras, T. Frauenheim and M. Karplus, J. Phys. Chem. B, 2001, 105, 569–585 CrossRef CAS.
- J. Pu, J. Gao and D. G. Truhlar, J. Phys. Chem. A, 2004, 108, 5454–5463 CrossRef CAS.
- Z. Maroun, K. Mackeprang and H. G. Kjaergaard, 2016, unpublished work.
- M. J. Frisch, G. W. Trucks, H. B. Schlegel, G. E. Scuseria, M. A. Robb, J. R. Cheeseman, G. Scalmani, V. Barone, B. Mennucci, G. A. Petersson, H. Nakatsuji, M. Caricato, X. Li, H. P. Hratchian, A. F. Izmaylov, J. Bloino, G. Zheng, J. L. Sonnenberg, M. Hada, M. Ehara, K. Toyota, R. Fukuda, J. Hasegawa, M. Ishida, T. Nakajima, Y. Honda, O. Kitao, H. Nakai, T. Vreven, J. A. Montgomery, Jr., J. E. Peralta, F. Ogliaro, M. Bearpark, J. J. Heyd, E. Brothers, K. N. Kudin, V. N. Staroverov, R. Kobayashi, J. Normand, K. Raghavachari, A. Rendell, J. C. Burant, S. S. Iyengar, J. Tomasi, M. Cossi, N. Rega, J. M. Millam, M. Klene, J. E. Knox, J. B. Cross, V. Bakken, C. Adamo, J. Jaramillo, R. Gomperts, R. E. Stratmann, O. Yazyev, A. J. Austin, R. Cammi, C. Pomelli, J. W. Ochterski, R. L. Martin, K. Morokuma, V. G. Zakrzewski, G. A. Voth, P. Salvador, J. J. Dannenberg, S. Dapprich, A. D. Daniels, O. Farkas, J. B. Foresman, J. V. Ortiz, J. Cioslowski and D. J. Fox, Gaussian09 Revision D.01, Gaussian Inc., Wallingford CT, 2009 Search PubMed.
- M. Meuwly and J. M. Hutson, J. Chem. Phys., 1999, 110, 8338–8347 CrossRef CAS.
- P. M. Gill, B. G. Johnson, J. A. Pople and M. J. Frisch, Chem. Phys. Lett., 1992, 197, 499–505 CrossRef CAS.
- R. Parr and W. Yang, Density-Functional Theory of Atoms and Molecules, Oxford University Press, USA, 1989 Search PubMed.
- M. Head-Gordon, J. A. Pople and M. J. Frisch, Chem. Phys. Lett., 1988, 153, 503–506 CrossRef CAS.
- M. J. Frisch, M. Head-Gordon and J. A. Pople, Chem. Phys. Lett., 1990, 166, 281–289 CrossRef CAS.
- M. J. Frisch, M. Head-Gordon and J. A. Pople, Chem. Phys. Lett., 1990, 166, 275–280 CrossRef CAS.
- M. Head-Gordon and T. Head-Gordon, Chem. Phys. Lett., 1994, 220, 122–128 CrossRef CAS.
- B. R. Brooks, C. L. Brooks, III, A. D. Mackerell, Jr., L. Nilsson, R. J. Petrella, B. Roux, Y. Won, G. Archontis, C. Bartels, S. Boresch, A. Caflisch, L. Caves, Q. Cui, A. R. Dinner, M. Feig, S. Fischer, J. Gao, M. Hodoscek, W. Im, K. Kuczera, T. Lazaridis, J. Ma, V. Ovchinnikov, E. Paci, R. W. Pastor, C. B. Post, J. Z. Pu, M. Schaefer, B. Tidor, R. M. Venable, H. L. Woodcock, X. Wu, W. Yang, D. M. York and M. Karplus, J. Comput. Chem., 2009, 30, 1545–1614 CrossRef CAS PubMed.
- B. Brooks, R. Bruccoleri, D. Olafson, D. States, S. Swaminathan and M. Karplus, J. Comput. Chem., 1983, 4, 187–217 CrossRef CAS.
- A. MacKerel Jr., C. Brooks III, L. Nilsson, B. Roux, Y. Won and M. Karplus, CHARMM: The Energy Function and Its Parameterization with an Overview of the Program, John Wiley & Sons, Chichester, 1998, vol. 1, pp. 271–277 Search PubMed.
- Y. Yang, H. Yu, D. York, Q. Cui and M. Elstner, J. Phys. Chem. A, 2007, 111, 10861–10873 CrossRef CAS PubMed.
- D. Riccardi, P. Schaefer, Y. Yang, H. Yu, N. Ghosh, X. Prat-Resina, P. Konig, G. Li, D. Xu, H. Guo, M. Elstner and Q. Cui, J. Phys. Chem. B, 2006, 110, 6458–6469 CrossRef CAS PubMed.
- D. A. McQuarrie, Statistical Mechanics, University Science Books, 1st edn, 2000 Search PubMed.
- M. Schmitz and P. Tavan, J. Chem. Phys., 2004, 121, 12233–12246 CrossRef CAS PubMed.
- R. Ramirez, T. Lopez-Ciudad, P. Kumar and D. Marx, J. Chem. Phys., 2004, 121, 3973–3983 CrossRef CAS PubMed.
- S. A. Egorov, K. F. Everitt and J. L. Skinner, J. Phys. Chem. A, 1999, 103, 9494–9499 CrossRef CAS.
- M. Schmitz and P. Tavan, J. Chem. Phys., 2004, 121, 12247–12258 CrossRef CAS PubMed.
- D. L. Howard and H. G. Kjaergaard, J. Phys. Chem. A, 2006, 110, 10245–10250 CrossRef CAS PubMed.
- Y.-L. Cheng, H.-Y. Chen and K. Takahashi, J. Phys. Chem. A, 2011, 115, 5641–5653 CrossRef CAS PubMed.
- K. L. Plath, K. Takahashi, R. T. Skodje and V. Vaida, J. Phys. Chem. A, 2009, 113, 7294–7303 CrossRef CAS PubMed.
- E. B. Wilson, Phys. Rev., 1934, 45, 706–714 CrossRef CAS.
- M. L. Sage and J. Jortner, Bond Modes, John Wiley & Sons, Inc., 2007, pp. 293–322 Search PubMed.
- J. Vazquez and J. F. Stanton, Mol. Phys., 2006, 104, 377–388 CrossRef CAS.
- H.-J. Werner, P. J. Knowles, G. Knizia, F. R. Manby, M. Schütz, P. Celani, T. Korona, R. Lindh, A. Mitrushenkov, G. Rauhut, K. R. Shamasundar, T. B. Adler, R. D. Amos, A. Bernhardsson, A. Berning, D. L. Cooper, M. J. O. Deegan, A. J. Dobbyn, F. Eckert, E. Goll, C. Hampel, A. Hesselmann, G. Hetzer, T. Hrenar, G. Jansen, C. Köppl, Y. Liu, A. W. Lloyd, R. A. Mata, A. J. May, S. J. McNicholas, W. Meyer, M. E. Mura, A. Nicklass, D. P. O'Neill, P. Palmieri, D. Peng, K. Pflüger, R. Pitzer, M. Reiher, T. Shiozaki, H. Stoll, A. J. Stone, R. Tarroni, T. Thorsteinsson and M. Wang, MOLPRO, version 2012.1, a package of ab initio programs, 2012 Search PubMed.
- O. Guvench, S. S. Mallajosyula, E. P. Raman, E. Hatcher, K. Vanommeslaeghe, T. J. Foster, F. W. Jamison, II and A. D. MacKerell, Jr., J. Chem. Theory Comput., 2011, 7, 3162–3180 CrossRef CAS PubMed.
- P. Durlak and Z. Latajka, Chem. Phys. Lett., 2009, 477, 249–254 CrossRef CAS.
- K. Giese, M. Petković, H. Naundorf and O. Kühn, Phys. Rep., 2006, 430, 211–276 CrossRef CAS.
- F. Hedin, K. elHage and M. Meuwly, J. Chem. Inf. Model., 2016 DOI:10.1021/acs.jcim.6b00280.
Footnote |
| † Electronic supplementary information (ESI) available: Details of the spectral subtraction, parameters for the MMPT force field, point charges used to calculated the dipole moment. Figures of the simulated spectra of FAD and d-FAD with the modified MMPT force fields, a comparison of the potential energy surfaces obtained with the SDM model, SSM model, mixed surface model and at the B3LYP/6-31G(d,p) level of theory, correlation between the MMPT, MP2 and B3LYP energies, and power spectra in the CD-stretching region. See DOI: 10.1039/c6cp03462d |
| This journal is © the Owner Societies 2016 |