 Open Access Article
Creative Commons Attribution 3.0 Unported Licence
Unusual distance dependences of electron transfer rates
Martin
Kuss-Petermann
and
Oliver S.
Wenger
*
Department of Chemistry, University of Basel, St. Johanns-Ring 19, 4056 Basel, Switzerland. E-mail: oliver.wenger@unibas.ch
First published on 29th June 2016
Abstract
Usually the rates for electron transfer (kET) decrease with increasing donor–acceptor distance, but Marcus theory predicts a regime in which kET is expected to increase when the transfer distance gets longer. Until recently, experimental evidence for such counter-intuitive behavior had been very limited, and consequently this effect is much less well-known than the Gaussian free energy dependence of electron transfer rates leading to the so-called inverted driving-force effect. This article presents the theoretical concepts that lead to the prediction of electron transfer rate maxima at large donor–acceptor distances, and it discusses conditions that are expected to favor experimental observations of such behavior. It continues with a consideration of specific recent examples in which electron transfer rates were observed to increase with increasing donor–acceptor distance, and it closes with a discussion of the importance of this effect in the context of light-to-chemical energy conversion.
Martin Kuss-Petermann received his diploma in chemistry from the University of Göttingen (Germany) in 2011 and his PhD degree from the University of Basel (Switzerland) in 2015 under the supervision of Oliver Wenger. His research focusses on photo-triggered charge separation and recombination studies, as well as on light-induced charge accumulation. |
Oliver S. Wenger received a PhD degree from University of Bern (Switzerland) in 2002 after work with Hans U. Güdel. After two postdocs (one at Caltech with Harry B. Gray from 2002–2004 and one at Université de Strasbourg with Jean-Pierre Sauvage from 2004–2006) he became assistant professor at University of Geneva. In 2009 he accepted a tenured (W2) professorship at Georg-August-Universität Göttingen, and in 2012 he moved to the University of Basel. |
Introduction
Due to their low mass, electrons can tunnel over long distances (>15 Å).1 An exponential decrease of electron transfer rates (kET) with increasing donor–acceptor distance is usually observed for tunneling, governed by the intervening medium as well as the nature of the donor and the acceptor.1b,2 In cases where the intervening medium contains redox-active units, a so-called hopping mechanism can become operative.3 Hopping is essentially multi-step tunneling and consequently leads to shallower distance dependences, typically with kET inversely proportional to the donor–acceptor distance.4 Regardless of which one of the two mechanisms is active, kET usually decreases with increasing reactant separation. However, Marcus theory predicts a regime in which electron transfer rates should first increase to reach a maximum at a given (optimal) donor–acceptor distance, and then decrease when increasing the reactant separation even further.5 In principle, this was noted more than 30 years ago,6 but it remained a largely unknown effect, presumably because experimental evidence for it was elusive. Recent studies have provided direct evidence for electron transfer rate maxima at large donor–acceptor distances,7 and thus it seemed worthwhile to raise awareness of the underlying theoretical concepts that lead to the prediction of such counter-intuitive behavior. We will identify a set of conditions that should favor the observation of increasing kET with increasing distance, and we will consider the abovementioned recent studies in this light. Finally, we will discuss the significance of this effect for the conversion of solar light to chemically stored energy.Basic aspects of electron transfer theory
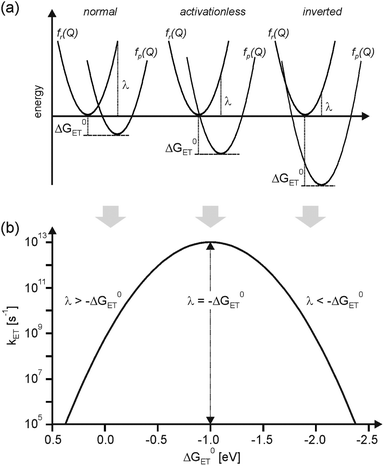
According to semi-classical theory, electron transfer rates depend on the reaction free energy (ΔG0ET), the reorganization energy associated with electron transfer (λ), and the electronic coupling (HDA) between the donor and the acceptor (eqn (1)).5 | (1) |
The nuclear factor is responsible for the well-known Gaussian free energy dependence of kET. In the normal regime of the plot in Fig. 1b, kET increases with increasing driving-force, due to a decreasing activation barrier between the reactant (fr(Q)) and product potential energy wells (fp(Q)). kET reaches a maximum when −ΔG0ET is equal to λ, at which point the reaction proceeds activationless (Fig. 1a, middle). A further increase in driving-force entails the re-appearance of an activation barrier, leading to a decrease of kET. This so-called inverted driving-force effect was predicted by theory,5 and, after some initial struggle,9 unambiguous experimental evidence for this phenomenon could be found. Nowadays this effect is well documented and understood.10
According to superexchange theory, the electronic coupling term HDA in eqn (1) can be nonzero even when donor and acceptor are far apart (≥15 Å) because the intervening medium (e.g., covalent bridges or solvent molecules) can mediate long-range electronic coupling.11HDA usually decreases exponentially with increasing distance (rDA), and the steepness of this decrease is captured by the distance decay parameter (βel).2b,3a
| HDA(rDA) = H(0)DA·exp(−βel·(rDA − r(0)DA)) | (2) |
H DA is not the only distance-dependent parameter in eqn (1). While the distance dependence of −ΔG0ET is often negligible, that of the reorganization energy (λ) can be substantial.15 The overall reorganization energy is a sum of inner- (λi) and outer-sphere (λo) contributions (eqn (3)), reflecting the energy required for nuclear reorganization on the donor and the acceptor in the course of electron transfer, as well as reorganization of their chemical environment (e.g., solvent molecules or counter-ions).5
| λ = λi + λo | (3) |
 | (4) |
Consequences of opposing distance dependences of HDA and λo
Driving-force dependence parabola such as that in Fig. 1b can be calculated as a function of rDA using eqn (1)–(4).17 For spherical donors and acceptors with radii (a1, a2) of 4 Å in CH3CN (η = 1.3341, Ds = 35.7) at 298 K, we assumed H(0)DA = 200 cm−1, β = 0.8 Å−1, and λi = 0.1 eV. The Marcus parabola obtained for rDA = 8, 11, and 21 Å are shown in Fig. 2. The decrease of HDA with increasing rDA (eqn (2)) causes a downward shift, while the increase of λ (eqn (3) and (4)) displaces the parabola to the right, because the activationless point is reached when −ΔG0ET = λ (eqn (1)). The two vertical lines in Fig. 2 illustrate that at constant driving-force very different distance dependences for kET can result, depending on the exact driving-force. At ΔG0ET = −1.0 eV, kET decreases with increasing rDA, whereas at ΔG0ET = −2.0 eV there is an increase of kET between 8 and 11 Å followed by a decrease at 21 Å. In other words, there are regimes in which one expects electron transfer rate maxima at large donor–acceptor distances.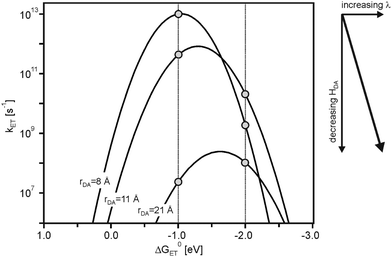 | ||
| Fig. 2 Driving-force dependence of electron transfer rates (kET) at three different donor–acceptor distances (rDA). Calculated using eqn (1)–(4) and the following parameters: H(0)DA = 200 cm−1, β = 0.8 Å−1, λi = 0.1 eV, a1 = a2 = 4 Å, η = 1.3341 (Dop = η2), Ds = 35.7 (values for CH3CN). | ||
As seen from Fig. 3a, at ΔG0ET = −1.0 eV there is only a minor deviation from strictly exponential dependence of kET on rDA, because the distance dependence of the nuclear factor (κN) is weak in this case (dotted line), and the contribution from νn·κe is dominant (dashed line). At ΔG0ET = −2.0 eV (Fig. 3b), however, the distance dependences of κn and νn·κe oppose each other, leading to maximal kET at 11 Å. The reason for this is that the (λ + ΔG0ET)2 term in eqn (1) decreases with increasing λ when −ΔG0ET > λ (the sum of ΔG0ET and λ becomes less negative), and this makes the distance dependences of reactions occurring in the inverted driving-force regime fundamentally different from those taking place in the normal regime. From Fig. 2 it is evident that the increase of kET with increasing rDA at relatively short distances relies on a decrease of the ratio −ΔG0ET/λ from values clearly above 1.0 to values closer to 1.0. In other words, at ΔG0ET = −2.0 eV the reaction for rDA = 11 Å is less deeply inverted than for rDA = 8 Å.
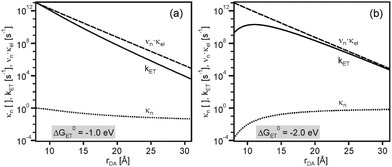 | ||
| Fig. 3 Distance dependences of electron transfer rates (kET, solid lines), the nuclear factor (κn, dotted lines), and the product of frequency factor and electronic factor (νn·κel, dashed lines). Calculated using eqn (1)–(4) and the same set of parameters as for Fig. 2, once with ΔG0ET = −1.0 eV (a) and once with ΔG0ET = −2.0 eV (b). Copyright @ Swiss Chemical Society: CHIMIA 2016, 70, 177; doi: 10.2533/chimia.2016.177. | ||
While the parameters used above (Fig. 2 and 3) are not unusual in any regard, their choice is somewhat arbitrary. In the following we discuss trends that emerge from variation of these parameters with particular emphasis on identifying conditions that favor the appearance of electron transfer rate maxima at large rDA.
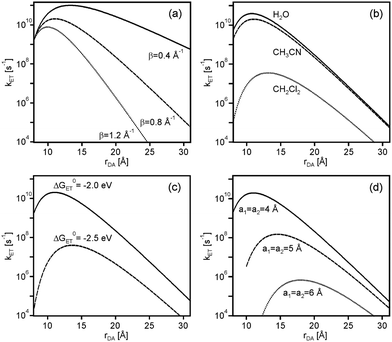
The weaker the contribution of νn·κe is, the stronger the rate enhancing effect of κn can become hence low β values are favorable. This is illustrated in Fig. 4a which shows the distance dependence of kET at ΔG0ET = −2.0 eV for β = 0.4, 0.8, and 1.2 Å−1 with all other parameters kept identical as in Fig. 3.
An increase in solvent dielectric constant entails larger outer-sphere reorganization energies (eqn (4)), lowering the ratio between −ΔG0ET and λ. As noted above, the increase of kET with increasing rDA at relatively short distances relies on a changeover from deeply inverted to less inverted electron transfer, and if the ratio −ΔG0ET/λ is close to 1.0 already at contact distance, then expectable effect is less important. Thus, when going from CH2Cl2 to CH3CN and H2O, the increase of kET between contact and optimal distance calculated for ΔG0ET = −2.0 eV with the parameter set from above amounts to factors of 311, 11, and 7, respectively (Fig. 4b). In practice however, a change in solvent will usually lead to changes in both ΔG0ET and λ.9
In a given solvent, an increase in driving-force at constant λ amplifies the observable effect because the reaction gets more deeply inverted. For example, the rate increase between contact and optimal distance in CH3CN increases from a factor of 11 to a factor of 1636 when going from ΔG0ET = −2.0 eV to ΔG0ET = −2.5 eV (Fig. 4c), and in CH2Cl2 the same driving-force change entails an increase in acceleration factor from 311 to 8.08 × 10⁵ when keeping all other parameters constant.
An increase of the donor and acceptor radii (a1, a2) leads to smaller λo in a given solvent, making the ratio −ΔG0ET/λ larger when keeping all other parameters constant. In consequence, for ΔG0ET = −2.0 eV the rate acceleration between contact and optimal distance in CH3CN increases by factors of 11, 45, and 146 when increasing a1 and a2 from 4 to 5 to 6 Å (Fig. 4d).
Influence of nuclear tunneling
Since the rate maxima at large rDA rely on reactions which occur in the inverted driving-force regime, nuclear tunneling is expected to influence the magnitude of this effect. Nuclear tunneling relies on the overlap of vibrational wavefunctions between the reactant and product state. In the so-called Jortner model (eqn (5)), this vibrational overlap is captured by the Franck–Condon (FC) factor.18 | (5a) |
 | (5b) |
The effect of the Jortner model on the Marcus parabola from Fig. 2 is to make them unsymmetrical, because nuclear tunneling speeds up electron transfer in the inverted region. This is illustrated in Fig. 5a and b (solid lines) where the same parameters as in Fig. 2 were used (λi = 0.1 eV), but now employing eqn (5) with (a) ℏω = 200 meV (1613 cm−1) and (b) ℏω = 450 meV (3630 cm−1). It is evident from these plots that at constant driving-force, nuclear tunneling weakens the effect of rate maxima at large donor–acceptor separations. This is even more obvious from Fig. 5c and d which compares the distance dependences of kET in absence (dotted lines) and in presence (solid lines) of nuclear tunneling at different driving-forces. For ℏω = 450 meV (Fig. 5d), the effect of rate maxima at large donor–acceptor separations has disappeared even at ΔG0ET as high as −2.5 eV.
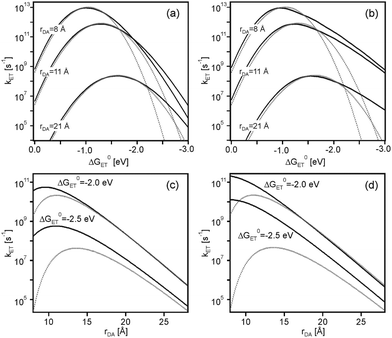 | ||
| Fig. 5 Effect of nuclear tunneling on driving-force dependences at constant distances (a and b) and on distance dependences at constant driving-forces (c and d) in CH3CN. The dotted lines in (a and b) are the same as in Fig. 2, reflecting the situation in absence of nuclear tunneling. The solid lines were calculated using eqn (2)–(5) (i.e., including nuclear tunneling effects) and the following input parameters: H(0)DA = 200 cm−1, β = 0.8 Å−1, λi = 0.1 eV, a1 = a2 = 4 Å, and (a) ℏω = 200 meV (1613 cm−1) or (b) ℏω = 450 meV (3630 cm−1). Note that S = λi/ℏω. The dotted lines in (c and d) are the same as in Fig. 4c, reflecting the situation in absence of nuclear tunneling. The solid lines in (c and d) reflect the situation in presence of nuclear tunneling using the same input parameters as for (a and b), once with ℏω = 200 meV (c) and once with ℏω = 450 meV (d). | ||
Experimental observations of increasing electron transfer rates with increasing donor–acceptor distance
The vast majority of experimental studies reported on electron transfer rates which simply decrease with increasing donor–acceptor separation, either due to superexchange tunneling or multi-step hopping.2a–c,3a,12a,13a,b,19 Some early studies on electron transfer between randomly dispersed donors and acceptors in glassy matrices had invoked the theoretical framework discussed above as a possible explanation for the difficulties associated with observing the inverted driving-force regime in bimolecular electron transfer.20 However, to the best of our knowledge, until very recently direct experimental evidence for the effect pointed out in 1984 by Brunschwig, Ehrenson and Sutin had been elusive.6We recently reported on 3 series of donor–photosensitizer–acceptor triads in which the rates for thermal electron–hole recombination after initial photoexcitation exhibited maxima at large donor–acceptor distances.7 Specifically, the ruthenium(II) photosensitizers of the triads in Fig. 6a were excited selectively at 532 nm, and this lead rapidly to a triarylamine radical cation (TAA+) and an anthraquinone radical anion (AQ−).21 Intramolecular thermal charge recombination was then monitored as a function of distance through variation of the p-xylene spacer lengths (n = 1–3). The important finding was that the rate constant for charge-recombination increased by a factor of 6–10 between the triads with n = 1 and those with n = 2, i.e., an increase in donor–acceptor distance by 8.6 Å was accompanied by an increase of kET by almost one order of magnitude (right part of Fig. 6). Upon further distance elongation, kET then decreased by 2 orders of magnitude (Table 1). In other words, there were rate maxima at a donor–acceptor distance of 30.6 Å.
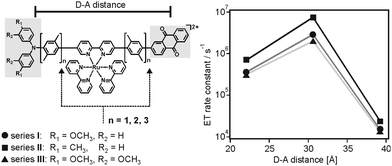 | ||
| Fig. 6 Chemical structure of donor–photosensitizer–acceptor triads and observation of electron transfer rate maxima as a function of donor–acceptor distance.7 Reprinted with permission from M. Kuss-Petermann and O. S. Wenger, J. Am. Chem. Soc., 2016, 138, 1349. Copyright 2016 American Chemical Society. | ||
![[thin space (1/6-em)]](https://www.rsc.org/images/entities/char_2009.gif) :
:![[thin space (1/6-em)]](https://www.rsc.org/images/entities/char_2009.gif) 1 (v/v) CH3CN/H2O at 20 °C.7n is the number of p-xylene bridging units, rDA is the donor–acceptor distance
1 (v/v) CH3CN/H2O at 20 °C.7n is the number of p-xylene bridging units, rDA is the donor–acceptor distance
| n | r DA [Å] | Series I | Series II | Series III |
|---|---|---|---|---|
| 1 | 22.0 | (3.58 ± 0.36) × 105 | (6.90 ± 0.69) × 105 | (3.13 ± 0.31) × 105 |
| 2 | 30.6 | (2.87 ± 0.29) × 106 | (7.41 ± 0.74) × 106 | (2.00 ± 0.20) × 106 |
| 3 | 39.2 | (1.53 ± 0.15) × 104 | (2.43 ± 0.24) × 104 | (1.34 ± 0.13) × 104 |
This unusual observation was explained in the framework of the model illustrated by Fig. 2.6 Temperature-dependent studies indicated that charge-recombination in the triads with n = 2 proceeded in activationless manner, whereas in the systems with n = 1 or n = 3 this process required significant thermal activation. Keeping in mind that the reorganization energy commonly increases with increasing donor–acceptor distance (eqn (4)), the temperature-dependent studies were interpreted in terms of a changeover from the inverted regime (n = 1) to activationless (n = 2) and normal electron transfer (n = 3). This changeover is illustrated by the potential well diagrams in Fig. 7. The reaction free energy (ΔG0ET) is essentially distance-independent in these systems, but the increase in reorganization energy (λ) then leads to decreasing ratios of −ΔG0ET/λ with increasing distance, manifesting in the abovementioned changeover between different regimes. In the investigated triads −ΔG0ET/λ varied from ∼1.4 (n = 1) to ∼0.5 (n = 3).
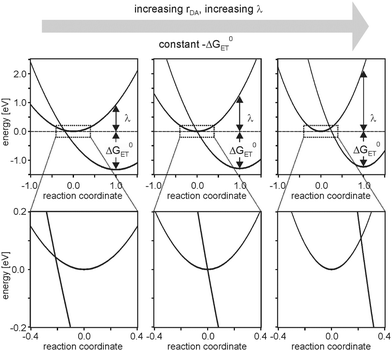 | ||
| Fig. 7 Harmonic potential energy wells for reactant and product states of charge-recombination between AQ− and TAA+ in the triads from Fig. 6. The lower half shows zooms of the key regions from the upper half. Reprinted with permission from M. Kuss-Petermann and O. S. Wenger, J. Am. Chem. Soc., 2016, 138, 1349. Copyright 2016 American Chemical Society. | ||
Two aspects of these studies deserve further comment. First of all, the increase of λ was very large, particularly between the triads with n = 2 (λ = 1.3–1.5 eV) and n = 3 (λ = 2.0–2.2 eV). In principle, reorganization energies up to ∼2.0 eV in CH3CN/H2O mixtures can be explained adequately by the breakage of hydrogen-bonds between anthraquinone radical anion and solvent molecules,22 but it is not obvious why the increase between n = 2 and n = 3 is so large. Second, the decrease of the electronic coupling matrix element (HDA) with increasing distance was extremely shallow, in fact nearly distance-independent for some of the triad systems considered until now. This finding is all the more astonishing in light of prior studies of the distance dependence of electron transfer through oligo-p-xylenes which provided β-values in the range 0.52–0.76 Å−1.23 It is likely that the 2,2′-bipyridine ligand unit and its coordinated ruthenium(II) complex have a strong influence on the electronic donor–acceptor coupling, and there was direct evidence for significant π-conjugation between this 2,2′-bipyridine ligand and its adjacent p-xylene groups.7 Nevertheless, the extent to which HDA is insensitive to distance remains astonishing.
The harmonic potential well model (Fig. 2) used to account for the observation of rate maxima at large donor–acceptor distances is almost certainly too simplistic to grasp the full complexity of the problem, and once more experimental data will be available, then it will be worthwhile considering more sophisticated theoretical treatments. The finding of unusually large reorganization energies and very shallow distance dependences of HDA might have a common origin, for example it is possible that λ and HDA cannot be considered mutually fully independent parameters in some of these systems.
Consequences for light-to-chemical energy conversion
For solar energy conversion one is interested in fast (efficient) photoinduced charge-separation combined with slow (inefficient) thermal charge-recombination.28 Photoinduced charge-separation reactions commonly occur in the normal regime in which −ΔG0ET < λ. Under these conditions, kET simply decreases with increasing rDA hence photoinduced charge-separation is fastest between reactants that are in van-der-Waals contact (upper half of Fig. 8). In terms of converting light into chemical energy it is then desirable for the products (oxidized donor, D+, and reduced acceptor, A−) to diffuse away from one another without undergoing direct charge-recombination. However, charge-recombination frequently occurs in the inverted regime in which −ΔG0ET > λ, and consequently the rate for this undesired reaction can actually increase with increasing separation between D+ and A− to reach an optimum at a critical distance (lower half of Fig. 8). In other words, as D+ and A− diffuse away from each other, the probability for them to undergo undesired charge-recombination actually increases up to a critical distance, and only beyond this point there is a decrease. This effect can severely limit the overall efficiency of light-to-chemical energy conversion.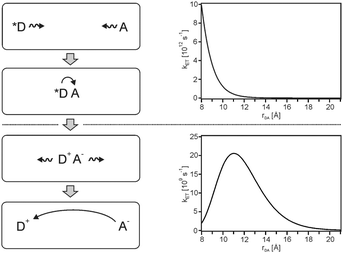 | ||
| Fig. 8 Left: Diffusive motion leading to the formation of an encounter complex between an excited donor (*D) and an acceptor (A), followed by photoinduced charge-separation. Diffusion then separates the photoproducts spatially, but since charge-recombination is usually highly exergonic it can exhibit a rate maximum at large distances. Right: Distance dependences for weakly exergonic (ΔG0ET = −1.0 eV, top) and strongly exergonic reactions (ΔG0ET = −2.0 eV, bottom), calculated using eqn (1)–(4) and the same parameters as in Fig. 2. | ||
Nuclear factor contributions to the distance dependence of kET in other systems
Many studies on proteins focused on activationless electron transfer because under this condition it is possible to isolate the contribution of the electronic factor to the distance dependence of kET.12b In cases in which the electron transfer is not activationless, electronic and nuclear factors both contribute to the distance dependence of kET, and there are a few examples in the literature where the contribution of the nuclear factor became particularly evident. Electron transfer across proline bridges in the three series of dyads from Fig. 9 was triggered by pulse radiolysis through reduction of the Os(III) species (Os–Co, Os–Ru series) or the Ru(bpy)32+ unit (Ru–Co series).24 The distance dependence of kET deviates significantly from strictly mono-exponential behavior in all three dyad series, and this was interpreted in terms of strongly distance-dependence nuclear (κn) and electronic factors (κe).24 Using an approach that expresses the activation parameters for intramolecular electron transfer in terms of transition state theory, activation enthalpies (ΔH‡) and activation entropies (ΔS‡) were determined. It was then argued that under certain assumptions,15a the slope of ΔS‡/R versus distance (R is the universal gas constant) yields the distance decay constant (β) of the electronic factor, whereas the slope of −ΔH‡/R·T versus distance provides the distance decay constant (γ) for the nuclear factor.24 For the Os–Ru dyads from Fig. 9 the assumptions of this approach were justified,24 and the distance dependence of κn turned out to be stronger than that of κe (γ = 0.91 Å−1vs. β = 0.68 Å−1).15a This is a remarkable finding and an instructive example of how important nuclear factor contributions to the distance dependence of kET can be. The parallel to our triads is that we also observe strongly distance dependent nuclear factors (Fig. 7).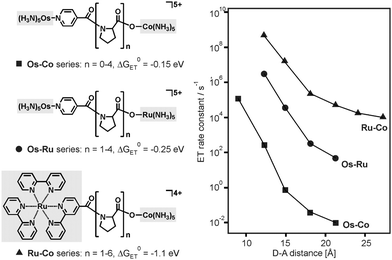 | ||
| Fig. 9 Donor–acceptor dyads with proline bridges and distance dependences of kET after reduction of the donor moieties (left-hand sides) with pulse radiolysis. The change from Os–Co25 to Os–Ru26 and Ru–Co systems27 allowed a change in driving-force (ΔG0ET) from −0.15 to −1.1 eV. | ||
In the Os–Ru dyads from Fig. 9 the reorganization energy increased from 1.22 eV (n = 1) to 1.52 eV (n = 2) to finally 1.78 eV (n = 3), whereas in the case of our own triads from Fig. 6 the change in λ was even larger (0.9–2.2 eV, see above) but this occurred over a significantly greater distance range (17.2 Å compared to 5.9 Å). The driving-force associated with intramolecular electron transfer in the Os–Ru dyads is relatively small (ΔG0ET = −0.25 eV).26 Consequently, a changeover in the ratio between −ΔG0ET and λ from values above 1.0 (indicative of inverted behavior) to values below 1.0 (signaling electron transfer in the normal regime) was not observable in these systems.
Nevertheless, the dyads from Fig. 9 represent early examples of clear-cut cases in which contributions of the nuclear factor to the distance dependence of kET became observable. In other early studies, the model illustrated by Fig. 2 was invoked to explain the difference in the distance dependences of weakly exergonic charge-separation reactions and strong exergonic charge-recombination processes.15c
Conclusions
There are two counter-intuitive scenarios for electron transfer: (i) decreasing rates with increasing driving-force (at constant donor–acceptor distance), and (ii) increasing rates with increasing donor–acceptor distances (at constant driving-force). The first scenario, usually called the inverted driving-force effect,5 is very well known and experimentally well documented.10 The second scenario, while predicted by theory a long time ago,6 is comparatively little known, presumably because unambiguous experimental evidence for it was found only very recently.7Increasing rates with increasing donor–acceptor distances can result from increasing (outer-sphere) reorganization energies (λo) in the inverted driving-force regime, leading to lower activation barriers at constant driving-force. Our recent experimental studies demonstrated that it is even possible to induce a changeover from the inverted to the normal regime by increasing the donor–acceptor separation.7 When dealing with photoinduced electron transfer reactions, this effect becomes important for light-to-chemical energy conversion.
Acknowledgements
Financial support by the Swiss National Science Foundation through grant number 200021-146231/1 is gratefully acknowledged.Notes and references
- (a) D. De Vault and B. Chance, Biophys. J., 1966, 6, 825–847 CrossRef CAS; (b) J. R. Winkler and H. B. Gray, J. Am. Chem. Soc., 2014, 136, 2930–2939 CrossRef CAS PubMed.
- (a) B. Albinsson, M. P. Eng, K. Pettersson and M. U. Winters, Phys. Chem. Chem. Phys., 2007, 9, 5847–5864 RSC; (b) H. B. Gray and J. R. Winkler, Proc. Natl. Acad. Sci. U. S. A., 2005, 102, 3534–3539 CrossRef CAS PubMed; (c) M. Natali, S. Campagna and F. Scandola, Chem. Soc. Rev., 2014, 43, 4005–4018 RSC; (d) F. D. Lewis, J. Q. Liu, W. Weigel, W. Rettig, I. V. Kurnikov and D. N. Beratan, Proc. Natl. Acad. Sci. U. S. A., 2002, 99, 12536–12541 CrossRef CAS PubMed; (e) O. S. Wenger, Inorg. Chim. Acta, 2011, 374, 3–9 CrossRef CAS; (f) D. C. O'Hanlon, B. W. Cohen, D. B. Moravec, R. F. Dallinger and M. D. Hopkins, J. Am. Chem. Soc., 2014, 136, 3127–3136 CrossRef PubMed; (g) A. Helms, D. Heiler and G. McLendon, J. Am. Chem. Soc., 1992, 114, 6227–6238 CrossRef CAS; (h) L. T. Calcaterra, G. L. Closs and J. R. Miller, J. Am. Chem. Soc., 1983, 105, 670–671 CrossRef CAS; (i) H. Oevering, M. N. Paddon-Row, M. Heppener, A. M. Oliver, E. Cotsaris, J. W. Verhoeven and N. S. Hush, J. Am. Chem. Soc., 1987, 109, 3258–3269 CrossRef CAS; (j) S. V. Rosokha, D.-L. Sun and J. K. Kochi, J. Phys. Chem. A, 2002, 106, 2283–2292 CrossRef CAS.
- (a) M. Cordes and B. Giese, Chem. Soc. Rev., 2009, 38, 892–901 RSC; (b) C. Shih, A. K. Museth, M. Abrahamsson, A. M. Blanco-Rodriguez, A. J. Di Bilio, J. Sudhamsu, B. R. Crane, K. L. Ronayne, M. Towrie, A. Vlček, J. H. Richards, J. R. Winkler and H. B. Gray, Science, 2008, 320, 1760–1762 CrossRef CAS PubMed; (c) C. Lambert, G. Nöll and J. Schelter, Nat. Mater., 2002, 1, 69–73 CrossRef CAS PubMed; (d) M. Cordes, A. Kottgen, C. Jasper, O. Jacques, H. Boudebous and B. Giese, Angew. Chem., Int. Ed., 2008, 47, 3461–3463 CrossRef CAS PubMed; (e) J. C. Genereux and J. K. Barton, Chem. Rev., 2010, 110, 1642–1662 CrossRef CAS PubMed; (f) V. Lloveras, J. Vidal-Gancedo, T. M. Figueira-Duarte, J. F. Nierengarten, J. J. Novoa, F. Mota, N. Ventosa, C. Rovira and J. Veciana, J. Am. Chem. Soc., 2011, 133, 5818–5833 CrossRef CAS PubMed; (g) K. E. Linton, M. A. Fox, L. O. Palsson and M. R. Bryce, Chem. – Eur. J., 2015, 21, 3997–4007 CrossRef CAS PubMed.
- (a) W. B. Davis, W. A. Svec, M. A. Ratner and M. R. Wasielewski, Nature, 1998, 396, 60–63 CrossRef CAS; (b) O. S. Wenger, Chem. Soc. Rev., 2011, 40, 3538–3550 RSC.
- R. A. Marcus and N. Sutin, Biochim. Biophys. Acta, 1985, 811, 265–322 CrossRef CAS.
- B. S. Brunschwig, S. Ehrenson and N. Sutin, J. Am. Chem. Soc., 1984, 106, 6858–6859 CrossRef CAS.
- (a) M. Kuss-Petermann and O. S. Wenger, Angew. Chem., Int. Ed., 2016, 55, 815–819 CrossRef CAS PubMed; (b) M. Kuss-Petermann and O. S. Wenger, J. Am. Chem. Soc., 2016, 138, 1349–1358 CrossRef CAS PubMed.
- N. Sutin, Acc. Chem. Res., 1982, 15, 275–282 CrossRef CAS.
- D. Rehm and A. Weller, Isr. J. Chem., 1970, 8, 259–271 CrossRef CAS.
- (a) G. L. Closs and J. R. Miller, Science, 1988, 240, 440–447 CrossRef CAS PubMed; (b) M. R. Wasielewski, M. P. Niemczyk, W. A. Svec and E. B. Pewitt, J. Am. Chem. Soc., 1985, 107, 1080–1082 CrossRef CAS; (c) L. S. Fox, M. Kozik, J. R. Winkler and H. B. Gray, Science, 1990, 247, 1069–1071 CrossRef CAS PubMed.
- H. M. McConnell, J. Chem. Phys., 1961, 35, 508–515 CrossRef CAS.
- (a) P. P. Edwards, H. B. Gray, M. T. J. Lodge and R. J. P. Williams, Angew. Chem., Int. Ed., 2008, 47, 6758–6765 CrossRef CAS PubMed; (b) H. B. Gray and J. R. Winkler, Annu. Rev. Biochem., 1996, 65, 537–561 CrossRef CAS PubMed; (c) E. A. Weiss, M. J. Ahrens, L. E. Sinks, A. V. Gusev, M. A. Ratner and M. R. Wasielewski, J. Am. Chem. Soc., 2004, 126, 5577–5584 CrossRef CAS PubMed; (d) O. S. Wenger, B. S. Leigh, R. M. Villahermosa, H. B. Gray and J. R. Winkler, Science, 2005, 307, 99–102 CrossRef CAS PubMed; (e) M. T. Indelli, C. Chiorboli, L. Flamigni, L. De Cola and F. Scandola, Inorg. Chem., 2007, 46, 5630–5641 CrossRef CAS PubMed; (f) S. Welter, F. Lafolet, E. Cecchetto, F. Vergeer and L. De Cola, ChemPhysChem, 2005, 6, 2417–2427 CrossRef CAS PubMed.
- (a) M. P. Eng and B. Albinsson, Angew. Chem., Int. Ed., 2006, 45, 5626–5629 CrossRef CAS PubMed; (b) O. S. Wenger, Acc. Chem. Res., 2011, 44, 25–35 CrossRef CAS PubMed; (c) K. Pettersson, J. Wiberg, T. Ljungdahl, J. Mårtensson and B. Albinsson, J. Phys. Chem. A, 2006, 110, 319–326 CrossRef CAS PubMed; (d) J. Chen and O. S. Wenger, Chem. Sci., 2015, 6, 3582–3592 RSC; (e) S. F. Nelsen, R. F. Ismagilov and D. R. Powell, J. Am. Chem. Soc., 1998, 120, 1924–1925 CrossRef CAS.
- C. Atienza-Castellanos, M. Wielopolski, D. M. Guldi, C. van der Pol, M. R. Bryce, S. Filippone and N. Martín, Chem. Commun., 2007, 5164–5166 RSC.
- (a) S. S. Isied, A. Vassilian, J. F. Wishart, C. Creutz, H. A. Schwarz and N. Sutin, J. Am. Chem. Soc., 1988, 110, 635–637 CrossRef CAS; (b) E. H. Yonemoto, R. L. Riley, Y. I. Kim, S. J. Atherton, R. H. Schmehl and T. E. Mallouk, J. Am. Chem. Soc., 1992, 114, 8081–8087 CrossRef CAS; (c) E. H. Yonemoto, G. B. Saupe, R. H. Schmehl, S. M. Hubig, R. L. Riley, B. L. Iverson and T. E. Mallouk, J. Am. Chem. Soc., 1994, 116, 4786–4795 CrossRef CAS.
- J. G. Kirkwood and F. H. Westheimer, J. Chem. Phys., 1938, 6, 506–512 CrossRef CAS.
- M. Kuss-Petermann and O. S. Wenger, Chimia, 2016, 70, 177–181 CrossRef CAS PubMed.
- (a) J. Jortner, J. Chem. Phys., 1976, 64, 4860–4867 CrossRef CAS; (b) P. F. Barbara, T. J. Meyer and M. A. Ratner, J. Phys. Chem., 1996, 100, 13148–13168 CrossRef CAS.
- (a) M. R. Wasielewski, Chem. Rev., 1992, 92, 435–461 CrossRef CAS; (b) V. Balzani, Electron transfer in chemistry, VCH Wiley, Weinheim, 2001 CrossRef.
- M. Tachiya and S. Murata, J. Phys. Chem., 1992, 96, 8441–8444 CrossRef CAS.
- (a) J. Hankache and O. S. Wenger, Chem. Commun., 2011, 47, 10145–10147 RSC; (b) J. Hankache, M. Niemi, H. Lemmetyinen and O. S. Wenger, Inorg. Chem., 2012, 51, 6333–6344 CrossRef CAS PubMed; (c) J. Hankache, M. Niemi, H. Lemmetyinen and O. S. Wenger, J. Phys. Chem. A, 2012, 116, 8159–8168 CrossRef CAS PubMed; (d) J. Hankache and O. S. Wenger, Phys. Chem. Chem. Phys., 2012, 14, 2685–2692 RSC; (e) J. Hankache and O. S. Wenger, Chem. – Eur. J., 2012, 18, 6443–6447 CrossRef CAS PubMed; (f) M. Orazietti, M. Kuss-Petermann, P. Hamm and O. S. Wenger, Angew. Chem., Int. Ed., 2016 DOI:10.1002/anie.201604030; (g) A. G. Bonn, O. Yushchenko, E. Vauthey and O. S. Wenger, Inorg. Chem., 2016, 55, 2894 CrossRef CAS PubMed.
- M. Sjödin, S. Styring, B. Åkermark, L. C. Sun and L. Hammarström, J. Am. Chem. Soc., 2000, 122, 3932–3936 CrossRef.
- (a) D. Hanss and O. S. Wenger, Eur. J. Inorg. Chem., 2009, 3778–3790 CrossRef CAS; (b) D. Hanss and O. S. Wenger, Inorg. Chem., 2008, 47, 9081–9084 CrossRef CAS PubMed; (c) D. Hanss and O. S. Wenger, Inorg. Chem., 2009, 48, 671–680 CrossRef CAS PubMed; (d) D. Hanss, M. E. Walther and O. S. Wenger, Coord. Chem. Rev., 2010, 254, 2584–2592 CrossRef CAS; (e) J. Chen, M. Kuss-Petermann and O. S. Wenger, Chem. – Eur. J., 2014, 20, 4098–4104 CrossRef CAS PubMed; (f) J. Chen, M. Kuss-Petermann and O. S. Wenger, J. Phys. Chem. B, 2015, 119, 2263–2273 CrossRef CAS PubMed; (g) M. Kuss-Petermann, H. Wolf, D. Stalke and O. S. Wenger, J. Am. Chem. Soc., 2012, 134, 12844–12854 CrossRef CAS PubMed; (h) M. E. Walther and O. S. Wenger, ChemPhysChem, 2009, 10, 1203–1206 CrossRef CAS PubMed; (i) M. E. Walther, J. Grilj, D. Hanss, E. Vauthey and O. S. Wenger, Eur. J. Inorg. Chem., 2010, 4843–4850 CrossRef CAS; (j) D. Hanss, M. E. Walther and O. S. Wenger, Chem. Commun., 2010, 46, 7034–7036 RSC.
- S. S. Isied, M. Y. Ogawa and J. F. Wishart, Chem. Rev., 1992, 92, 381–394 CrossRef CAS.
- S. S. Isied, A. Vassilian, R. H. Magnuson and H. A. Schwarz, J. Am. Chem. Soc., 1985, 107, 7432–7438 CrossRef CAS.
- A. Vassilian, J. F. Wishart, B. Vanhemelryck, H. Schwarz and S. S. Isied, J. Am. Chem. Soc., 1990, 112, 7278–7286 CrossRef CAS.
- M. Y. Ogawa, J. F. Wishart, Z. Y. Young, J. R. Miller and S. S. Isied, J. Phys. Chem., 1993, 97, 11456–11463 CrossRef CAS.
- T. Higashino, T. Yamada, M. Yamamoto, A. Furube, N. V. Tkachenko, T. Miura, Y. Kobori, R. Jono, K. Yamashita and H. Imahori, Angew. Chem., Int. Ed., 2016, 55, 629 CrossRef CAS PubMed.
| This journal is © the Owner Societies 2016 |

