
 Open Access Article
 This Open Access Article is licensed under a Creative Commons Attribution-Non Commercial 3.0 Unported Licence
pH and concentration dependence of the optical properties of thiol-capped CdTe nanocrystals in water and D2O†
R.
Schneider
ab,
F.
Weigert
a,
V.
Lesnyak
c,
S.
Leubner
c,
T.
Lorenz
d,
T.
Behnke
a,
A.
Dubavik
e,
J.-O.
Joswig
d,
U.
Resch-Genger
*a,
N.
Gaponik
c and
A.
Eychmüller
c
aFederal Institute for Materials Research and Testing (BAM), Richard-Willstätter-Str. 11, 12489 Berlin, Germany. E-mail: ute.resch@bam.de
bInstitute of Chemistry, University Potsdam, Karl-Liebknecht-Straße 24-25, 14476 Potsdam-Golm, Germany
cPhysical Chemistry and Center for Advancing Electronics Dresden, TU Dresden, Bergstr. 66b, 01062 Dresden, Germany
dTheoretical Chemistry, TU Dresden, Bergstr. 66b, 01062 Dresden, Germany
eITMO University, 197101 Saint Petersburg, Russia
First published on 22nd June 2016
Abstract
The optical properties of semiconductor nanocrystals (SC NCs) are largely controlled by their size and surface chemistry, i.e., the chemical composition and thickness of inorganic passivation shells and the chemical nature and number of surface ligands as well as the strength of their bonds to surface atoms. The latter is particularly important for CdTe NCs, which – together with alloyed CdxHg1−xTe – are the only SC NCs that can be prepared in water in high quality without the need for an additional inorganic passivation shell. Aiming at a better understanding of the role of stabilizing ligands for the control of the application-relevant fluorescence features of SC NCs, we assessed the influence of two of the most commonly used monodentate thiol ligands, thioglycolic acid (TGA) and mercaptopropionic acid (MPA), on the colloidal stability, photoluminescence (PL) quantum yield (QY), and PL decay behavior of a set of CdTe NC colloids. As an indirect measure for the strength of the coordinative bond of the ligands to SC NC surface atoms, the influence of the pH (pD) and the concentration on the PL properties of these colloids was examined in water and D2O and compared to the results from previous dilution studies with a set of thiol-capped Cd1−xHgxTe SC NCs in D2O. As a prerequisite for these studies, the number of surface ligands was determined photometrically at different steps of purification after SC NC synthesis with Ellman's test. Our results demonstrate ligand control of the pH-dependent PL of these SC NCs, with MPA-stabilized CdTe NCs being less prone to luminescence quenching than TGA-capped ones. For both types of CdTe colloids, ligand desorption is more pronounced in H2O compared to D2O, underlining also the role of hydrogen bonding and solvent molecules.
Introduction
In the last decades, colloidal semiconductor nanocrystals (SC NCs) have matured from objects and tools of basic research to a class of photoluminescent materials increasingly employed in life and material sciences, optical technologies, and telecommunication. Typical applications range from fluorescent reporters in bioimaging studies, immunohistochemistry, and fluorescence assays to active materials in solar cells, displays, and solid state lighting.1–3 High quality SC NCs present sophisticated core–shell or core-only architectures covered with organic surface ligands that are bound to surface atoms either coordinatively or electrostatically or interact with them via van der Waals forces.4 The type and amount of ligands control not only particle nucleation and growth during synthesis, thereby determining particle core formation, its size and size distribution, yet it also determines SC NC solubility in different media and the choice of suitable conjugation chemistries for subsequent (bio)functionalization. More important, they have a strong impact on the photoluminescence (PL) properties, i.e., the value of the PL quantum yield (PL QY), and partly also on the PL decay kinetics of SC NCs.5 This is related to the passivation of surface defects, i.e., incompletely coordinated metal or chalcogen atoms on the SC NC surface, which eliminates or strongly reduces nonradiative charge trapping decay pathways of optically generated excitons. Hence, the value of the PL QY and the PL decay behavior reflect directly the surface coverage of such NCs.6–8Suitable surface passivation of SC NCs requires a sufficient change in the energetic position of localized trap states for optimum results. In addition, surface ligands can also affect the degree of quantum confinement and can exchange charge carriers with photoexcited SC NCs, depending on the energies of their highest occupied (HOMO) and lowest unoccupied (LUMO) molecular orbitals.9 This underlines the high importance of the strength of the SC NC surface atom–ligand bond for their optical properties, especially for all measurements and applications, where the initial SC NC concentration and/or the SC NC microenvironment are changed. Other factors to be considered include the number of functional groups, ligand size, and the electronic nature of the ligand–surface atom bond as well as the possible removal of surface ligands by protonation of their metal coordinating sites and hence, the ligand's (de)protonation constant (Ka).10,11 This can introduce a pH dependence of the optical properties and the colloidal stability. Moreover, the dielectric constant of the ligand layer can affect SC NC PL. Also, with the aid of properly chosen surface ligands, blinking of SC NC can be suppressed or reduced12 and only recently, it was shown that the PL QY of SC NCs can be restored upon addition of extra surface ligands.13
The influence of ligand–surface interactions on the optical properties of SC NCs is not yet fully understood despite of their importance for many applications of SC NCs and their development into routinely used fluorescent tools. Such interactions are also influenced by size- and material-specific effects including the chemical composition of the SC NC material and more importantly, its surface, as well as the chemical nature of the ligands.8,14 This further complicates the already complex interplay of multiple parameters.
A better understanding of ligand–surface interactions requires simple methods for the determination of the number of surface ligands per SC NC and the shell structure, as was recently shown by us for CdTe colloids synthesized with different shell structures by means of simple tests of the quality of the ligand shell.15,16 Moreover, the rational design of highly emissive SC NCs calls for systematic and really comparable studies on the influence of commonly used surface ligands like short chain mono or bidentate thiols with charged end groups on their optical properties and the influence of pH on SC NC stability and PL. For example, recent studies of the pH dependence of the PL of CdTe NCs capped with thiol ligands like thioglycolic acid (TGA), mercaptopropionic acid (MPA), hydroxyl-terminated 1-thioglycerol (TG), and amine-terminated 1-thioglycerol (MA) revealed a complex correlation between the terminal group of the ligand engaged in free ligand–Cd2+ complexes and secondary coordination, SC NC aggregation induced by protonation of electrostatically stabilizing charged ligands, thiol protonation, and the influence of counter ions.17 Such studies are also important for ligand design, which is being increasingly used e.g., for better control of the nano–bio interface.18–21
Aiming at a deeper understanding of the role of surface ligands, we address here the question how the type and the amount of monodentate thiol surface ligand, pH, and hydrogen bonding as well as SC NC concentration influence the colloidal stability and the PL features of CdTe NC colloids. In this respect, a set of TGA- and MPA-stabilized CdTe SC NCs of representative size was prepared following established methods22–24 and analytically characterized regarding the number of surface ligands per SC NC. Subsequently, their optical properties and colloidal stability were assessed as a function of pH and dilution/SC NC concentration in water as well as in D2O. D2O, used e.g., for NMR studies of the ligand shell of SC NCs25–30 was chosen as a solvent for the characterization of the surface composition of SC NCs in order to assess the influence of hydrogen bonding. We focus here on steady state PL measurements, PL dynamics, and the correlation of the observed changes to obtain information on quenching effects associated with e.g., ligand desorption. Moreover, the results were compared with previously performed studies of ternary CdHgTe SC NCs stabilized with different monodentate thiol ligands.14
Experimental
Materials
All chemicals used were of analytical grade or of the highest purity available and employed as received: Cd(ClO4)2·6H2O (Alfa Aesar), Al2Te3 (Cerac Inc.), NaOH (Aldrich), NaOD (Merck), H2SO4 (Aldrich), DCl (Aldrich), HCl (Aldrich), D2O (Aldrich), TGA (Merck), and MPA (Aldrich). All aqueous solutions were prepared with Milli-Q water (Millipore). The QY standard Nile Red (batch number 333298/1 1196) was obtained from Lambda Physik. Ethanol employed for dissolving of the QY standard was of spectroscopic grade and purchased from Aldrich. For the Ellman's test, 5,5′-dithiobis(2-nitrobenzoic acid) (DTNB, Ellman's reagent) (Aldrich), NaH2PO4 (Aldrich), Na2EDTA (Aldrich), and Na3PO4 (Aldrich) were used.Synthesis of thiol-capped CdTe NCs
MPA- and TGA-capped CdTe NCs were synthesized according to a previously reported procedure.22–24 The initial molar ratio of Cd2+![[thin space (1/6-em)]](https://www.rsc.org/images/entities/char_2009.gif) :Te2−:thiol was set to 1.00:0.75:1.30 for all syntheses. Cd(ClO4)2·6H2O was dissolved in 250 mL of ultrapure water in a three-necked flask equipped with valves and septa, and either TGA or MPA was added under stirring. The pH was adjusted to 12 by dropwise addition of a 1 M NaOH solution and oxygen was removed by flushing with argon for 1 h. H2Te gas, generated by reaction of Al2Te3 lumps with 0.5 M H2SO4, was bubbled through the solution for ca. 30 min in a slow argon stream under stirring. Formation and growth of the NCs proceeded upon reflux. All synthetic key parameters such as temperature, initial molar ratio of Cd, Te, and thiol, reaction volume, and pH were kept constant to ensure identical growth conditions. The as prepared CdTe colloids were concentrated on a rotary evaporator. Unless otherwise stated, all SC NC colloids investigated were purified by precipitation of the as synthesized SC NCs with 2-propanol. The precipitated CdTe NCs were subsequently redispersed either in water or D2O. No special post-preparative treatments to control and reduce the size distribution or to increase PL QY were applied.
:Te2−:thiol was set to 1.00:0.75:1.30 for all syntheses. Cd(ClO4)2·6H2O was dissolved in 250 mL of ultrapure water in a three-necked flask equipped with valves and septa, and either TGA or MPA was added under stirring. The pH was adjusted to 12 by dropwise addition of a 1 M NaOH solution and oxygen was removed by flushing with argon for 1 h. H2Te gas, generated by reaction of Al2Te3 lumps with 0.5 M H2SO4, was bubbled through the solution for ca. 30 min in a slow argon stream under stirring. Formation and growth of the NCs proceeded upon reflux. All synthetic key parameters such as temperature, initial molar ratio of Cd, Te, and thiol, reaction volume, and pH were kept constant to ensure identical growth conditions. The as prepared CdTe colloids were concentrated on a rotary evaporator. Unless otherwise stated, all SC NC colloids investigated were purified by precipitation of the as synthesized SC NCs with 2-propanol. The precipitated CdTe NCs were subsequently redispersed either in water or D2O. No special post-preparative treatments to control and reduce the size distribution or to increase PL QY were applied.
Methods
The pD values provided here present the analog of the pH in D2O solution. These values differ from pH due to the different dissociation constants of H2O and D2O. They can be obtained from pH measurements with a glass electrode in D2O solution according to eqn (1).40
| pD = pHreading + 0.40 | (1) |
Results and discussion
Surface chemistry and spectroscopic properties of TGA- and MPA-stabilized CdTe SC NC
The CdTe SC NCs were characterized by TEM, ICP-OES, the photometric Ellman's test as well as steady state and time-resolved fluorometry. The absorption and emission spectra are illustrated in Fig. 1 and the relevant analytical and spectroscopic properties are summarized in Table 1. As follows from these data, the sizes of the TGA- and MPA-stabilized CdTe samples T2 and M2 and T3 and M3 are comparable, typical TEM images are provided in Fig. S1 (in the ESI†). With PL QY values between 41 and 57%, our CdTe NCs reveal the moderate to high PL QYs to be expected for high quality CdTe colloids.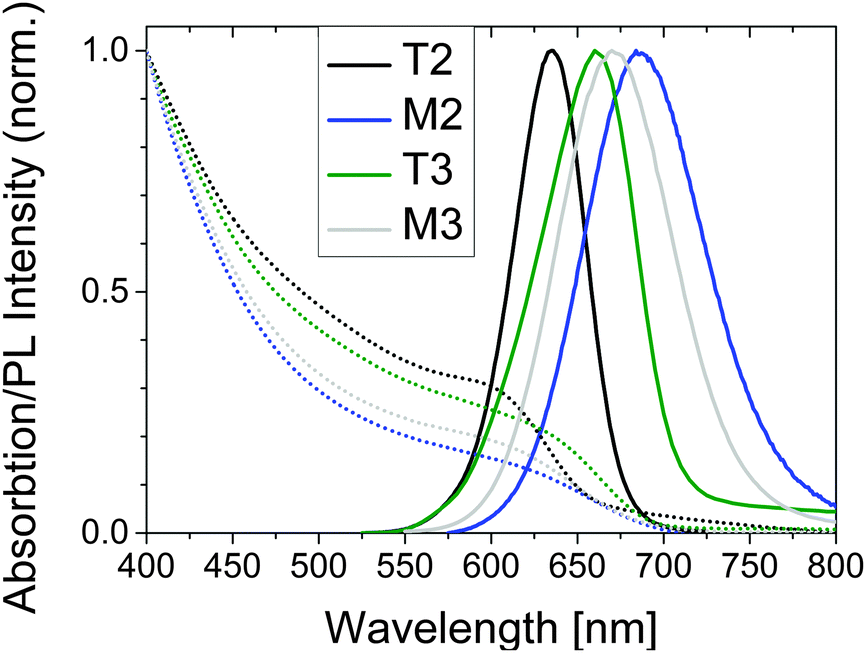 | ||
| Fig. 1 Normalized absorption (dotted lines)- and emission spectra (solid lines) of CdTe-TGA NC samples T2 and T3 and CdTe-MPA NC samples M2 and M3 in water (pH 9). Excitation was at 500 nm. The absorption spectra shown present the wavelength dependence of the measured absorbance. | ||
| Properties | CdTe-TGA T2 | CdTe-TGA T3 | CdTe-MPA M2 | CdTe-MPA M3 |
|---|---|---|---|---|
| Diameter [nm] | 3.3 ± 0.1 | 3.8 ± 0.1 | 3.7 ± 0.1 | 3.5 ± 0.1 |
| First excitonic max. [nm] | 600 ± 6 | 630 ± 6 | 625 ± 6 | 610 ± 6 |
| Emission max. [nm] | 635 ± 2 | 663 ± 2 | 685 ± 2 | 666 ± 2 |
| FWHMem [nm] | 49.6 ± 0.3 | 56.9 ± 1.2 | 82.2 ± 0.6 | 76.7 ± 0.4 |
| PL QY [%] | 57 ± 3 | 47 ± 3 | 42 ± 3 | 41 ± 3 |
| Ligands per SC NC | 173 ± 17 | 154 ± 15 | 402 ± 40 | 337 ± 34 |
Influence of pH
The PL properties of TGA- and MPA-stabilized CdTe colloids are considerably influenced by pH as shown in Fig. 2 for the colloids T2 and M2, with the type of thiol ligand affecting pH-induced spectral and intensity changes. | ||
| Fig. 2 Emission spectra of TGA-stabilized CdTe T2 (top) and MPA-stabilized CdTe M2 (bottom) at constant concentration and different pH in water. Excitation was at 500 nm. | ||
In the case of TGA-stabilized CdTe T2, the spectral position and shape of the emission spectra are not affected by pH in the alkaline pH range. As follows from Fig. 2 (top panel), at pH 7.4 and pH 6.6, the lowest pH values where we could still observe luminescence, the luminescence was slightly blue shifted by 2 nm and 4 nm, respectively. This blue shift was also seen in the absorption spectra (Fig. S4, ESI†) and may provide a hint for particle oxidation as result of ligand desorption.47 No emission was detectable at pH ≤ 6.6.
At pH 4.6, the absorption spectra of TGA-stabilized CdTe show a slight red shift, the absorption starts do decrease, and the dispersion starts to scatter. This suggests protonation-induced PL quenching, accompanied by (and maybe also related to) the onset of particle agglomeration.
In contrast, for the MPA-stabilized CdTe sample M2, a reduction in pH is accompanied by a slight decrease in PL intensity for pH values below 8.4. This diminution in PL intensity becomes more pronounced for pH values ≤ 6.6 (Fig. 2, lower panel) and is accompanied by a considerable red shift in emission. The absorption spectra, however, are barely affected by pH in the range of 9.8 to 4.8 (see ESI,† Fig. S4, right panel) and the dispersion remains transparent. The red shift in emission might be due to an increased contribution of PL originated from surface states. Below pH 4.8, also for MPA-stabilized CdTe NCs, an acidic pH induces particle growth and a change in the particle size distribution, yet the particles remain luminescent even at acidic pH values up to 4.8 and are still colloidally stable. At pH values <4.8, also MPA-capped CdTe NCs aggregate and become nonemissive.
Fig. 3 compares the pH dependence of the TGA- and MPA-stabilized CdTe samples, revealing a diminution in PL QY with decreasing pH for both ligands. While for CdTe-TGA (T2), no emission was detectable at pH ≤ 6.6, the CdTe-MPA sample (M2) was still luminescent at pH 4.8. Moreover, for MPA-stabilized CdTe, the PL QY remained constant above pH 8.4 whereas the PL QY of TGA-capped CdTe steadily increased with increasing pH until pH 9.8. Although PL QY was not measured at more alkaline pH values, considering the slope of the pH-dependent PL QY in comparison to that of the CdTe-MPA sample (M2) shown in Fig. 3, maximum PL QY can be expected for a pH of about 10.
 | ||
| Fig. 3 pH dependence of PL QY of TGA- and MPA-stabilized CdTe T2 and M2 in water. For comparison, the maximum PL QYs are set to 1. The initial PL QY values are given in Table 1. Excitation was at 500 nm. | ||
Our observation of a pH-dependent PL QY agrees well with findings from other groups which observed a similar behavior for CdSe and CdTe NCs stabilized with MPA and other thiolate ligands. For example, Gao et al. observed a higher PL QY at higher, i.e., alkaline pH for TGA-stabilized CdTe,48 and Zhang et al. demonstrated an improved stability of MPA-capped SC NCs at decreasing pH compared to a TGA surface modification.49 In a recent study of TGA- and MPA-stabilized CdHgTe colloids, we also found a decrease in PL QY with decreasing pH for TGA- and MPA-capped CdHgTe SC NCs. For these materials, the PL changes are more pronounced for TGA,14 yet the observed effects were still smaller than the changes occurring for our TGA- and MPA-stabilized CdTe of closely matching size. This underlines the influence of the strength of the ligand–surface atom bond on such dependencies, as the strength of the Hg2+–thiol bond exceeds that of the Cd2+–thiol bond. We ascribe the pH dependence of the PL properties of our TGA- and MPA-functionalized CdTe colloids to a combination of effects, with main contributions arising from the pKa values of the thiol and carboxylic acid groups of the stabilizing ligands and the onset of particle aggregation and in this respect, also from the ligand shell and the overall number of ligands present in solution. With a pKa of 3.6, the carboxylic group of the TGA ligand is slightly more acidic than the carboxylic group of MPA (pKa of 4.32). The pKa of the thiol groups of TGA and MPA shows the same picture with values of 10.56 and 10.84, respectively.50 The improved colloidal stability of the MPA-functionalized particles compared to TGA-capped CdTe is most likely related to the ca. twofold higher ligand density of the MPA-functionalized SC NCs as revealed by the results of the Ellman's test (see also dilution studies in the next section). Obviously, MPA provides a better stabilization at lower pH values and is more favorable for the preservation of PL at lower pH values than TGA. Moreover, our results underline the importance of ligand analysis.
Influence of SC NC concentration on PL QY in H2O and D2O
Dilution studies of the TGA- and MPA-stabilized CdTe colloids in H2O and D2O solutions at a constant pH of 9.0 shown in Fig. 4 revealed a decrease of PL QY for both thiol ligands in H2O for absorbances <0.01 (concentrations below 2 × 10⁻⁷ M). TGA-stabilized colloid T2 seems to be slightly more prone to dilution-induced fluorescence quenching than MPA-capped CdTe NCs M2. A similar reduction in PL QY was previously observed by us for other TGA-stabilized CdTe colloids, with quenching effects depending on SC NC size and hence, surface-to-volume ratio, and on the thickness and morphology of the ligand shell.8 In contrast, dilution with D2O at a pD value of 9.0 did not affect the PL QY within our measurement uncertainty of 5%. Moreover, with values of 60% (T2) and 45% (M2), the PL QYs of both colloids in D2O were slightly higher compared to water. In the literature on II–VI and IV–VI SC NCs, there are various, sometimes even contradictory reports on the quenching and enhancement of the PL of CdSe, CdSe/ZnS, CdTe, and PbS stabilized with different capping agents in different environments and in the presence of various additives.10,51–55 For example, the emission spectra, PL QY, and PL lifetimes of CdSe/ZnS NCs can be affected by the presence of water molecules (humidity), oxygen (as electron acceptor and by energy transfer), and by other electron donors and acceptors. Common explanations for such effects include the passivation of surface states, photoinduced or chemically induced surface transformation or the rearrangement of capping agents on SC NC surfaces, neutralization of local charged centers inside and outside of SC NCs, photoionization and charge transfer between SC NCs and surface ligands. For example, static quenching of the luminescence of CdSe/ZnS SC NCs, stabilized with a mixture of trioctylphosphine oxide, 4-hexadecylamine, and 11-mercaptoundecanoic acid by differently substituted thiol ligands has been reported, with the extent of the PL diminution depending on the size and charge of the water soluble thiol.56 Here, PL quenching was mainly ascribed to charge transfer between the SC NCs and the thiols. Although there exist only very few studies comparing H2O and D2O, differences in the influence on PL between both solvents have been reported for e.g., CdSe/ZnS NC colloids, which were attributed to water solvation and stabilization of a charged surface state.51 We ascribe our findings to two effects or their combination as highlighted in Scheme 1: a shift of the ligand adsorption–desorption equilibrium to the adsorption side, i.e., to the surface-coordinated thiol ligands, by D2O compared to H2O and/or the quenching of the fluorescence of SC NCs with partly removed surface ligands by H2O molecules.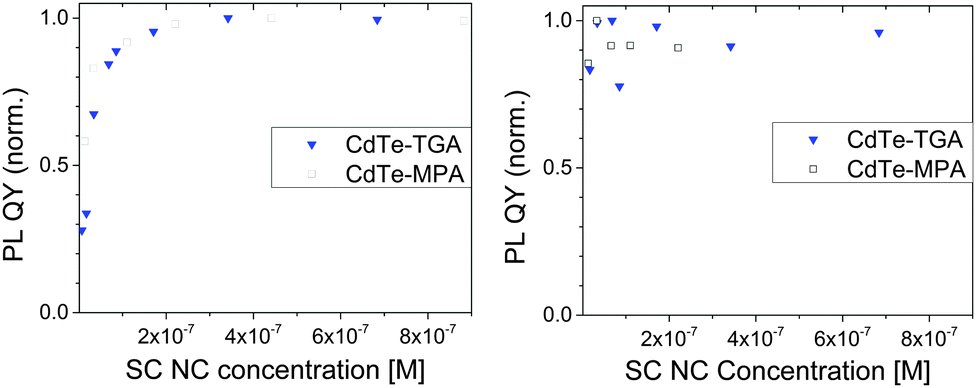 | ||
| Fig. 4 Left: Normalized PL QYs of TGA- and MPA-stabilized CdTe colloids (T2; M2) in H2O (pH 9.0) as a function of SC NC concentration. The highest PL QY was set to 1. The initial PL QY values are given in Table 1. Excitation was at 500 nm. Right: Normalized PL QYs of TGA- and MPA-stabilized CdTe colloids (T2; M2) in D2O (pD 9.4) as a function of SC NC concentration. The highest PL QY was set to 1. The initial PL QY values in D2O are 60% (T2) and 45% (M2), respectively. Excitation was at 500 nm. | ||
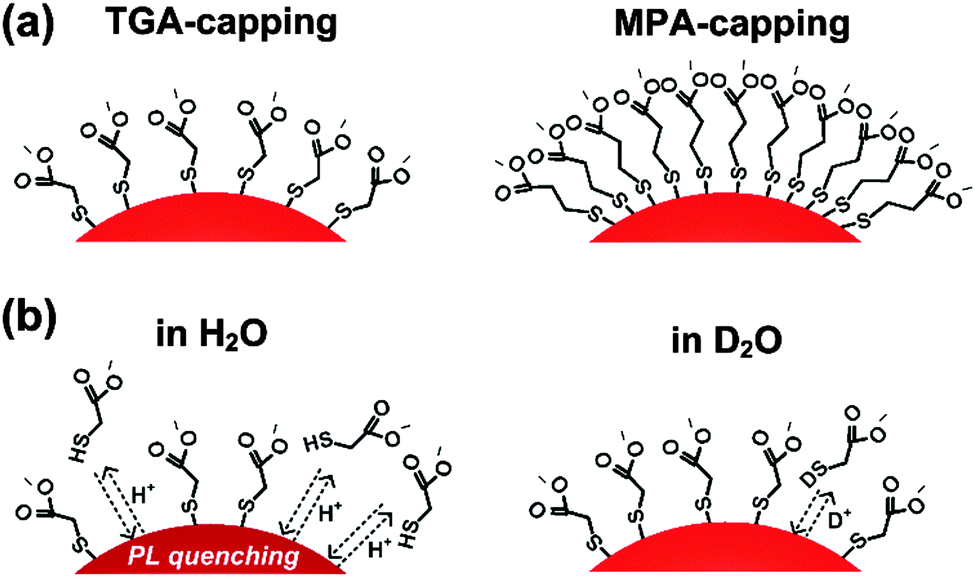 | ||
| Scheme 1 (a) Schematic presentation of the surface of TGA-capped (left) and MPA-capped (right) CdTe NCs; (b) schematic presentation of the influence of solvent molecules on the surface of TGA-capped CdTe NCs dispersed in H2O (left) and in D2O (right). These schematic presentations are not intended to show the actual angle between the CdTe surface and the thiol ligand. | ||
Our findings of a different influence of H2O and D2O on the PL properties of TGA- and MPA-stabilized CdTe encouraged us to perform MD simulations of both solvents for studying their hydrogen bond network. As described in the ESI,† these simulations revealed further differences. Apparently, D2O exhibits 25% less deuterium-bond changes during a simulation time of 30 ps than hydrogen-bond changes occurring in H2O. This correlates with a slightly longer deuterium-bond lifetime. Both effects are caused by the mass differences between deuterium and hydrogen. This affects the vibrational frequencies of both solvents as well, a fact, which is often utilized to identify water-related quenching of the luminescence of molecular and nanoscale lanthanide emitters.57,58 The fact that the deuterium-bond network is longer lasting enables different interactions with the ligands at the SC NC surface, which is reflected by different PL QYs. This suggests that a longer-lasting deuterium-bond can favor a more compact ligand shell and hence, a better passivation of surface defects.
Combined precipitation and dilution studies
For a better understanding of the dilution studies and to demonstrate the influence of dilution on the adsorption/desorption equilibrium and on the optical properties, exemplarily precipitation and dilution experiments were performed. In a first step, the amount of ligands required for SC NC stabilization was assessed. For this purpose, we representatively precipitated as synthesized CdTe-MPA colloid M3 by addition of EtOH, separated the SC NCs from excess ligand in solution by decantation and determined the amount of ligand in the filtrate and bound to the still redispersible colloid by ICP-OES. Our results revealed that in the case of M3, half of the amount of MPA initially applied for SC NC synthesis remained in the filtrate, i.e., in solution. Upon a second washing step, 13% of the remaining ligand shell was removed from the particles, which were nevertheless still redispersible and colloidally stable. More than three precipitation and redispersion steps (PRSs) could not be realized.Subsequently, we performed dilution studies with TGA- and MPA-stabilized CdTe samples T3 and M3 and assessed the spectroscopic properties of these SC NCs after repeated precipitation with EtOH and subsequent redispersion in H2O and D2O. Fig. 5 compares the spectral changes in absorption and emission resulting for TGA-capped samples after successive cycles of precipitation and redispersion (PRS; PRS 1–3) in H2O (upper panel) and D2O (lower panel). As follows from this figure, the changes in the emission of TGA-stabilized CdTe are solvent dependent. In H2O, the emission band shifts to the red with each PRS cycle. In contrast, in D2O, the spectral position of the PL of TGA-capped CdTe does not change by successive PRS after the first precipitation from the aqueous stock solution of the as synthesized SC NCs. The corresponding absorption spectra of TGA-capped CdTe in H2O and D2O are barely affected by successive PRS. The scattering, indicated by an increase in absorbance in the wavelength region of its onset, observed for both samples after three PRS (data not shown), which is accompanied by a slight red shift of the absorption onset, provides hints for Ostwald ripening, particle aggregation, and decrease in colloidal stability. In contrast, in the case of MPA-capped CdTe (data not shown), the absorption spectra and the spectral position of the emission maximum are not affected by the increasing number of PRSs in H2O and D2O. This underlines the beneficial impact of MPA stabilization and the influence of the solvent, i.e., its hydrogen bond network.
 | ||
| Fig. 5 Normalized absorption (dotted lines) and emission spectra (solid lines) of TGA-capped CdTe in H2O (upper panel) and D2O (lower panel) after different precipitation–redispersion steps (PRS; PRS 1–3). Excitation was at 480 nm. The stock solution is the as-synthesized colloid. Absorbances of 0.024 at λex were used in both cases equaling a particle concentration of 2.2 × 10⁻⁷ M. The absorption spectra shown present the wavelength dependence of the measured absorbance. | ||
Subsequently, we performed dilution studies with our TGA- and MPA-stabilized CdTe colloids after each precipitation step, thereby varying the absorbance at the excitation wavelength between 0.01 and 0.10 and hence, the particle concentration in the range of 1 × 10⁻⁶ to 1 × 10⁻⁷ M. The changes in emission and PL QY resulting for both colloids are summarized in Fig. 6 (inset: emission spectra; H2O: blue symbols and curves; D2O: black symbols and curves) for an exemplarily chosen absorbance of 0.024 equaling a particle concentration of 2.2 × 10⁻⁷ M and shown in the ESI† (see Fig. S2) for different particle concentrations and PRSs. As follows from Fig. S2 (ESI†), the PL QY is independent of the particle concentration in the range of 1 × 10⁻⁶ to 1 × 10⁻⁷ M for each precipitation step. As shown in Fig. 6 and Fig. S2 (ESI†) (right panel), the PL QY of the TGA-stabilized CdTe sample decreased with each PRS in both solvents whereas the PL QY of the MPA-capped CdTe colloid (ESI,† Fig. S2, left panel) remained constant even after three PRSs in H2O and in D2O in the chosen absorbance/concentration range. Moreover, the emission spectra of TGA-stabilized CdTe shifted to the red (Fig. 6, inset), thereby reflecting the behavior shown in Fig. 5 (upper panel). In contrast, the emission of MPA-capped CdTe did not change its spectral position upon dilution (see Fig. 6, inset, and also Fig. 5, lower panel). We ascribe the diminution in PL QY resulting for TGA-capped CdTe to the increasing loss of surface ligands accompanying each PRS, which favors the nonradiative recombination of charge carriers. The fact that the PL QY of MPA-stabilized CdTe is barely affected by up to three PRSs is attributed to the denser initial surface coverage provided by MPA, exceeding that of TGA by a factor of about 2, possibly in conjunction with a higher binding constant of this thiol to the CdTe surface atoms.
 | ||
| Fig. 6 PL QY of TGA-stabilized CdTe samples as a function of precipitation steps with EtOH and redispersion in H2O (blue) or D2O (black). The samples were excited at 480 nm and their absorbance at λex was held constant at 0.024 equaling a particle concentration of 2.2 × 10⁻⁷ M. The inset shows the corresponding emission spectra. | ||
In order to assess the influence of pH/pD on such dilution studies, we subsequently performed dilution cycles solely with the more stable MPA-capped CdTe M3 at acidic pD in D2O (pD 6.4) and recorded PL decay curves. The lifetimes calculated from these decay curves, which are summarized in Fig. 7 (inset), represent the time after which the initial fluorescence intensity decreased to the 1/e part of its maximum value. Although the luminescence decay curves of SC NC are occasionally fitted with a double exponential fit, with the resulting decay components being assigned e.g., to the recombination of core states and radiative carrier recombination associated with the involvement of surface states,59,60 we favor here this simple, yet in our opinion more physically meaningful model for SC NC with a distribution of sizes and surface states. An analysis of the lifetime data with stretched exponential fits, yielding decay rate probability functions, as suggested by some authors to obtain a more descriptive picture of the results from time-resolved PL studies with SC NC,61–63 is shown in the ESI.† In addition to time-resolved PL measurements, the PL QY was determined as previously described.
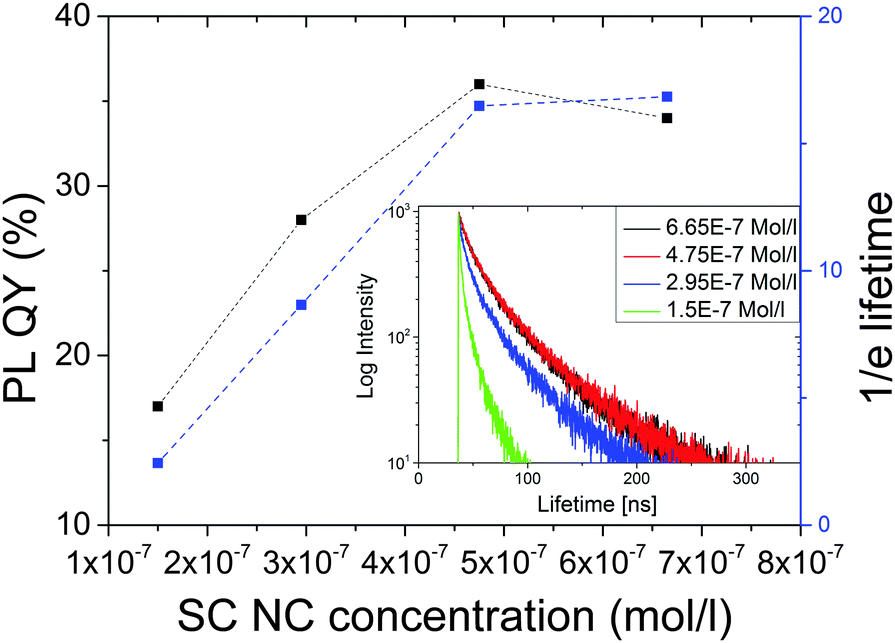 | ||
| Fig. 7 PL QY and 1/e fluorescence lifetime of CdTe-MPA sample M3 upon dilution in D2O at pD 6.4. Inset: Corresponding decay curves. Excitation was at 500 nm. The dashed line presents a guide for the eye only. | ||
As follows from Fig. 7, at acidic pD values, also the PL QY and the PL lifetime of CdTe-MPA becomes concentration-dependent, with a diminution in fluorescence resulting for particle concentrations <5 × 10⁻⁷ M. A strong change in fluorescence intensity accompanied by an unchanged or barely influenced fluorescence lifetime provides a hint for an inhomogeneous quenching (some emitters are quenched while others remain unaffected) whereas a diminution of the fluorescence quantum yield accompanied by a reduction in emission lifetime as observed here presents an indicator for homogeneous quenching, with all emitters being similarly affected.64
Conclusion and outlook
In summary, the influence of pH, particle concentration, and redispersion-dilution cycles on the colloidal stability and photoluminescence properties of a set of analytically well characterized CdTe colloids stabilized with the monodentate thiols TGA and MPA were systematically assessed in water and D2O using steady state and time-resolved fluorometry. Our results clearly demonstrate ligand control of the pH-dependence, of the colloidal stability and PL behavior, i.e., the extent of the pH-related spectral shifts in emission and fluorescence quenching. Moreover, we stress the importance of hydrogen bonding and the stability of the thiol–surface atom bond for the PL properties of ligand-capped SC NCs. MPA-stabilized CdTe colloids revealed an improved stability and a reduced sensitivity to luminescence quenching. The pH dependence of the PL properties of our TGA- and MPA-functionalized CdTe colloids is controlled by different parameters including the pKa values of the thiol and carboxylic acid groups of the capping ligands, the ligand shell itself, and the overall number of ligands present in solution from particle synthesis. This highlights the importance of ligand analysis necessary for the knowledge of the overall ligand concentration and the number of ligands per SC NC for SC NC stability control and optimum PL properties.Our findings provide straightforward tools to compare the quality and performance of CdTe SC NCs functionalized with small monodentate thiol ligands like TGA and MPA, which are the most commonly used stabilizing ligands for these SC NC. Our approach can be most likely transferred to other SC NC and ligand systems in the future. This can be beneficial for the design of SC NCs with improved PL properties. In this respect, we will assess also the size dependence of these effects and perform similar studies with CdTe NCs stabilized with other thiols.
Abbreviations
| pH | Negative logarithm of acid concentration |
| pD | pH equivalent for deuterated solutions |
| SC | Semiconductor |
| NC | Nanocrystal |
| TGA | Thioglycolic acid |
| MPA | Mercaptopropionic acid |
| PL | Photoluminescence |
| QY | Quantum yield |
| HOMO | Highest occupied molecular orbital |
| LUMO | Lowest unoccupied molecular orbital |
| TG | 1-Thioglycerol |
| MA | Amine-terminated 1-thioglycerol |
| NMR | Nuclear magnetic resonance |
| DTNB | 5,5′-Dithiobis(2-nitrobenzoic acid) |
| EDTA | Ethylenediaminetetraacetic acid |
| TEM | Transmission electron microscopy |
| T | Temperature |
| TCSPC | Time-correlated single-photon counting |
| ICP-OES | Inductively coupled plasma-optical emission spectroscopy |
| MD | Molecular dynamics |
| PRS | Precipitation step |
| ex | Excitation |
| em | Emission |
Author contributions
The manuscript was written through contributions of all authors. All authors have given approval to the final version of the manuscript.Acknowledgements
This work was supported by the German Research Council (Deutsche Forschungsgemienschaft DFG; projects EY16/14-3 and RE1203/12-3), M-eraNet (project ICENAP), and the Cluster of Excellence ‘Center for Advancing Electronics Dresden’ (cfaed). R. S. gratefully acknowledges financial support by the BAM graduate student program and the BAM research program MI. Computational time was granted by the Center for Information Services and High Performance Computing (ZIH) of TU Dresden for project QDSIM. We thank Christine Damm (IFW Dresden e.V.) for assistance in performing the TEM imaging and S. Hatami and N. Esendemir for help with the analytical studies. A. D. thanks the Government of the Russian Federation (Grant 074-U01) for financial support through ITMO Post-Doctoral Fellowship scheme.References
- D. V. Talapin, J. S. Lee, M. V. Kovalenko and E. V. Shevchenko, Chem. Rev., 2010, 110, 389 CrossRef CAS PubMed.
- Y. C. Wang, R. Hu, G. M. Lin, I. Roy and K. T. Yong, ACS Appl. Mater. Interfaces, 2013, 5, 2786–2799 CAS.
- M. V. Kovalenko, L. Manna, A. Cabot, Z. Hens, D. V. Talapin, C. R. Kagan, V. I. Klimov, A. L. Rogach, P. Reiss, D. J. Milliron, P. Guyot-Sionnnest, G. Konstantatos, W. J. Parak, T. Hyeon, B. A. Korgel, C. B. Murray and W. Heiss, ACS Nano, 2015, 9, 1012–1057 CrossRef CAS PubMed.
- D. A. Hines and P. V. Kamat, ACS Appl. Mater. Interfaces, 2014, 6, 3041–3057 CAS.
- M. D. Peterson, L. C. Cass, R. D. Harris, K. Edme, K. Sung and E. A. Weiss, in Annu. Rev. Phys. Chem., ed. M. A. Johnson and T. J. Martinez, 2014, vol. 65, pp. 317–339 Search PubMed.
- A. M. Munro, I. J. L. Plante, M. S. Ng and D. S. Ginger, J. Phys. Chem. C, 2007, 111, 6220–6227 CAS.
- M. D. Garrett, A. D. Dukes, J. R. McBride, N. J. Smith, S. J. Pennycook and S. J. Rosenthal, J. Phys. Chem. C, 2008, 112, 12736–12746 CAS.
- M. Grabolle, M. Spieles, V. Lesnyak, N. Gaponik, A. Eychmüller and U. Resch-Genger, Anal. Chem., 2009, 81, 6285–6294 CrossRef CAS.
- K. E. Knowles, M. T. Frederick, D. B. Tice, A. J. Morris-Cohen and E. A. Weiss, J. Phys. Chem. Lett., 2012, 3, 18–26 CrossRef CAS.
- J. Aldana, Y. A. Wang and X. Peng, J. Am. Chem. Soc., 2001, 123, 8844–8850 CrossRef CAS PubMed.
- A. J. Morris-Cohen, M. Malicki, M. D. Peterson, J. W. J. Slavin and E. A. Weiss, Chem. Mater., 2013, 25, 1155–1165 CrossRef CAS.
- A. Mandal and N. Tamai, Appl. Phys. Lett., 2011, 99, 263111 CrossRef.
- Y. Shen, R. Tan, M. Y. Gee and A. B. Greytak, ACS Nano, 2015, 9, 3345–3359 CrossRef CAS PubMed.
- S. Leubner, R. Schneider, A. Dubavik, S. Hatami, N. Gaponik, U. Resch-Genger and A. Eychmüller, J. Mater. Chem. C, 2014, 2, 5011–5018 RSC.
- S. Leubner, S. Hatami, N. Esendemir, T. Lorenz, J. O. Joswig, V. Lesnyak, S. Recknagel, N. Gaponik, U. Resch-Genger and A. Eychmüller, Dalton Trans., 2013, 42, 12733–12740 RSC.
- J. Ziegler, A. Merkulov, M. Grabolle, U. Resch-Genger and T. Nann, Langmuir, 2007, 23, 7751–7759 CrossRef CAS PubMed.
- S. H. Xu, C. L. Wang, Z. Y. Wang, H. S. Zhang, J. Yang, Q. Y. Xu, H. B. Shao, R. Q. Li, W. Lei and Y. P. Cui, Nanotechnology, 2011, 22, 275605 CrossRef PubMed.
- J. Park, J. Nam, N. Won, H. Jin, S. Jung, S. Jung, S. H. Cho and S. Kim, Adv. Funct. Mater., 2011, 21, 1558–1566 CrossRef CAS.
- N. Zhan, G. Palui, A. Kapur, V. Palomo, P. E. Dawson and H. Mattoussi, J. Am. Chem. Soc., 2015, 137, 16084–16097 CrossRef CAS PubMed.
- N. Q. Zhan, G. Palui and H. Mattoussi, Nat. Protoc., 2015, 10, 859–874 CrossRef PubMed.
- G. Palui, F. Aldeek, W. T. Wang and H. Mattoussi, Chem. Soc. Rev., 2015, 44, 193–227 RSC.
- V. Lesnyak, N. Gaponik and A. Eychmüller, Chem. Soc. Rev., 2013, 42, 2905–2929 RSC.
- A. L. Rogach, T. Franzl, T. A. Klar, J. Feldmann, N. Gaponik, V. Lesnyak, A. Shavel, A. Eychmüller, Y. P. Rakovich and J. F. Donegan, J. Phys. Chem. C, 2007, 111, 14628–14637 CAS.
- N. Gaponik, D. V. Talapin, A. L. Rogach, K. Hoppe, E. V. Shevchenko, A. Kornowski, A. Eychmüller and H. Weller, J. Phys. Chem. B, 2002, 106, 7177–7185 CrossRef CAS.
- I. Moreels, J. C. Martins and Z. Hens, Sens. Actuators, B, 2007, 126, 283–288 CrossRef CAS.
- I. Moreels, B. Fritzinger, J. C. Martins and Z. Hens, J. Am. Chem. Soc., 2008, 130, 15081–15086 CrossRef CAS PubMed.
- B. Fritzinger, I. Moreels, P. Lommens, R. Koole, Z. Hens and J. C. Martins, J. Am. Chem. Soc., 2009, 131, 3024–3032 CrossRef CAS PubMed.
- A. Hassinen, I. Moreels, C. de Mello Donegá, J. C. Martins and Z. Hens, J. Phys. Chem. Lett., 2010, 1, 2577–2581 CrossRef CAS.
- B. Fritzinger, R. K. Capek, K. Lambert, J. C. Martins and Z. Hens, J. Am. Chem. Soc., 2010, 132, 10195–10201 CrossRef CAS PubMed.
- R. Gomes, A. Hassinen, A. Szczygiel, Q. Zhao, A. Vantomme, J. C. Martins and Z. Hens, J. Phys. Chem. Lett., 2011, 2, 145–152 CrossRef CAS.
- W. W. Yu, L. H. Qu, W. Z. Guo and X. G. Peng, Chem. Mater., 2003, 15, 2854–2860 CrossRef CAS.
- X. Ji, D. Copenhaver, C. Sichmeller and X. Peng, J. Am. Chem. Soc., 2008, 130, 5726–5735 CrossRef CAS PubMed.
- K. D. Mielenz, E. D. Cehelnik and R. L. McKenzie, J. Chem. Phys., 1976, 64, 370–374 CrossRef CAS.
- C. Würth, M. Grabolle, J. Pauli, M. Spieles and U. Resch-Genger, Nat. Protoc., 2013, 8, 1535–1550 CrossRef PubMed.
- C. Würth, D. Geißler and U. Resch-Genger, Z. Phys. Chem., 2015, 229, 153–165 CrossRef.
- U. Resch-Genger and P. C. DeRose, Pure Appl. Chem., 2012, 84, 1815–1835 CrossRef CAS.
- T. Felbeck, T. Behnke, K. Hoffmann, M. Grabolle, M. M. Lezhnina, U. H. Kynast and U. Resch-Genger, Langmuir, 2013, 29, 11489–11497 CrossRef CAS PubMed.
- G. L. Ellman, Arch. Biochem. Biophys., 1959, 82, 70–77 CrossRef CAS PubMed.
- M. Moser, T. Behnke, C. Hamers-Allin, K. Klein-Hartwig, J. Falkenhagen and U. Resch-Genger, Anal. Chem., 2015, 87, 9376–9383 CrossRef CAS PubMed.
- P. K. Glasoe and F. A. Long, J. Phys. Chem., 1960, 64, 188–190 CrossRef CAS.
- D. Porezag, T. Frauenheim, T. Köhler, G. Seifert and R. Kaschner, Phys. Rev. B: Condens. Matter Mater. Phys., 1995, 51, 12947–12957 CrossRef CAS.
- G. Seifert, D. Porezag and T. Frauenheim, Int. J. Quantum Chem., 1996, 58, 185–192 CrossRef CAS.
- G. Seifert and J.-O. Joswig, Wiley Interdiscip. Rev.: Comput. Mol. Sci., 2012, 2, 456–465 CrossRef CAS.
- M. Elstner, D. Porezag, G. Jungnickel, J. Elsner, M. Haugk, T. Frauenheim, S. Suhai and G. Seifert, Phys. Rev. B: Condens. Matter Mater. Phys., 1998, 58, 7260–7268 CrossRef CAS.
- J. O. Joswig and G. Seifert, J. Phys. Chem. B, 2009, 113, 8475–8480 CrossRef CAS PubMed.
- W. L. Cavalcanti, D. F. Portaluppi and J. O. Joswig, J. Chem. Phys., 2010, 133, 104703 CrossRef CAS PubMed.
- Y. Zhang, J. He, P.-N. Wang, J.-Y. Chen, Z.-J. Lu, D.-R. Lu, J. Guo, C.-C. Wang and W.-L. Yang, J. Am. Chem. Soc., 2006, 128, 13396–13401 CrossRef CAS PubMed.
- M. Gao, S. Kirstein, H. Möhwald, A. L. Rogach, A. Kornowski, A. Eychmüller and H. Weller, J. Phys. Chem. B, 1998, 102, 8360–8363 CrossRef CAS.
- H. Zhang, Z. Zhou, B. Yang and M. Gao, J. Phys. Chem. B, 2003, 107, 8–13 CrossRef CAS.
- S. Xu, C. Wang, H. Zhang, Z. Wang, B. Yang and Y. Cui, Nanotechnology, 2011, 22, 315703 CrossRef PubMed.
- K. Pechstedt, T. Whittle, J. Baumberg and T. Melvin, J. Phys. Chem. C, 2010, 114, 12069–12077 CAS.
- J. Muller, J. M. Lupton, A. L. Rogach, J. Feldmann, D. V. Talapin and H. Weller, Appl. Phys. Lett., 2004, 85, 381–383 CrossRef CAS.
- A. C. S. Samia, X. Chen and C. Burda, J. Am. Chem. Soc., 2003, 125, 15736–15737 CrossRef CAS PubMed.
- S. W. Buckner, R. L. Konold and P. A. Jelliss, Chem. Phys. Lett., 2004, 394, 400–404 CrossRef CAS.
- S. Hatami, C. Wurth, M. Kaiser, S. Leubner, S. Gabriel, L. Bahrig, V. Lesnyak, J. Pauli, N. Gaponik, A. Eychmüller and U. Resch-Genger, Nanoscale, 2015, 7, 133–143 RSC.
- V. V. Breus, C. D. Heyes and G. U. Nienhaus, J. Phys. Chem. C, 2007, 111, 18589–18594 CAS.
- S. Wilhelm, M. Kaiser, C. Wurth, J. Heiland, C. Carrillo-Carrion, V. Muhr, O. S. Wolfbeis, W. J. Parak, U. Resch-Genger and T. Hirsch, Nanoscale, 2015, 7, 1403–1410 RSC.
- R. Arppe, I. Hyppanen, N. Perala, R. Peltomaa, M. Kaiser, C. Wurth, S. Christ, U. Resch-Genger, M. Schaferling and T. Soukka, Nanoscale, 2015, 7, 11746–11757 RSC.
- K. Zhao, J. Li, H. Wang, J. Zhuang and W. Yang, J. Phys. Chem. C, 2007, 111, 5618–5621 CAS.
- S. J. Byrne, S. A. Corr, T. Y. Rakovich, Y. K. Gun'ko, Y. P. Rakovich, J. F. Donegan, S. Mitchell and Y. Volkov, J. Mater. Chem., 2006, 16, 2896–2902 RSC.
- G. Zatryb, A. Podhorodecki, J. Misiewicz, J. Cardin and F. Gourbilleau, Nanoscale Res. Lett., 2011, 6, 106 CrossRef CAS PubMed.
- A. Van Driel, I. Nikolaev, P. Vergeer, P. Lodahl, D. Vanmaekelbergh and W. Vos, Phys. Rev. B: Condens. Matter Mater. Phys., 2007, 75, 035329 CrossRef.
- R. Saito and K. Murayama, Solid State Commun., 1987, 63, 625–627 CrossRef CAS.
- N. C. Bigall, W. J. Parak and D. Dorfs, Nano Today, 2012, 7, 282–296 CrossRef CAS.
Footnote |
| † Electronic supplementary information (ESI) available. See DOI: 10.1039/c6cp03123d |
| This journal is © the Owner Societies 2016 |