
 Open Access Article
 This Open Access Article is licensed under a Creative Commons Attribution-Non Commercial 3.0 Unported Licence
Delineating the conformational flexibility of trisaccharides from NMR spectroscopy experiments and computer simulations†
Mingjun
Yang‡
a,
Thibault
Angles d’Ortoli‡
b,
Elin
Säwén
b,
Madhurima
Jana
ac,
Göran
Widmalm
*b and
Alexander D.
MacKerell
Jr.
*a
aDepartment of Pharmaceutical Sciences, School of Pharmacy, University of Maryland, Baltimore, Maryland 21201, USA. E-mail: alex@outerbanks.umaryland.edu
bDepartment of Organic Chemistry, Arrhenius Laboratory, Stockholm University, S-106 91 Stockholm, Sweden. E-mail: goran.widmalm@su.se
cDepartment of Chemistry, National Institute of Technology Rourkela, Odisha 769008, India
First published on 16th June 2016
Abstract
The conformation of saccharides in solution is challenging to characterize in the context of a single well-defined three-dimensional structure. Instead, they are better represented by an ensemble of conformations associated with their structural diversity and flexibility. In this study, we delineate the conformational heterogeneity of five trisaccharides via a combination of experimental and computational techniques. Experimental NMR measurements target conformationally sensitive parameters, including J couplings and effective distances around the glycosidic linkages, while the computational simulations apply the well-calibrated additive CHARMM carbohydrate force field in combination with efficient enhanced sampling molecular dynamics simulation methods. Analysis of conformational heterogeneity is performed based on sampling of discreet states as defined by dihedral angles, on root-mean-square differences of Cartesian coordinates and on the extent of volume sampled. Conformational clustering, based on the glycosidic linkage dihedral angles, shows that accounting for the full range of sampled conformations is required to reproduce the experimental data, emphasizing the utility of the molecular simulations in obtaining an atomic detailed description of the conformational properties of the saccharides. Results show the presence of differential conformational preferences as a function of primary sequence and glycosidic linkage types. Significant differences in conformational ensembles associated with the anomeric configuration of a single glycosidic linkage reinforce the impact of such changes on the conformational properties of carbohydrates. The present structural insights of the studied trisaccharides represent a foundation for understanding the range of conformations adopted in larger oligosaccharides and how these molecules encode their conformational heterogeneity into the monosaccharide sequence.
Introduction
Saccharides, as well as various glycoconjugates, are essential components in a broad range of biological processes. They serve both structural and functional roles as molecular scaffolds, energy storage units, post-translational modifications, molecular recognition motifs, and modulatory factors, among others.1 In addition, these molecules have industrial and biopharmaceutical applications such as biofuels,2 biocompatible and biodegradable materials,3 human vaccines,4–6 and excipients in drugs.7,8 The monosaccharides are connected together to form oligo- or polysaccharides through the O-glycosidic linkages. Therefore, the conformation of saccharides can be characterized by the dihedral angles about the linkages.9–14 The intriguing relationship between functional variation and conformational heterogeneity of saccharides has stimulated intensive studies using both experimental and simulation approaches in recent years.9,13–18The structure of saccharides is better characterized as an ensemble of conformations in solution instead of one well-defined state because of the intrinsic flexibility along the glycosidic linkages, presenting challenges to both experimental and theoretical studies. NMR spectroscopy is the most widely used experimental techniques to provide distance or dihedral distributions, lifetimes and relaxation rates of specific states or processes in saccharides.19,20 These measurements can characterize the accessible range of conformational space or kinetics of a conversion for flexible saccharide molecules. However, a detailed atomic representation from these studies is difficult to obtain. To overcome this, computational simulations can complement experiments to describe conformational states at an atomic level of detail. In practice, this represents a synergistic approach in which conformational information from simulations is validated by the experimental methods, allowing for improvements in the computational methods with the obtained atomistic models stimulating the design and application of novel experimental analysis from which an improved understanding of the structure–function relationship encoded in saccharides may be obtained.
In this work, we aim to delineate the conformational heterogeneity encoded in different trisaccharides that constitute the structural elements in more complicated oligo- or poly-saccharides. To this end, five representative trisaccharides with different monosaccharide compositions and linkage types with a common theme, viz., vicinal disubstitution either as linear (1 → 2),(1 → 3)-linked or representing branched structures by substituting a monosaccharide with (1 → 2)[1 → 3]- or (1 → 3)[1 → 4]-linked glucosyl residues, were subjected to combined experimental and computational studies (Fig. 1). The five trisaccharides were previously analyzed to different extents using molecular mechanics conformational searches, Monte Carlo or molecular dynamics simulations in conjunction with NMR spectroscopy experiments.21–26 However, further improvements in understanding the conformational properties of these saccharides can be attained due to the advent of improved force fields for carbohydrates,27–33 computational enhanced sampling techniques34–36 and novel NMR experiments37,38 in conjunction with further developed Karplus-type relationships39 that allow for interpretation of transglycosidic heteronuclear 3JCH coupling constants and of homonuclear 3JCC couplings. To this end, site-specifically 13C-labeled versions of compound 3 were synthesized, namely isotopologues having carbon-13 atoms at C1 or C2 of the glucopyranosyl residues thereby facilitating determination of long-range nJCC across the glycosidic linkages related to both the ϕ and ψ torsion angles. In the simulations, the recently developed replica-exchange with concurrent solute scaling and biasing potential (HREST-BP) method35 was employed to perform conformational sampling of the trisaccharides under the CHARMM36 (C36) force field for carbohydrates. The C36 force field has been carefully calibrated against both QM calculations and experimental measurements28,30,40 and has been successfully used for the study of (1 → 4)- and (1 → 6)-linked disaccharides and oligo-saccharides.9,10,13,14,35,36
 | ||
| Fig. 1 Schematic of trisaccharides 1–5. Subscripts on glycosidic torsion angles ϕ and ψ denote the number of the carbon on the ring not containing the anomeric carbon involved in the glycosidic linkage. Atoms are specified as unprimed (O-methyl glycoside sugar residue), singly, or doubly primed as indicated next to the ring oxygen atoms of each residue. Atomic positions that specifically have been 13C-labeled in different versions of compound 3 are highlighted by filled black circles. | ||
The remainder of the paper is organized as follows. The experimental measurements are first described followed by synthesis and simulation details in the method section. The computational section includes a description of approaches by which the conformation of the trisaccharides can be defined. Results of the conformational propensity of these trisaccharides are then presented based on the NMR J coupling constants and effective proton–proton distances combined with an atomic detail interpretation of those results based on the computational data. The conformational heterogeneity is discussed in terms of the sampling along the glycosidic linkages and on the overall conformations based on clustering analysis using linkage dihedrals and Cartesian coordinates.
Experimental section
General
The atoms in some of the middle residues are labeled by a prime and the terminal groups are denoted by a prime or a double prime (Fig. 1). Glycosidic torsion angles ϕ and ψ are denoted by subscripts related to the substitution position (n) and defined by H1–C1–On–Cn and C1–On–Cn–Hn, respectively. The site-specifically 13C-labeled starting materials, D-[1-13C]glucose and D-[2-13C]glucose, both 99 atom% 13C, were obtained from OMICRON Biochemicals, Inc., USA.NMR spectroscopy
NMR experiments were carried out in D2O on trisaccharides 1–5 in the concentration range of 42–96 mM. The translational diffusion experiments were repeated 8–10 times. A pulse field gradient spin-echo experiment (PFG-LED)41 with a fixed diffusion time (Δ = 100 ms) and a pulsed field gradient increasing linearly over 32 steps was used, ranging from 2 to 95% of the maximum gradient strength being 55.7 G s−1. The pulsed field gradients were calibrated using a doped water sample (1% H2O in D2O with 1 mg mL−1 GdCl3) and a literature value of 1.90 × 10⁻⁹ m2 s−1 for the HDO diffusion coefficient in D2O at 25 °C.42Measurements of transglycosidic heteronuclear carbon–proton coupling constants were performed at 30 °C on a 700 MHz Bruker AVANCE III spectrometer equipped with a 5 mm TCI Z-gradient CryoProbe. Proton–proton cross-relaxation rates were measured at 30 °C on 500 and 700 MHz Bruker AVANCE spectrometers equipped with 5 mm TCI Z-gradient CryoProbes, except for 1D NOESY experiments on compound 2 that were performed at 37 °C on a 600 MHz Bruker spectrometer, or 1D T-ROESY experiments for compounds 1 and 5 on 600 and 900 MHz Varian Inova spectrometers equipped with a PFG triple-resonance probe and a 5 mm triple resonance ColdProbe, respectively. Translational diffusion measurements were performed on a 600 MHz Bruker AVANCE III spectrometer equipped with a 5 mm Z-gradient probe at 25 °C. Temperature calibration with MeOD-d443 was carried out prior to each set of experiments.
Measurements of the transglycosidic carbon–proton coupling constants were performed with J-HMBC experiments.44 A three-fold low-pass J-filter (J = 140 Hz, 155 Hz and 175 Hz) was used to suppress 1JCH. Scaling factors of approximately 13.7 and 20.6, calculated from κ = Δ/tmax1, where Δ was at least 60% of the inverse of the smallest coupling constant to be measured, were used to scale the coupling in the indirect (F1) dimension. A spectral width of 6 ppm for 1H and 60 ppm for 13C were used. The experiments were performed with 2048 × 512 points and 32 scans per t1 increment with the echo/antiecho method. Forward linear prediction to 1024 points in the F1 dimension and subsequent zero-filling to 2048 × 8192 points was applied prior to Fourier transformation. Coupling constants were extracted from 1D-projections of the resonances of interest.
Proton–proton cross-relaxation rates were measured using 1D 1H,1H-DPFGSE-NOESY and T-ROESY experiments.24,45 Selective excitations of anomeric protons were enabled using 30–70 ms long SNOB-2 shaped pulses. For each anomeric resonance excited, 6–8 different mixing times between 40 ms and 310 ms were used with a relaxation delay of > 5 T1. The T-ROESY spin-lock was applied with γB1/2π between 2.6 and 3.4 kHz. All spectra were baseline corrected and integrated with the same limits in all mixing times.
For trisaccharide 5 additional cross-relaxation rates were determined at 278 K employing 1D 1H,1H-NOESY and 1D 1H,1H-STEP-NOESY experiments.46 In these cases, selective excitation was achieved by single or double PFGSE modules utilizing 30 ms r-SNOB or i-SNOB-2 shaped pulses for the NOESY experiment and 30–50 ms r-SNOB shaped pulses for the STEP-NOESY experiment. The strengths of the first and second gradient pairs were 15% and 40%, respectively, of the maximum (55.7 G cm−1) for the NOESY experiments. For the STEP-NOESY, the strengths of the gradients were set to 10% or 6.5% for the first and 45% or 15% for the second excitation, respectively. During the STEP-NOESY experiment the resonance from H3 from compound 5 was selectively excited and magnetization transferred to H4 using a 3.8 kHz DIPSI-2 spin-lock with a duration of 20 ms prior to selective excitation of H4. In the STEP-NOESY experiments, zero-quantum coherences were suppressed using the scheme devised by Thrippleton et al.47 where a 30–50 ms adiabatic Chirp pulse with a bandwidth of 20 kHz was applied together with a gradient pulse with 3% of the maximum power. In the NOESY experiment a 20 ms adiabatic Chirp pulse with a bandwidth of 40 kHz was used in combination with a gradient pulse at 6% of the maximum power. For the NOESY as well as the STEP-NOESY experiments, 10–13 cross-relaxation delays between 70–700 ms were collected for each of the excited spins. A spectral width of 6 ppm was sampled using 16 k data points and 512–3072 transients were averaged. The repetition time was 8–10 s, i.e., in all cases longer than 5 × T1. Prior to Fourier transformation, the FIDs of the 1D experiments were zero-filled to 262 k points and multiplied by an exponential line-broadening function of 2 Hz. Baseline correction was performed prior to integration which used the same integration limits for all experiments within a series. The areas of relevant peaks were divided by the area of the inverted peak and least-square fitted to a first order function yielding the cross-relaxation rate constant.
The 13C NMR experiments were recorded at 290 K over 197 ppm with 65![[thin space (1/6-em)]](https://www.rsc.org/images/entities/char_2009.gif) 536 data points and the FIDs were zero-filled to 524 k data points. 13C resonances had a full-width-at-half-maximum of 1.1 Hz prior resolution enhancement. To measure 13C,13C coupling constants from 1D 13C spectra a Lorentzian–Gaussian window function (lb = −1.2 to − 1.0, gb = 0.35–0.8) was applied. The measurements of transglycosidic 2JCC and 3JCC coupling constants were also carried out using one-dimensional INADEQUATE experiments48 for compounds 3-c1′ and 3-c1′′ or selective 1D INADEQUATE experiments49 for compound 3-c2′/c2′′. The latter employed 13C site-selective excitation with a Gaussian shaped pulse of 40 ms duration. The evolution delay, 1/2 × JCC to achieve antiphase 13C magnetization, was nominally set for JCC with a magnitude of 6–8.5 Hz; an acquisition time of 4 s, 9216–18432 transients and 128–256 k data points were used. Zero-filling was performed to 512 k data points and an exponential line-broadening function, lb = 0.3 Hz, was employed. The transglycosidic 3JCH coupling constants visible as additional splittings in the 1H NMR spectra of the resonances from H2 and H3 in compounds 3-c1′ and 3-c1′′, respectively, were extracted by the J doubling methodology50 implemented in-house by a MATLAB script.
536 data points and the FIDs were zero-filled to 524 k data points. 13C resonances had a full-width-at-half-maximum of 1.1 Hz prior resolution enhancement. To measure 13C,13C coupling constants from 1D 13C spectra a Lorentzian–Gaussian window function (lb = −1.2 to − 1.0, gb = 0.35–0.8) was applied. The measurements of transglycosidic 2JCC and 3JCC coupling constants were also carried out using one-dimensional INADEQUATE experiments48 for compounds 3-c1′ and 3-c1′′ or selective 1D INADEQUATE experiments49 for compound 3-c2′/c2′′. The latter employed 13C site-selective excitation with a Gaussian shaped pulse of 40 ms duration. The evolution delay, 1/2 × JCC to achieve antiphase 13C magnetization, was nominally set for JCC with a magnitude of 6–8.5 Hz; an acquisition time of 4 s, 9216–18432 transients and 128–256 k data points were used. Zero-filling was performed to 512 k data points and an exponential line-broadening function, lb = 0.3 Hz, was employed. The transglycosidic 3JCH coupling constants visible as additional splittings in the 1H NMR spectra of the resonances from H2 and H3 in compounds 3-c1′ and 3-c1′′, respectively, were extracted by the J doubling methodology50 implemented in-house by a MATLAB script.
Synthesis
The synthesis of 13C-labeled variants of 3, viz., β-D-[1′-13C]Glcp-(1 → 2)[β-D-Glcp-(1 → 3)]-α-D-Manp-OMe (3-c1′), β-D-Glcp-(1 → 2)[β-D-[1′′-13C]Glcp-(1 → 3)]-α-D-Manp-OMe (3-c1′′), and β-D-[2′-13C]Glcp-(1 → 2)[β-D-[2′′-13C]Glcp-(1 → 3)]-α-D-Manp-OMe (3-c2′/c2′′) were synthesized as follows. A solution of donor ethyl 2,3,4,6-tetra-O-benzoyl-1-thio-β-D-glucopyranoside (0.22–0.53 mmol, 1.5 eq.) and acceptor methyl 4,6-O-benzylidene-α-D-mannopyranoside (0.15–0.35 mmol) in dry CH2Cl2 was stirred for 20 min in the presence of molecular sieves (4 Å, 0.4 g) under N2 atmosphere. NIS (2.2 eq.) followed after 15 min by TfOH (0.15 eq.) were added at 0 °C. The reaction was monitored by TLC and left to stir at room temperature for 1 h. The mixture was then quenched by addition of NEt3 (2.5 eq.) and was filtered through Celite. It was then diluted with CH2Cl2 and washed successively with solutions of satd Na2S2O3, brine and dried over Na2SO4. The solvent was removed in vaccuo and the residue thus obtained was purified by column chromatography (TLC: Rf = 0.40 Tol/EtOAc 3:1) to yield protected disaccharides as a white powders (78–86% yield). The disaccharide intermediate methyl 2,3,4,6-tetra-O-benzoyl-β-D-glucopyranosyl-(1 → 3)-4,6-O-benzylidene-α-D-mannopyranoside (0.08–0.14 mmol) and donor ethyl 2,3-di-O-benzoyl-4,6-O-benzylidene-1-thio-β-D-glucopyranoside (0.16–0.28 mmol, 2 eq.) were stirred for 10 min in dry CH2Cl2 with molecular sieves (4 Å, 0.2 g) at room temperature under N2. The reaction mixture was then cooled to 0 °C and NIS (2.6 eq.) was added. TfOH (0.2 eq.) was added dropwise 15 min later at the same temperature. The reaction was quenched by addition of NEt3 after 2 h and filtered through Celite. The solution was diluted in CH2Cl2 and washed successively with solutions of satd Na2S2O3, brine and dried over Na2SO4. The solvent was removed in vaccuo and the residue thus obtained was purified by column chromatography (TLC: Rf = 0.75 Tol/EtOAc 3:1) to yield protected trisaccharides as a colorless oils (72–78% yield).
To a solution of protected trisaccharide (0.06–0.09 mmol) in 80% AcOH (aq.) was added a few drops of THF. The reaction mixture was heated to 70 °C for 2 h and monitored by TLC. Once the reaction was completed, the mixture was diluted with Tol and solvents were co-evaporated. The crude oil was purified by column chromatography (TLC: Rf = 0.40 CH2Cl2/Acetone 3:1) to yield protected trisaccharides intermediates as colorless oils (65–71% yield). Tetraol methyl 2,3-di-O-benzoyl-β-D-glucopyranosyl-(1 → 2)[2,3,4,6-tetra-O-benzoyl-β-D-glucopyranosyl-(1 → 3)]-α-D-mannopyranoside (0.04–0.06 mmol) was dissolved in methanol (2 mL), a few drops from a 1 M solution of NaOMe in MeOH were added to reach pH = 9 and the mixture was stirred at room temperature overnight. TLC (Rf = 0.1, EtOAc/MeOH/H2O 7:2:1) analysis indicated completion of the reaction and the solution was neutralized with Dowex-H+. The resin was filtered, washed with methanol and solvents were evaporated. The product methyl β-D-glucopyranosyl-(1 → 2)[β-D-glucopyranosyl-(1 → 3)]-α-D-mannopyranoside was obtained in 89–93% yield as white powders. The trisaccharide obtained was then purified on t-C18 Sep-Pak® cartridges and isolated by gel permeation chromatography using an ÄKTA™ system equipped with a Superdex™ column (GE Healthcare, Uppsala, Sweden). The eluent system was H2O with 1% BuOH at a flowrate of 1 mL min−1. UV and RI detection were used to monitor elution. 1H and 13C NMR data were in complete agreement with literature data.51 HRMS of 3-c1′: [M + Na]+m/z calculated for C1813CH34O16Na 542.1773, found 542.1783, 3-c1′′: [M + Na]+m/z calculated for C1813CH34O16Na 542.1773, found 542.1788, 3-c2′/c2′′: [M + Na]+m/z calculated for C1713C2H34O16Na 543.1806, found 543.1824.
Computational details
Molecular dynamics (MD) simulations were performed with the program CHARMM52 under the CHARMM36 additive force field for carbohydrates28,30,40 and the CHARMM TIP3P water model.53–55 Each one of the five trisaccharides was solvated in a 32 Å × 32 Å × 32 Å water box. In the simulations the temperature was maintained using the Hoover extended system algorithm with a thermal piston mass of 1000 kcal mol−1 ps−2.56 A constant pressure of 1 atm was realized using the Langevin piston algorithm with a collision frequency of 20 ps−1 and mass of 1630 amu.57 The covalent bonds involving hydrogen atoms were constrained with the SHAKE algorithm and a time step of 2 fs was used to integrate the equation of motion.58 The nonbonded Lennard-Jones interactions were computed within a cutoff of 12 Å, with a smoothing switch function over the range from 10 to 12 Å. The electrostatic interactions were treated by the particle mesh Ewald method with a real space cutoff of 12 Å, a charge grid of 1 Å, and the 6th order spline function for mesh interpolation.59Conformational sampling in the MD simulations was enhanced by applying the recently developed Hamiltonian replica exchange with concurrent solute scaling and biasing potential (HREST-BP) method.35,36 A total of 6 replicas were carried out for each system and exchanges attempted every 1000 MD steps according to the Metropolis criterion. In HREST-BP simulations, the scaling temperatures were assigned to 303 K, 324 K, 351 K, 382 K, 414 K and 450 K, with the ground-state replica temperature of 303 K selected to correspond to the experimental studies. The Hamiltonian biasing potential was constructed using the 2-dimensional grid-based correction map (bpCMAP) along the torsional dihedrals O5–C1–On–Cn/C1–On–Cn–Cn+1 for each glycosidic linkage in the trisaccharides,36 where On, Cn and Cn+1 are atoms at the reducing-end monosaccharide of the linkage. The distribution of scaling factors for the bpCMAPs across the perturbed replicas was determined as previously described and the acceptance ratio between different neighboring replicas was examined to guarantee that sufficient exchanges were being obtained.35 Each replica was simulated for 40 ns for the production runs. All the production HREST-BP simulations were carried out in CHARMM using the replica exchange module REPDST with BLOCK to scale the solute–solute and solute–solvent interactions,52,60 and with CMAP to apply the 2D biasing potentials along each one of the glycosidic linkages,61,62 respectively. For trisaccharide 1, a second 100 ns HREST-BP simulation was carried out to examine the convergence of sampling about the linkage motions, which shows adequate conformational sampling obtained from a simulation time of 40 ns by comparing the free energy profiles with 40 and 100 ns trajectories (see Fig. S1 in ESI†).
Coordinates from the 40 ns trajectory from the ground-state replicas were saved every 1 ps for various data analyses. The reparametrized Karplus equation JCX/SU09,39 which takes the uncertainty and flexibility of the torsion angles, the in-plane effect, and the inner oxygen substituents of the model compound into account, was employed to compute NMR heteronuclear proton–carbon and homonuclear carbon–carbon NMR coupling constants, as shown in eqn (1)–(4)
| 3JCH(ϕ) = 6.54 cos2(ϕ − Δ) − 0.62 cos(ϕ − Δ) − 0.17 | (1) |
| 3JCH(ψ) = 6.54 cos2(ψ) − 0.62 cos(ψ) + 0.33 + 0.6exp(κcos(ϕO5 − 180))/exp(κ) | (2) |
| 3JCC(ϕC2) = 3.72 cos2(ϕC2 + Δ) − 0.08 + CIP | (3) |
| 3JCC(ψC1) = 4.28 cos2(ψC1) − 0.11 + 0.6exp(κcos(ϕO5 − 180))/exp(κ) + CIP | (4) |
From simulations, the effective 1H,1H distances in trisaccharides 1–5 were calculated according to eqn (5).
| 1/r = 〈r−6〉1/6 | (5) |
The free energy or potential of mean force (PMF) along one or two linkage dihedrals was computed from the unperturbed ground-state replica under the NPT ensemble as,
 | (6) |
Results and discussions
Experimental and computational studies were performed for the five trisaccharides shown in Fig. 1. The selected trisaccharides include the monosaccharides glucose and mannose, which have different anomeric configurations, with the monosaccharides connected by (1 → 2)-, (1 → 3)- and/or (1 → 4)-glycosidic linkages. Trisaccharides 1, 2, 4 and 5 are all composed of glucose monosaccharides while there is one mannose residue in trisaccharide 3. These represent a range of saccharide structural variability and connectivity some of which occur in larger biologically important oligo- and polysaccharides.65,66To delineate the conformational heterogeneity of these trisaccharides, the J coupling parameters and 1H,1H-effective distances, which are all conformationally sensitive, were measured with NMR spectroscopy.19 To obtain an atomic-detail resolution picture of the conformational properties and compare with experimental measurements, MD simulations were carried out for each trisaccharide in aqueous solution using the HREST-BP enhanced sampling method.35 Previous studies have shown that simulations with HREST-BP can enhance the sampling of different conformational states along both the glycosidic linkages and the noncontiguous monosaccharide-monosaccharide distances and thus provide sufficient conformational sampling within a simulation time of 40 ns for the trisaccharide systems (see Fig. S1 in ESI†).35,36 Simulations herein used the CHARMM36 additive force field for hexopyranoses,28,30 which has been shown to yield good agreement between the computed and experimentally measured J coupling constants and effective 1H,1H distances for various disaccharides.9,14
NMR spectroscopy
Conformational aspects of trisaccharides 1–5 were investigated in D2O solution at 303 K where they have a rotational correlation time τc ≈ 235 ps, as determined from translational diffusion NMR experiments being Dt = 3.19 × 10⁻¹⁰ (SD 0.06 × 10⁻¹⁰) m2 s−1 in D2O at 298 K. The NMR observables 1H,1H cross-relaxation rates and homo- as well as heteronuclear spin–spin coupling constants nJCC and 3JCH, respectively, were determined; these were used to derive experimental proton–proton distances and analyzed employing Karplus-type relationships for the latter. To this end 1D 1H,1H-NOESY and 1D 1H,1H-T-ROESY experiments (Fig. 2)24,45 were performed at high magnetic field strengths corresponding to a 1H resonance frequency of up to 900 MHz in order to obtain better resolved spectra. In some cases severe spectral overlap limited the analysis and a 1D STEP-NOESY experiment46 was carried out for compound 5 (Fig. 3), which facilitated the cross-relaxation rate to be obtained for the H4–H1′′ interresidue interaction in an efficient way via a PANIC-based analysis of the NOE buildup curve.67,68 The 1H,1H cross-relaxation rates for the trisaccharides were also obtained by extrapolation to zero mixing time (Fig. 4a) as devised by Dixon et al.69 and data for compounds 1–5 are compiled in Table 1. The corresponding proton–proton distances, using r−6-averaged effective reference distances from the MD simulations (vide infra), in conjugation with eqn (5) lead to experimentally determined 1H,1H distances in the trisaccharides (Table 2).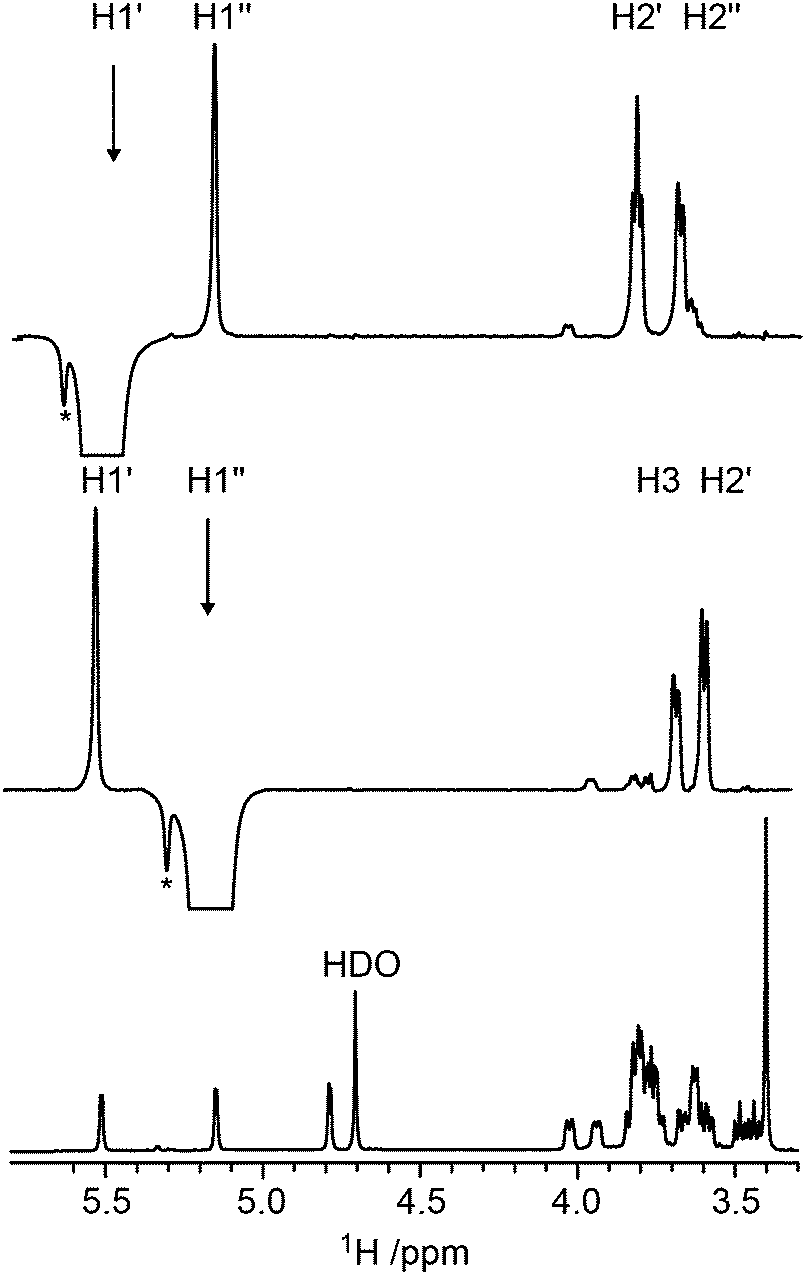 | ||
| Fig. 2 1H NMR spectrum of trisaccharide 1 (bottom) at 14.1 T; 1D 1H,1H-T-ROESY NMR spectrum (τmix = 210 ms) of 1 in which the anomeric proton H1′′ has been selectively excited (middle); the corresponding 1H,1H-T-ROESY spectrum with the anomeric proton H1′ selectively excited (top). The asterisk denotes unknown impurities in the sample. | ||
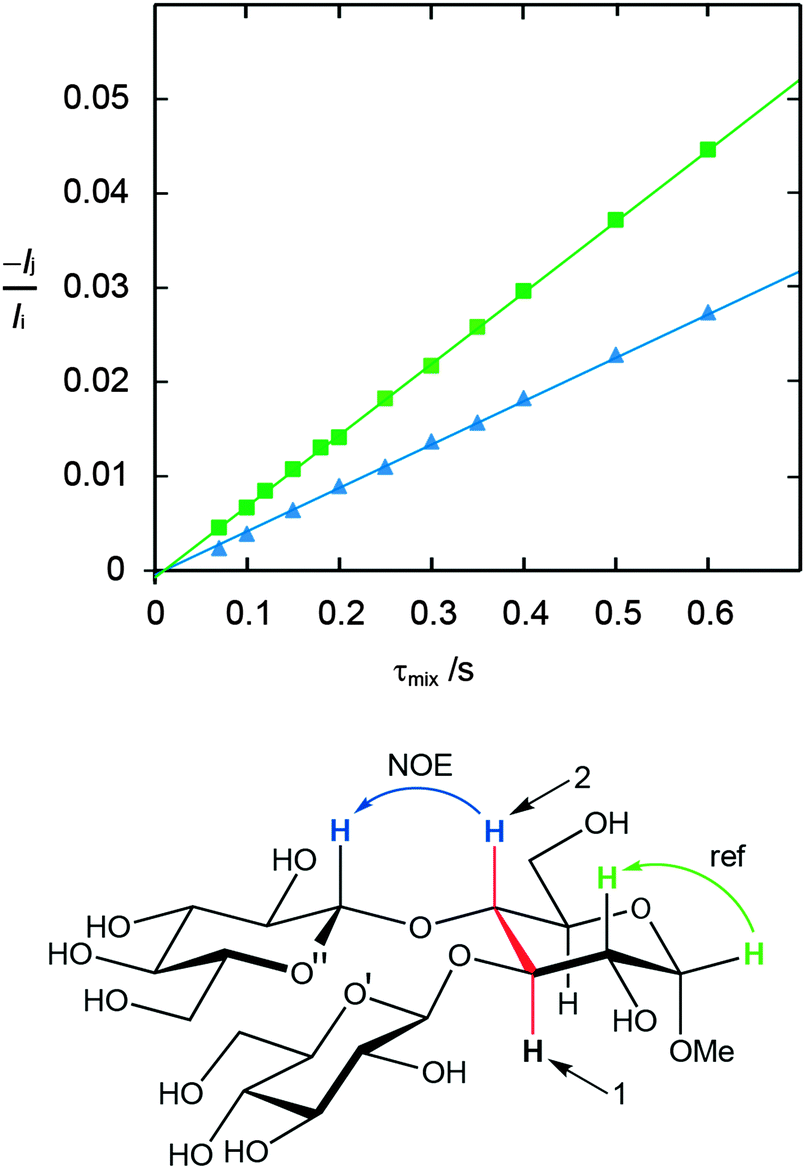 | ||
| Fig. 3 Schematic of the STEP-NOESY experiment for measuring the cross-relaxation rate between H4 and H1′′ in trisaccharide 5; selective excitation of H3 (1), followed by isotropic mixing transfers magnetization to H4, which then can be selectively inverted (2), for subsequent cross-relaxation to H1′′ (bottom). 1H,1H-NOE buildup curves for 5 obtained at a 600 MHz spectrometer frequency employing the PANIC approach in which −Ij/Iivs. τmix are plotted. The cross-relaxation rates are obtained from the slopes of the fitted data: H4–H1′′ (filled blue triangles) and the reference distance H1–H2 (filled green squares) (top); the NMR data of the latter interaction were obtained from a 1D NOESY experiment. | ||
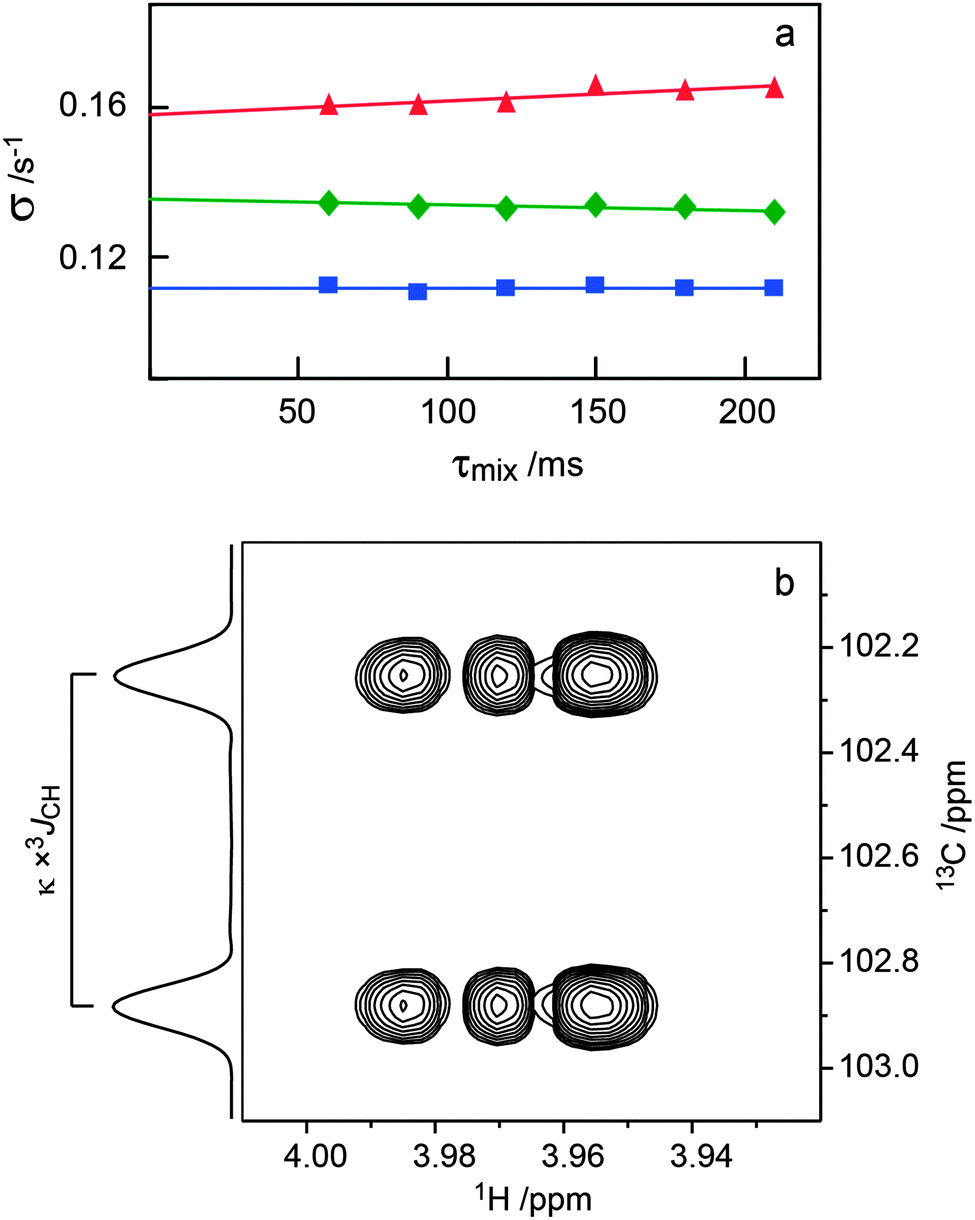 | ||
| Fig. 4 (a) Plots of −Ij(τmix)/[τmixIi] versus τmix for the 1D 1H,1H-T-ROESY experiment applied to trisaccharide 1 (cf.Fig. 2). Selective excitation was carried out for the resonance from H1′ and cross-relaxation observed to H3 (red filled triangle), H1′′ (green filled diamond) and H2′ (blue filled square) were investigated. (b) Selected spectral region of the 1H,13C-J-HMBC NMR spectrum of 4 recorded with κ = 20.6 showing the cross-peak between C1′′ and H4. The 3JC1′′,H4 coupling constant is obtained from the cross-peak separation in the F1-dimension by dividing by the scaling factor κ. The 1D projection is plotted to the left the 2D spectrum. | ||
| Compound | 1 | 2 | 3 | 4 | 5 | |||||||||
|---|---|---|---|---|---|---|---|---|---|---|---|---|---|---|
| Proton pair | σ T-ROE 900 MHz | σ T-ROE 600 MHz | Proton pair | σ T-ROE 700 MHz | |σNOE|c,d600 MHz | σ T-ROE 500 MHz | Proton pair | σ T-ROE 600 MHz | |σNOE| 600 MHz | Proton pair | σ T-ROE 700 MHz | Proton pair | σ T-ROE 900 MHz | |σNOE|d,e600 MHz |
| a Cross-relaxation rates from ref. 24. b Pertinent cross-relaxation rates used as reference for 1–5. c Acquired at 37 °C. d Zero-quantum suppression filter used47 and data analyzed using the PANIC approach.68 e Acquired at 5 °C. f Acquired using a STEP-NOESY experiment.46 | ||||||||||||||
| H1′–H3 | 11.8 | 16.8 | H1′′–H1′ | 0.47 | H1′–H1 | 11.5 | 3.4 | H1′–H1′′ | 0.457 | H1′–H3 | 6.95 | |||
| H1′–H1′′ | 10.2 | 13.1 | H1′′–H2′ | 6.00 | H1′–H2 | 15.9 | 4.15 | H1′–H3 | 14.3 | H1′′–H3 | 2.55 | |||
| H1′′–H2′ | 6.75 | 8.16 | H1′′–H2 | 0.90 | H1′′–H2 | 11.8 | 3.35 | H1′–H2′′ | 0.901 | H1′′–H5 | 0.877 | |||
| H1′′–H3 | <0.820 | H1′′–H5′′ | 0.33 | H1′′–H3 | 12.0 | 4.45 | H1′′–H4 | 11.9 | H1′–H3′ | 4.28 | ||||
| H1′–H2′ | 8.50b | 11.8b | H1′′–H2′′ | 5.31b | H3–H5 | 8.4b | 2.2b | H1′–H2′ | 9.65b | H1′–H5′ | 7.66 | |||
| H1′′–H3′′ | 4.67 | |||||||||||||
| H1′′–H5′′ | 7.52b | |||||||||||||
| H1′′–H2 | 1.68 | 1.87 | H1′′–H4 | 4.61f | ||||||||||
| H1′′–H5′′ | 0.988b | 1.14b | H1–H2 | 7.55b | ||||||||||
| Compound | 1 | 2 | 3 | 4 | 5 | ||||||||||||||
|---|---|---|---|---|---|---|---|---|---|---|---|---|---|---|---|---|---|---|---|
| Proton pair | r HH | r T-ROE 900 MHz | r T-ROE 600 MHz | Proton pair | r HH | r T-ROE 700 MHz | r NOE 600 MHz | r T-ROE 500 MHz | Proton pair | r HH | r T-ROE 600 MHz | r NOE 600 MHz | Proton pair | r HH | r T-ROE 700 MHz | Proton pair | r HH | r T-ROE 900 MHz | r NOE 600 MHz |
| a 1/r = <r−6 >1/6 computed from the 40 ns trajectory of ground-state replica. b r ij = rref(σref/σij)1/6. c Reference distance. d Pearson’s correlation coefficient (R) and RMSD computed between experimental and simulated results. | |||||||||||||||||||
| H1′–H3 | 2.33 | 2.31 | 2.30 | H1′′–H1′ | 3.69 | 3.59 | H1′–H1 | 2.42 | 2.35 | 2.31 | H1′–H1′′ | 4.10 | 3.99 | H1′–H3 | 2.49 | 2.34 | |||
| H1′–H1′′ | 2.26 | 2.37 | 2.40 | H1′′–H2′ | 2.33 | 2.35 | H1′–H2 | 2.42 | 2.23 | 2.23 | H1′–H3 | 2.22 | 2.25 | H1′′–H3 | 2.86 | 2.76 | |||
| H1′′–H2′ | 2.56 | 2.54 | 2.59 | H1′′–H2 | 3.34 | 3.22 | H1′′–H2 | 2.37 | 2.34 | 2.31 | H1′–H2′′ | 3.27 | 3.56 | H1′′–H5 | 3.60 | 3.30 | |||
| H1′′–H3 | 3.69 | >3.60 | H1′′–H5′′ | 3.65 | 3.82 | H1′′–H3 | 2.47 | 2.34 | 2.20 | H1′′–H4 | 2.39 | 2.32 | H1′–H3′ | 2.51 | 2.54 | ||||
| H1′–H2′ | 2.44c | 2.44c | 2.44c | H1′′–H2′′ | 2.40c | 2.40c | H3–H5 | 2.48c | 2.48c | 2.48c | H1′–H2′ | 2.40c | 2.40c | H1′–H5′ | 2.30 | 2.30 | |||
| H1′′–H3′′ | 2.52 | 2.50 | |||||||||||||||||
| H1′′–H5′′ | 2.31c | 2.31c | |||||||||||||||||
| H1′′–H2 | 3.34 | 3.34 | 3.36 | H1′′–H4 | 2.45 | 2.62 | |||||||||||||
| H1′′–H5′′ | 3.65c | 3.65c | 3.65c | H1–H2 | 2.41c | 2.41c | |||||||||||||
| R | 1.00 | 0.83 | 1.00 | 0.99 | 1.00 | 0.50 | 0.26 | 0.98 | 0.99 | 1.00 | |||||||||
| RMSDd | 0.06 | 0.07 | 0.00 | 0.10 | 0.01 | 0.11 | 0.16 | 0.14 | 0.13 | 0.12 | |||||||||
Spin–spin coupling constants across the glycosidic linkage are complementary to the interresidue proton–proton distances obtained from NOE and T-ROE experiments and are analyzed and interpreted by Karplus-type relationships. The heteronuclear 3JCH coupling constants, compiled in Table 3, were determined by J-HMBC (Fig. 4b) and 1DLR experiments.44,70,71 Homonuclear 3JCC as well as 2JCC coupling constants will supply additional information on conformational preferences at glycosidic linkages. They are attainable by e.g.1H-detected IPAP DEPT-INADEQUATE experiments,37 albeit at long acquisition times with high concentrations of compounds. Alternatively, isotopologues, 13C-labeled at the anomeric carbon and at the glycosyloxylated carbon atom,14i.e., the carbon at the linkage position of a glycosidic linkage, efficiently results in six transglycosidic J couplings, viz., 3JH1′,Cn, 3JC1′,Hn, 3JC2′,Cn, 3JC1′,C(n−1), 3JC1′,C(n+1), and 2JC1′,Cn, where n is the substitution position, although this requires synthesis of the site-specifically labeled oligosaccharide.72 An alternative approach to obtaining most of these homonuclear coupling constants is to synthesize isotopologues that are only 13C-labeled in the non-reducing residue at the glycosidic linkage of an oligosaccharide, e.g., in a rhamnose-containing disaccharide at C1′ thereby giving information related to the ψ torsion angle73 as well as at C2′ for which the 3JCC coupling constant reports on the ϕ torsion angle preferences.74
| Compound | 1 | 2 | 3 | 4 | 5 | Compound | 3 | |||||||||||
|---|---|---|---|---|---|---|---|---|---|---|---|---|---|---|---|---|---|---|
| Atom pair | 3 J expt | 3 J calc | 3 J expt | 3 J calc | 3 J expt | 3 J calc | 3 J expt | 3 J calc | 3 J expt | 3 J calc | Atom pair | 3 J expt | 3 J calc | Atom pair | 3 J expt | 3 J calc | Atom pair | 2 J expt |
| a 3 J CH from ref. 25. b 3 J CH from ref. 92. c Calculated with a constant-in-plane (CIP) effect.39 d Measured in 3-c1′. e Measured in 3-c1′′. f 13CFWHM ≈1.1 Hz for trisaccharide 3 at 175 MHz. g n J CC are given as the average between in-phase and anti-phase measurements, deviating with 0.1 Hz from the average. h 3 J calc is calculated from eqn (1) and values in parenthesis are computed from eqn (7) using averaging over four evenly distributed trajectory segments each of 10 ns. i Pearson's correlation coefficient (R) and RMSD between experimental and simulated results. The values in parenthesis are computed using the 3JCH constants from eqn (7) for the dihedral ϕ. | ||||||||||||||||||
| H1′–Cn | 3.4 | 4.3(3.8) | 3.8 | 3.5(4.0) | 4.1 | 3.5(4.0) | 4.2 | 4.4(3.9) | 3.8 | 3.0(3.6) | C2′–C2 | 2.8 | 3.4 | C2′′–C3 | 2.9 | 3.4 | C1′–C2 | −1.8 |
| C1′–Hn | 4.7 | 4.9 | 4.7 | 5.7 | 5.1{5.2}d | 4.7 | 4.5 | 5.1 | 4.8 | 5.4 | C1′–C1 | <1.0 | 1.0c | C1′′–C2 | <1.0 | 0.6 | C1′′–C3 | −2.0 |
| H1′′–Cn | 3.0 | 3.3(2.7) | 3.1 | 4.1(3.5) | 3.7 | 3.1(3.7) | 3.6 | 3.2(3.8) | 4.3 | 3.2(3.6) | C1′–C3 | 2.0 | 2.5 | C1′′–C4 | 2.1 | 2.6 | ||
| C1′′–Hn | 3.8 | 3.8 | 4.7 | 5.1 | 4.3{4.2}e | 4.3 | 5.4 | 5.9 | 5.3 | 6.0 | ||||||||
| R | 0.85(0.95) | 0.78(0.96) | 0.93(0.98) | 0.97(0.94) | 0.95(0.94) | |||||||||||||
| RMSDi | 0.5(0.3) | 0.8(0.6) | 0.5(0.2) | 0.5(0.4) | 0.8(0.6) | |||||||||||||
Herein we have used this methodology by synthesizing site-specifically 13C-labeled isotopologues and isotopomers of compound 3. The 1H NMR spectral region 4–5 ppm is indicative of differences between the three different 13C-labeling patterns (Fig. 5). In the doubly labeled compound 3-c2′/c2′′ it is evident that for the terminal β-D-glucopyranosyl residues 2JC2,H1 ≈ 0 Hz since the resonances from H1′ and H1′′ are doublets (3JH1,H2 ≈ 7.7 Hz) devoid of any two-bond heteronuclear couplings, consistent with the fact that the 2JC2,H1 coupling constant in β-D-glucose is small.75 In contrast, the resonances of the anomeric protons in 3-c1′ and 3-c1′′ are split by 1JC1,H1 = 161 Hz as a consequence of the site-specific 13C-labeling (Fig. 5). Furthermore, the presence of 3JCH across the glycosidic linkages are readily observed since the multiplicity of the H2 and H3 resonances is a ddd (Fig. 5) and the magnitudes of these J couplings (Table 3) were obtained using the J doubling procedure.50 The homonuclear 3JCC couplings related to the ϕ torsion angles were obtained from 1D 13C or 1D INADEQUATE NMR spectra48,49 (Fig. 6) of 3-c2′/c2′′ showing the splitting of the resonances from the C2 and C3 atoms of the mannosyl residue. In a similar way the 3JCC related to the ψ2 and ψ3 torsion angles were determined from the NMR spectra of the isotopomers 3-c1′ and 3-c1′′, respectively (Fig. 6). The 2JCC coupling constant, which is negative, at the glycosidic linkage carries information about rotamers76 and torsion angle preferences.77 From the NMR spectra of the isotopomers 3-c1′ and 3-c1′′ the 3JC1′,C2 and 3JC1′′,C3 were readily obtained, respectively (Fig. 6 and Table 3). It may be noted that since the linewidths of the 13C resonances (full width at half maximum) correspond to νFWHM ≈ 1.1 Hz the determined values in the 1D INADEQUATE spectra are not limited by cancellation effects78 when nJCC > 2 Hz; the absence of some signals in the spectra are also consistent with 3JCC < 1 Hz (Table 3).
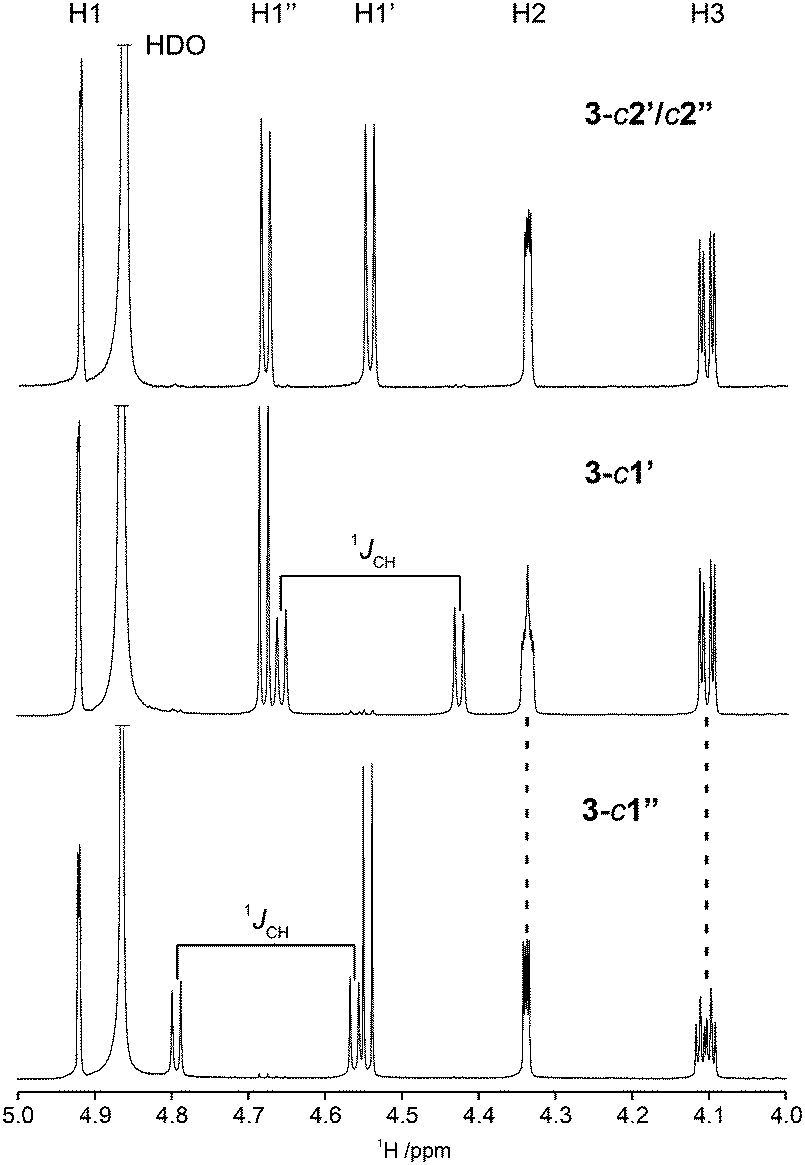 | ||
| Fig. 5 Selected region of 1H NMR spectra of compound 3-c2′/c2′ (top), compound 3-c1′ (middle) and compound 3-c1′′ (bottom) recorded at 16.4 T and a temperature of 290 K. The site-specific 13C-labeling of C1′ and C1′′ splits H1′ and H1′′, respectively, by 161 Hz; the influence of 3JC1′,H2 and 3JC1′′,H3 are clearly visible for compounds 3-c1′ and 3-c1′′, respectively. | ||
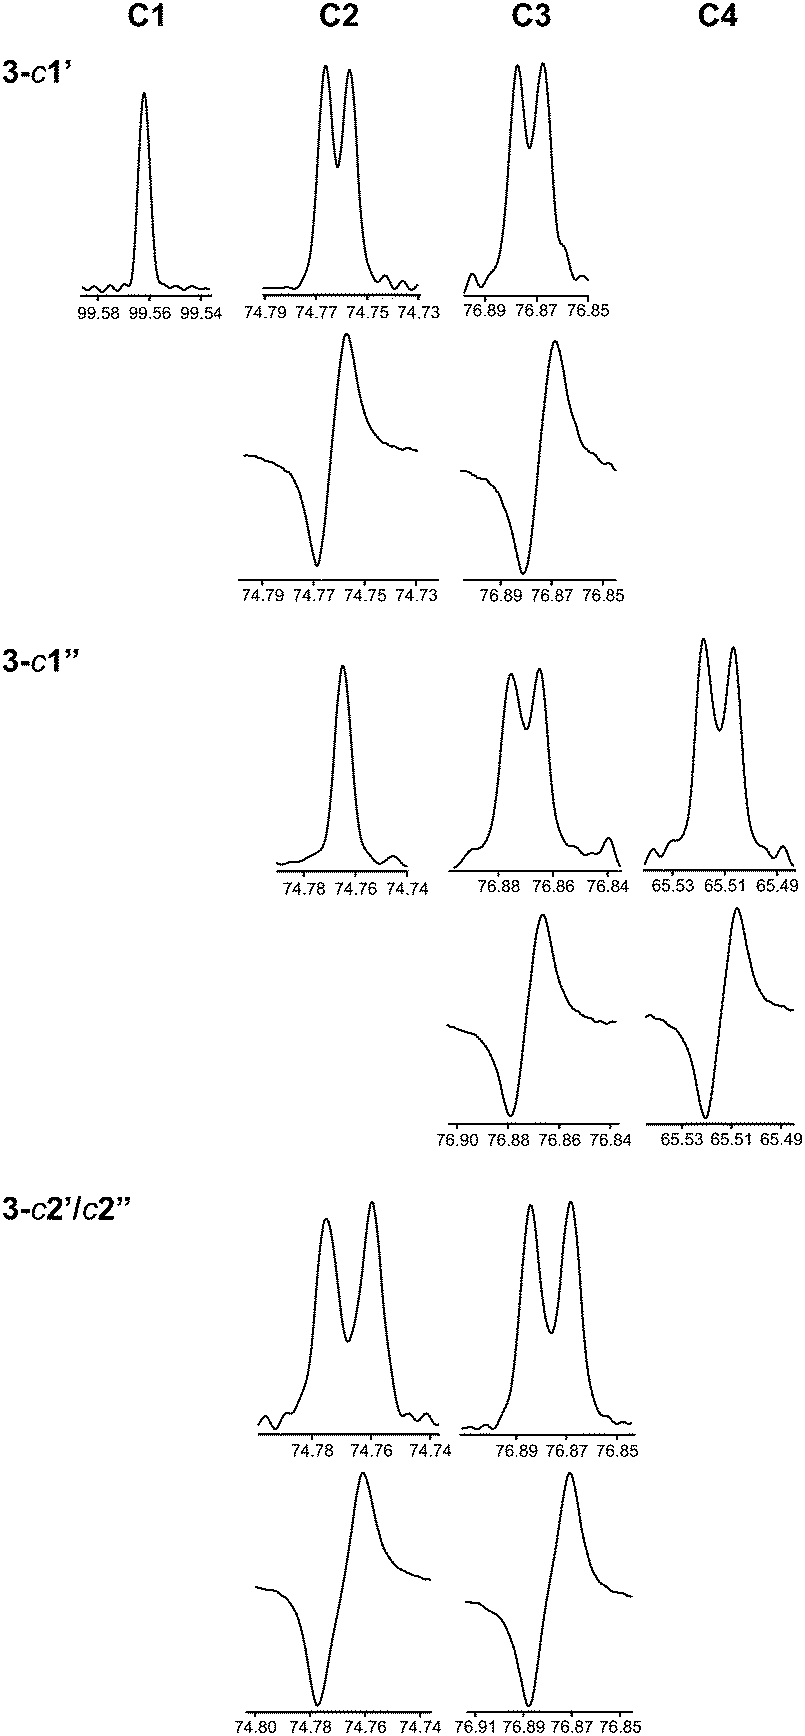 | ||
| Fig. 6 13C NMR resonances from C1–C4 of the mannose residue in trisaccharides 3-c1′, 3-c1′′ and 3-c2′/c2′ extracted from 1D spectra (in-phase peaks) and from 1D 1INADEQUATE spectra (anti-phase peaks). Chemical shifts are reported in ppm. | ||
Experimentally measured and simulation computed J coupling constants and effective 1H,1H distances
The experimental J coupling constants and effective 1H,1H distances were measured along the rotatable glycosidic linkages of the five trisaccharides. The experimental results may be used to determine the conformations being sampled by the trisaccharides, in part via the use of the Karplus equation to interpret the J coupling constants. In addition, a detailed atomic picture of the conformational ensembles being sampled by the trisaccharides may then be extracted from the MD simulations, and the ensembles of simulated conformations can be used to calculate the J couplings with the reparametrized Karplus relation JCX/SU09 (eqn (1)–(4)),39 thereby allowing for verification of the computational approach. The JCX/SU09 equation makes several important corrections to better reproduce the experimental measurements for carbohydrate molecules and has been successfully used on different disaccharides.9,14,39The experimental and computed values of 3JCH couplings are shown in Table 3 and plotted in Fig. 7. Qualitative agreement was observed for all five trisaccharides with the largest deviation being 1.1 Hz for the ϕ4 dihedral in trisaccharide 5 (4.3 vs. 3.2 Hz) and the smallest deviation being zero for ψ2 in trisaccharide 1 (3.8 vs. 3.8 Hz). The computed J couplings have a root mean square deviation (RMSD) of 0.65 Hz with respect to the corresponding experimental values along the torsional angle ϕ and 0.54 Hz along the ψ torsion. A detailed examination shows that all the computed J couplings along the linkage dihedral ϕ were overestimated if the α-anomer was the non-reducing end monosaccharide (ϕ2/ϕ3 of trisaccharide 1, ϕ2 of trisaccharide 2, ϕ3 of trisaccharide 4), while the calculated values with β-anomeric configurations included are underestimated (ϕ3 of trisaccharide 2, ϕ2/ϕ3 of trisaccharide 3, ϕ4 of trisaccharide 4, and ϕ3/ϕ4 of trisaccharide 5). As shown in Fig. 8, a left-shift of the ϕ distribution can simultaneously reduce the deviation for both α- and β-linked sugars. This correction can be added through an additional term of the phase shift Θ in the following equation derived from eqn (1),
| 3JCH(ϕ) = 6.54 cos2(ϕ − Δ − Θ) − 0.62 cos(ϕ − Δ − Θ) − 0.17 | (7) |
 | ||
| Fig. 7 Comparison of the computed and experimental NMR J coupling constants (in Hz). Black filled circles and triangles represent the computed J coupling constants from eqn (1) and (2) and red diamonds are calculated with eqn (7). | ||
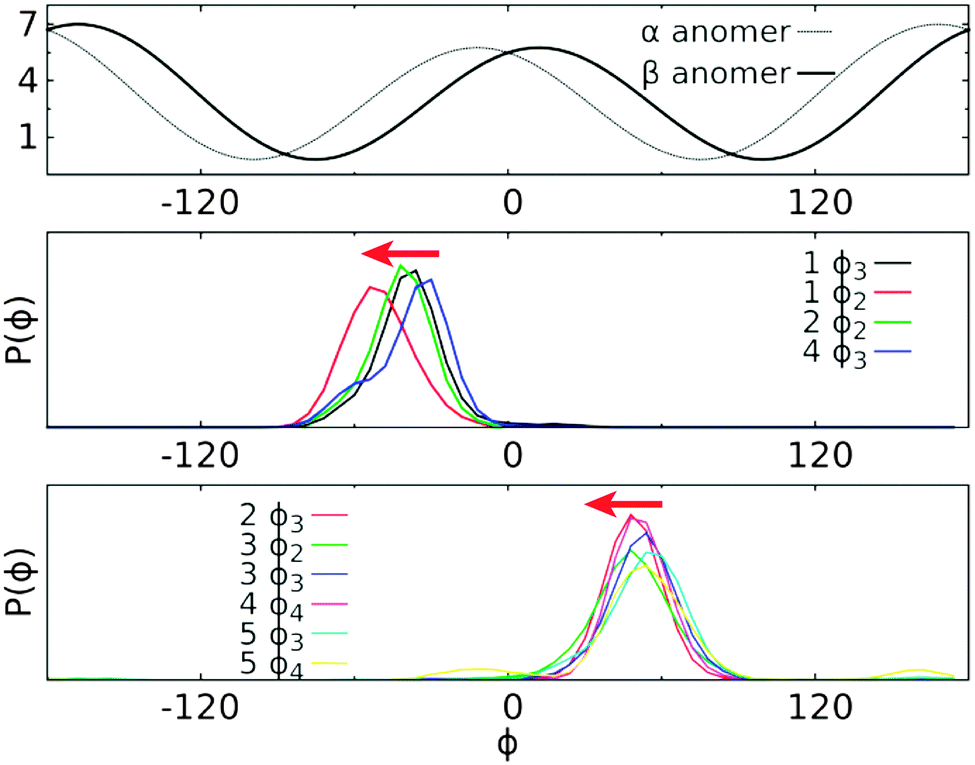 | ||
| Fig. 8 Plot of Karplus equation for 3JCH (in Hz) along the torsional angle ϕ (in degree) based on eqn (1) (top) and the probability distribution of ϕ in each trisaccharide for the sugar residues having the α- or β-anomeric configuration at the non-reducing end (middle and bottom panels, respectively). Red arrows indicate that an additional left-shift of the distribution can reduce the systematic deviation between computed and experimental values. The probability distribution of ϕ was computed using the frames recorded in the ground state replica of HREST-BP simulations with a bin size of 6°. | ||
Accurate estimation of the coupling constants requires sufficient conformational sampling of the trisaccharide, faithful description of the energy landscape of the system by the force field, and accurate estimates of the coupling constants by the Karplus equation. According to previous studies and the convergence check in this work the duration of the HREST-BP simulation is adequate to obtain sufficient conformational samplings and,35,36 thus, this point will not contribute significantly to the discrepancy between experiment and simulation. This leaves the remaining two issues; however, they are coupled and are hard to separate completely. To shed some light on the possible causes of the discrepancy, QM calculations of 3JCH coupling constants were performed at DFT/B3LYP/6-31G* level for 100 conformations of trisaccharide 3 and for the associated disaccharides in the same conformations. The resulting 3JCH couplings are very close to each other for the trisaccharide and corresponding disaccharides along both ϕ torsional angles in the linkages, with a RMSD of 0.22 Hz and 0.20 Hz for ϕ = H1′–C1′–O2–C2 and ϕ = H1′′–C1′′–O3–C3 (Fig. 9a and b), respectively. This suggests that the DFT result is not sensitive to the system size variation in 3JCH coupling constant calculations. The coupling constants derived from Karplus eqn (1) and (7) are compared with those from the DFT calculation (Fig. 9c and d). The Pearson’s correlation coefficients were computed for the 3JCH values from the Karplus equation and from DFT analysis, yielding values of 0.86 and 0.86 for eqn (1) and (7) along ϕ = H1′–C1′–O2–C2, respectively, and 0.83 and 0.82 for eqn (1) and (7) along ϕ = H1′′–C1′′–O3–C3, respectively. However, the RMSD with respect to the DFT result is about 0.3 Hz larger for the coupling constants computed with eqn (7) than those from eqn (1) along both ϕ dihedrals. Noting that the phase shift of the Karplus curve for the ϕ torsion angle is inherently dictated by an electronegative substituent along the coupling pathway,79,80 and the above mentioned inability to separate contributions from force field sampling and Karplus equation to the differences, the development of more accurate force fields, e.g. the Drude polarizable force field for carbohydrates,81,82 appears to be required to provide an improved understanding of the origin of these differences.
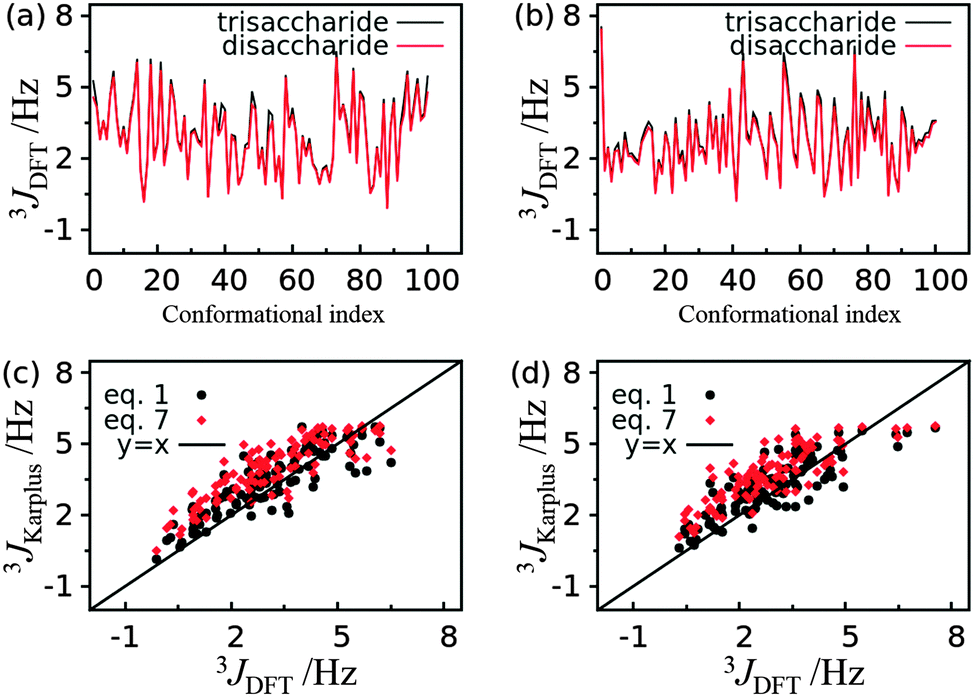 | ||
| Fig. 9 3 J CH coupling constants computed from Karplus eqn (1) and (7) and DFT/B3LYP/6-31G* calculations for trisaccharide 3. (a) Comparison of 3JCH coupling constants from each conformation of the trisaccharide and the corresponding disaccharide along glycosidic dihedral ϕ = H1′–C1′–O2–C2. (b) Comparison of 3JCH coupling constants from each conformation of the trisaccharide and the corresponding disaccharide along glycosidic dihedral ϕ = H1′′–C1′′–O3–C3. (c) Comparison of 3JCH coupling constants computed from Karplus equations and DFT for each trisaccharide conformation along glycosidic dihedral ϕ = H1′–C1′–O2–C2. (d) Comparison of 3JCH coupling constants computed from Karplus equations and DFT for each trisaccharide conformation along glycosidic dihedral ϕ = H1′′–C1′′–O3–C3. | ||
For J couplings along the torsional angle ψ, the signed difference is −0.37 Hz, suggesting this J coupling is overestimated from simulation except for ψ2 in trisaccharide 3 (5.1 vs. 4.7 Hz) (Fig. 7 and Table 3). In addition to the torsional angle ψ, this J coupling value also depends on the dihedral ϕO5 to account for the variable in-plane (VIP) effect as expressed in eqn (2). However, for the trisaccharides we studied here, the contribution from the VIP term is negligible since the dihedral distribution of ϕO5 concentrates around 74° and −72° for glycosidic linkages with the α- and β-anomeric configurations at the non-reducing end monosaccharide, respectively. The RMSD between experimental and computed J couplings is 0.54 Hz. The smallest deviation of zero was observed for ψ2 in trisaccharide 1 (3.8 vs. 3.8 Hz) and ψ3 in trisaccharide 3 (4.3 vs. 4.3 Hz) and the largest deviation of 1.0 Hz for ψ3 in trisaccharide 2 (4.7 vs. 5.7 Hz).
In trisaccharide 3, some additional 3JCC coupling constants were measured related to ϕC2, ψC1,Cn+1, and ψC1,Cn−1 (Table 3). The 3JCC ≈ 3.0 Hz related to the ϕ torsion angles in 3 are consistent with anti-periplanar orientations at the torsion angles C2′–C1′–O2–C2 and C2′′–C1′′–O3–C3 and the prevalence of the exo-anomeric conformation. This conclusion is further supported by the 2JCC ≈ −2 Hz at the glycosidic linkages.76 In addition, the latter 2JCC values support ψ torsional angles close to zero degrees, i.e., a syn-conformation as the major one at the glycosidic linkages.77 The simulation overestimated the experimental J coupling by ∼0.5 Hz for the torsional angles ϕC2 and ψC1,Cn+1. However, the data set is too small to apply a suitable correction to eqn (3) and (4) for the J coupling calculation. For the J couplings related to ψC1,Cn−1 the simulations predicted 3JCC ≤ 1 Hz, in very good agreement with experimental estimates.
The overall agreement for 1H,1H-effective distances is indeed good between the experimental and simulated results (Table 2). The largest deviations 0.11–0.14 Å, 0.17 Å, 0.27 Å, 0.29 Å and 0.30 Å were observed for H1′–H1′′ in trisaccharide 1, H1′′–H5′′ in trisaccharide 2, H1′′–H3 in trisaccharide 3, H1′–H2′′ in trisaccharide 4, and H1′′–H5 in trisaccharide 5, respectively.
Conformational preferences of the monosaccharide rings and exocyclic hydroxymethyl group
The conformational preferences of a trisaccharide can be represented through the states of the exocyclic hydroxymethyl groups, the ring puckers, and the relative orientations of the monosaccharides along the glycosidic linkages. From the simulations, the conformational propensity of the ring puckers and exocyclic hydroxymethyl rotations were examined in each monosaccharide. The pucker analysis, represented with Cremer–Pople parameters (R, θ, φ), shows a stable 4C1 chair state near θ = 0° for all the monosaccharides, including α/β-D-glucopyranose and α-D-mannopyranose within the 40 ns HREST-BP simulation (see Fig. S2 in the ESI†).83 This observation is in agreement with previous experimental and computational studies which suggest a preferred 4C1 chair conformation for the gluco- and manno-configured hexopyranoses around θ = 0°.14,84 The exocyclic hydroxymethyl group samples three different conformations as defined by the O5–C5–C6–O6 torsion angle, with comparable populations at the gt (0°–120°) and gg (−120° to 0°) states and a relatively small population at the tg (−180° to −120°) & (120°–180°) state (see Fig. S3 in ESI†). This result suggests a preferred conformational conversion between the gt and gg states over the tg state, which is in agreement with previous observations from both experiments and simulations.14,85 Taken together, similar conformational sampling was observed in the ring puckers and the exocyclic hydroxymethyl groups for all the included monosaccharides. Accordingly, in the following discussion, we will mainly focus on the conformational preferences along the glycosidic linkages, which control the flexibility and structural packing patterns in the oligo- or polysaccharide molecules, as well as the overall conformations of the trisaccharides as defined by the Cartesian coordinates.Free energy landscape along the glycosidic linkages
The conformational preference between the connected monosaccharides is represented with two torsion angles, ϕ(H1–C1–On–Cn) and ψ(C1–On–Cn–Hn), defined for the (1 → 2)-, (1 → 3)- and (1 → 4)-glycosidic linkages. In the simulations, the ϕ dihedral adopts a global minimum on the free energy landscapes from −54° to −30° for an α-anomeric form and 48° to 54° for a β-anomeric form as the non-reducing end monosaccharide, respectively (Fig. 10 and Table 4). Here the non-reducing end monosaccharide refers to the sugar unit that includes atoms H1 and C1 in the definition of ϕ(H1–C1–On–Cn). For ϕ dihedrals with a sugar residue having an α-anomeric configuration at the non-reducing end monosaccharide, there is only one stable state sampled in the region (−60°, 0°). This is seen with the (1 → 2)- and (1 → 3)-linkages in trisaccharide 1, the (1 → 2)-linkage in trisaccharide 2, and the (1 → 3)-linkage in trisaccharide 4. On the other hand, for the sugar residues having the β-anomeric configuration there are additional sub-states observed around ϕ = ±180° or ϕ = −15° in some glycosidic linkages besides the most stable conformation within ϕ ∈ (0°, 60°) (Fig. 10). This is present in the (1 → 2)- and (1 → 3)-linkages in trisaccharide 3, the (1 → 4)-linkage in trisaccharide 4, and the (1 → 3)- and (1 → 4)-linkages in trisaccharide 5. The observation of the sampled distribution along ϕ is in agreement with the prediction from the exo-anomeric effect and crystallographic structures.84 The conformation along the ψ dihedral has multiple sub-states as shown in the free energy maps, suggesting additional flexibility along this linkage dihedral. For all five trisaccharides, the global minima along ψ is positioned around the syn-periplanar conformation at ψ = 0° (Fig. 10). Specifically, if the β-anomeric configuration is present at the non-reducing end unit, the global minima along ψ are positioned at the regions of 0° ≤ ψ ≤ 36° and, if the α-anomeric form is present instead, the range −36° ≤ ψ ≤ 0° occurs. The exception occurs for the (1 → 3)-linkage in trisaccharide 4 where the global minimum is at ψ = 24° (Table 4), but in this case the global energy minimum region is elongated covering both positive and negative values at the ψ torsion angle. This result for ψ was also observed in many crystal structures for gluco- and manno-configured hexopyranoses as the non-reducing end unit.86,87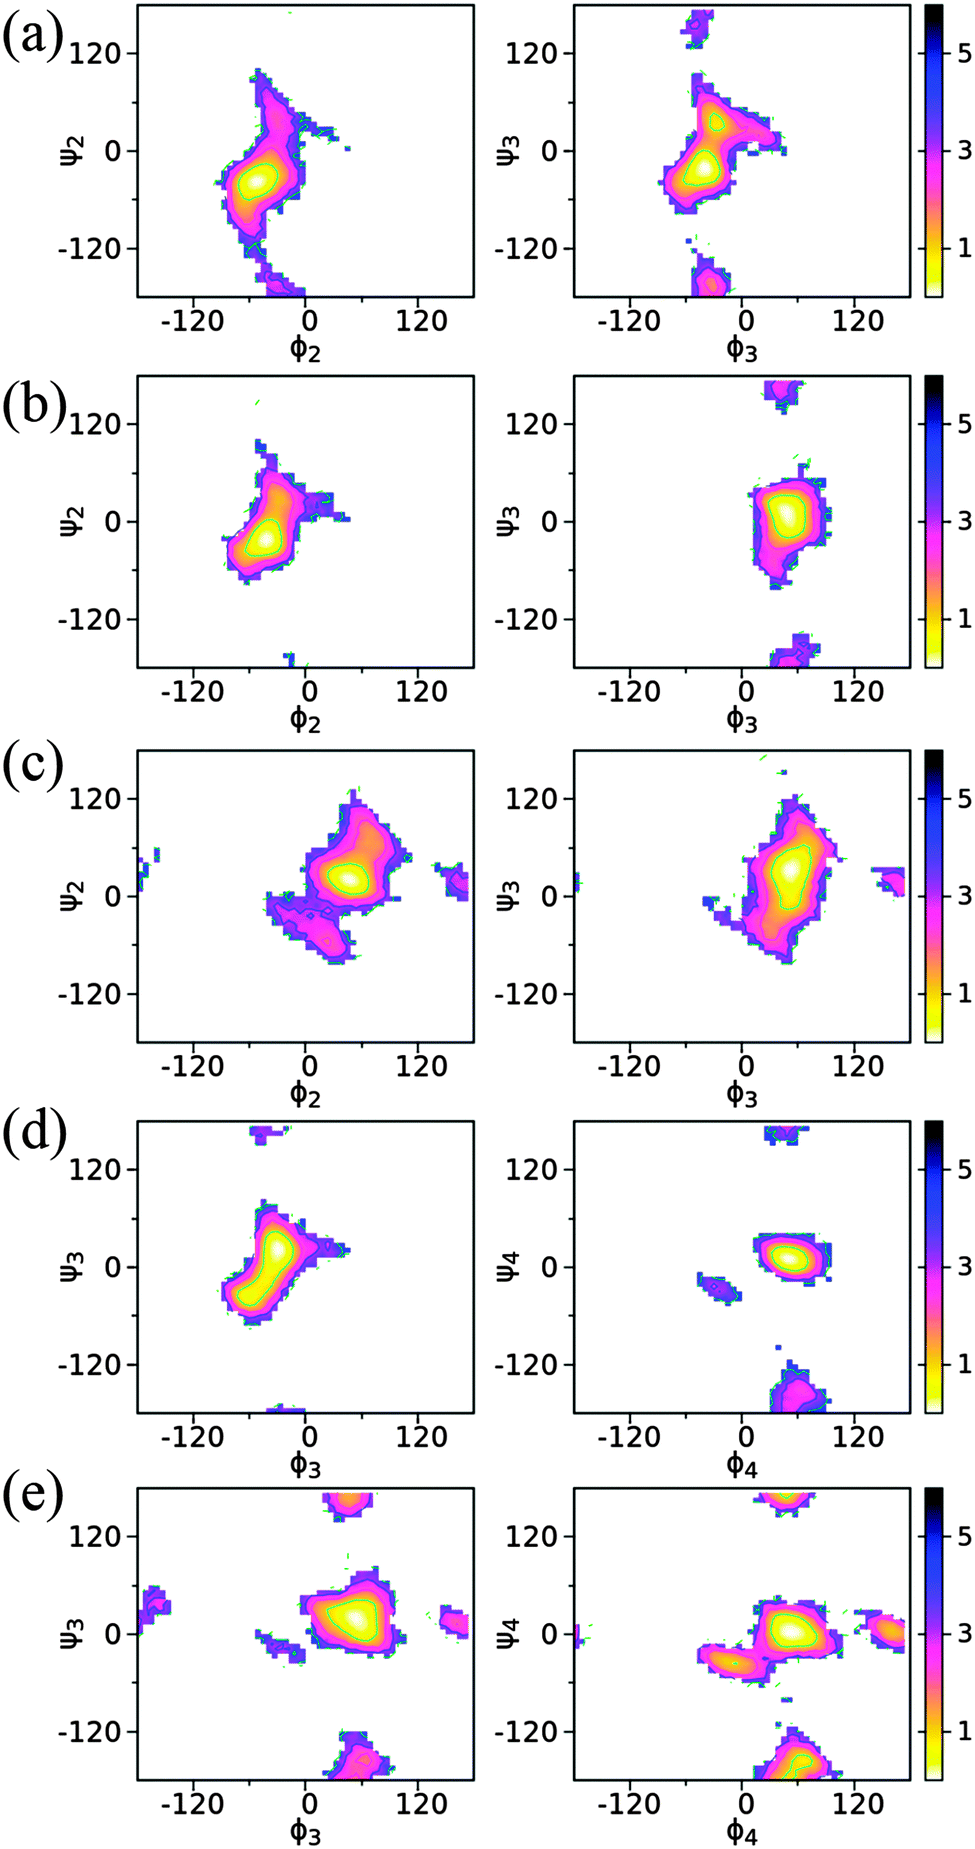 | ||
| Fig. 10 2D Potential of mean force (PMF) profiles along the glycosidic linkage dihedrals in trisaccharides 1 (a), 2 (b), 3 (c), 4 (d) and 5 (e). The definition of the torsion angles (in degree) is shown in the structural models in Fig. 1. | ||
| Trisaccharide | ϕ/ψ (linkage 1)a | ϕ/ψ (linkage 2)a |
|---|---|---|
| a Linkage 1 is defined for the linkage including the monosaccharide with one prime at the non-reducing end and linkage 2 includes the monosaccharide with double primes at the non-reducing end. See Fig. 1 for the structural models. | ||
| 1 | −36/−24 | −54/−36 |
| 2 | 48/12 | −42/−24 |
| 3 | 48/24 | 54/36 |
| 4 | −30/24 | 48/12 |
| 5 | 54/24 | 54/0 |
Dihedral-based clustering analysis of the trisaccharide conformations
The structural flexibility of saccharides allows for a range of conformations to be sampled in solution, suggesting that the oligo- or polysaccharides may not typically be characterized in terms of a single 3D structure. This requires that these molecules be represented by an ensemble of conformations and to define this ensemble two approaches were undertaken. The first involved defining conformations based on the internal coordinates defined by the dihedrals at the glycosidic linkages and the second involved the range of conformations in terms of Cartesian coordinates (see below). Defining the conformations based on glycosidic linkages used cluster analysis for each trisaccharide, with the analysis performed on the different local minima sampled on the free energy surface of each linkage. As shown in Fig. 11, individual conformational states for each linkage are defined based on different ranges of the ϕ/ψ dihedrals associated with individual, local minima as determined from the above free energy landscapes. An index number is assigned to each region to be subsequently used as the basis for cluster analysis. Although this partitioning of ϕ/ψ space has the possibility of including more than one local minima in a given region or splitting one local minimum into two regions in some cases, the definitions used here are generally applicable to carbohydrate molecules and approximately corresponds to different free energy minima for the glycosidic linkages.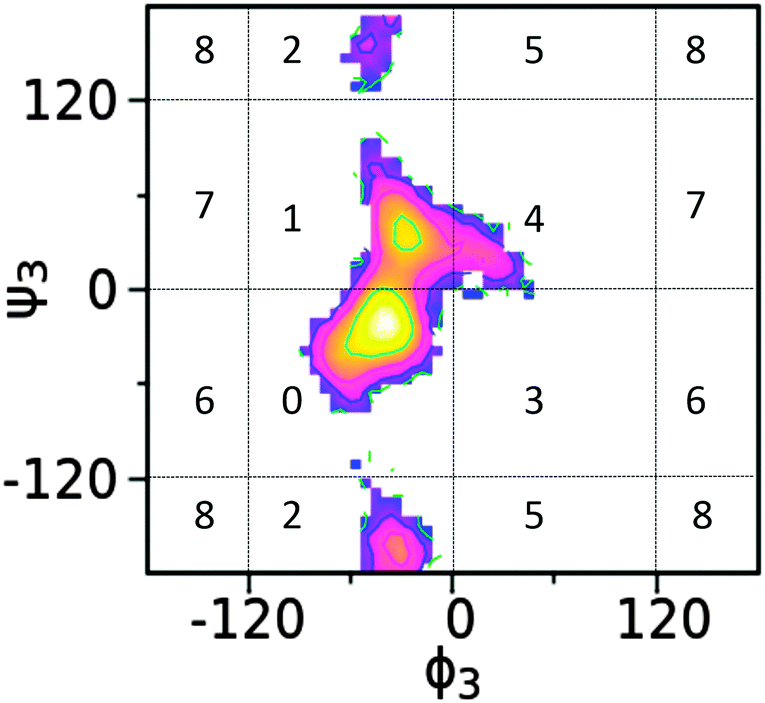 | ||
| Fig. 11 Index of free energy minima for each glycosidic linkage used in the dihedral-based clustering. The α-(1 → 3)-linkage in trisaccharide 1 is used as an example. Torsion angles are given in degree. | ||
To apply this approach for each recorded snapshot from the simulation, the conformation of each glycosidic linkage is identified and assigned the corresponding index number. With trisaccharides this involves two index numbers associated with the two glycosidic linkages defining the overall conformation of each trisaccharide. For example, 1/0 represent the conformation with the first linkage at ϕ ∈ (−120°, 0°)/ψ ∈ (0°, 120°) and the second linkage at ϕ ∈ (−120°, 0°)/ψ ∈ (−120°, 0°). In this approach all conformations in a specific cluster are in the same local minima on the free energy landscape as defined by the glycosidic linkages. We refer to these as glycosidic linkage, or GL, clusters. As shown below, conformations in the same GL cluster can vary in terms of Cartesian coordinates; however, as they occupy the same minima these different “Cartesian conformations” can readily interconvert without encountering any high free energy barriers. This is because all conformations in a given GL cluster are in the same local minima along every glycosidic linkage such that the interconversion between conformations can occur without encountering significant energy barriers. GL clusters, therefore, provide a high dimensional representation of the carbohydrate conformation as compared to the 1D- or 2D-PMF profiles. Furthermore, the hydrogen bonding interactions, J coupling constants, and proton–proton effective distances can be analyzed for the conformations present in each given GL cluster to provide more structural insights into the conformational heterogeneity of saccharide molecules.
In trisaccharides 1, 2 and 3, both (1 → 2)- and (1 → 3)-glycosidic linkages are included but with different monosaccharides or anomeric configurations. According to the GL clustering, the first two clusters in trisaccharide 1 accounts for 89% of the total population (Table 5). The largest cluster corresponds to the global minimum of the two linkages in the free energy landscape, that is, ϕ3 ∈ (−120°, 0°)/ψ3 ∈ (−120°, 0°) & ϕ2 ∈ (−120°, 0°)/ψ2 ∈ (−120°, 0°). The second cluster is located at one local minima about the first linkage, ϕ3 ∈ (−120°, 0°)/ψ3 ∈ (0°, 120°), and the global minimum of the second linkage ϕ2 ∈ (−120°, 0°)/ψ2 ∈ (−120°, 0°).
| Cluster indexb | Population/% | 3 J calc (H1′–Cn) | 3 J calc (C1′–Hn) | 3 J calc (H1′′–Cn) | 3 J calc (C1′′–Hn) | RMSDc | R | r H1′–H3 | r H1′–H1′′ | r H1′′–H2′ | r H1′′–H3 | r H1′–H2′ | RMSDc | R |
|---|---|---|---|---|---|---|---|---|---|---|---|---|---|---|
| a The first 5 clusters listed in this table are out of a total of 22 clusters sampled for trisaccharide 1; the 3Jcalc coupling constant and effective 1H,1H distance rHH were computed for each cluster. The values in parenthesis were computed with eqn (7) and the other J coupling constants were computed with eqn (1–2). b The cluster index was defined in Fig. 11 and the conformation of the two linkages was represented by two corresponding numbers. c The Pearson’s correlation coefficient R and RMSD values were computed for each GL cluster against the experimental measurements. For J coupling constants, the RMSD and R values in parenthesis correspond to 3Jcalc computed from eqn (7). For the 1H,1H distances, the R and RMSD were computed against the experiments at 900 MHz (see Table 2). | ||||||||||||||
| 00 | 67.7 | 4.0(3.5) | 5.0 | 3.2(2.6) | 3.8 | 0.4(0.3) | 0.94(0.99) | 2.38 | 2.23 | 2.61 | 4.28 | 2.43 | 0.31 | 0.99 |
| 10 | 21.3 | 5.1(4.7) | 4.4 | 3.2(2.7) | 3.6 | 0.9(0.7) | 0.32(0.55) | 2.18 | 2.26 | 2.55 | 3.16 | 2.45 | 0.21 | 0.97 |
| 20 | 3.2 | 4.6(4.1) | 6.6 | 3.4(2.8) | 4.4 | 1.2(1.1) | 0.96(0.99) | 3.62 | 2.29 | 2.45 | 4.85 | 2.44 | 0.81 | 0.81 |
| 01 | 2.4 | 4.2(3.7) | 4.8 | 4.8(4.3) | 3.9 | 1.0(0.7) | 0.13(0.62) | 2.38 | 3.50 | 2.24 | 5.85 | 2.49 | 1.13 | 0.91 |
| 40 | 2.1 | 4.3(4.7) | 5.3 | 3.4(2.8) | 4.2 | 0.6(0.8) | 0.95(0.83) | 2.17 | 2.27 | 2.55 | 2.62 | 2.46 | 0.45 | 0.72 |
| Sum | 96.7 | |||||||||||||
To better understand the structural factors that govern the conformational preference, possible inter-monosaccharide hydrogen bonding interactions were monitored in the simulations. The result shows one stable interacting pair in GL cluster 1 (HO4–O2′′), while in GL cluster 2 two interacting pairs are significantly sampled involving the HO2–O5′ and OH2–O6’ pairs. Beyond the largest two clusters, the remaining clusters comprise around 10% of the sampled conformations, of which no stable hydrogen bonding interactions were found (Fig. 12 and 13), indicating the contribution of inter-monosaccharide hydrogen bonding interactions in stabilizing the most populated conformers. We also examined the water-mediated hydrogen bonding interactions in the simulation. Table 6 shows a very small occupancy ratio (∼0.07) of this interaction over the whole trajectory, which is dominated by the contribution from GL cluster 1.
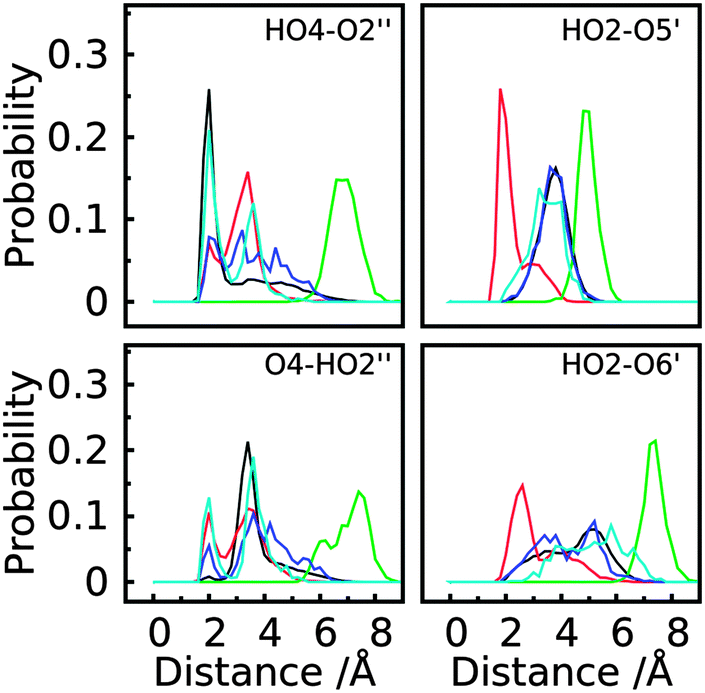 | ||
| Fig. 12 Probability distribution of hydrogen bonding interaction pairs (labeled in the figure for proton to acceptor distance) between different monosaccharides in the first five clusters of trisaccharide 1. GL clusters are colored black for cluster 1, red for cluster 2, green for cluster 3, blue for cluster 4 and cyan for cluster 5. | ||
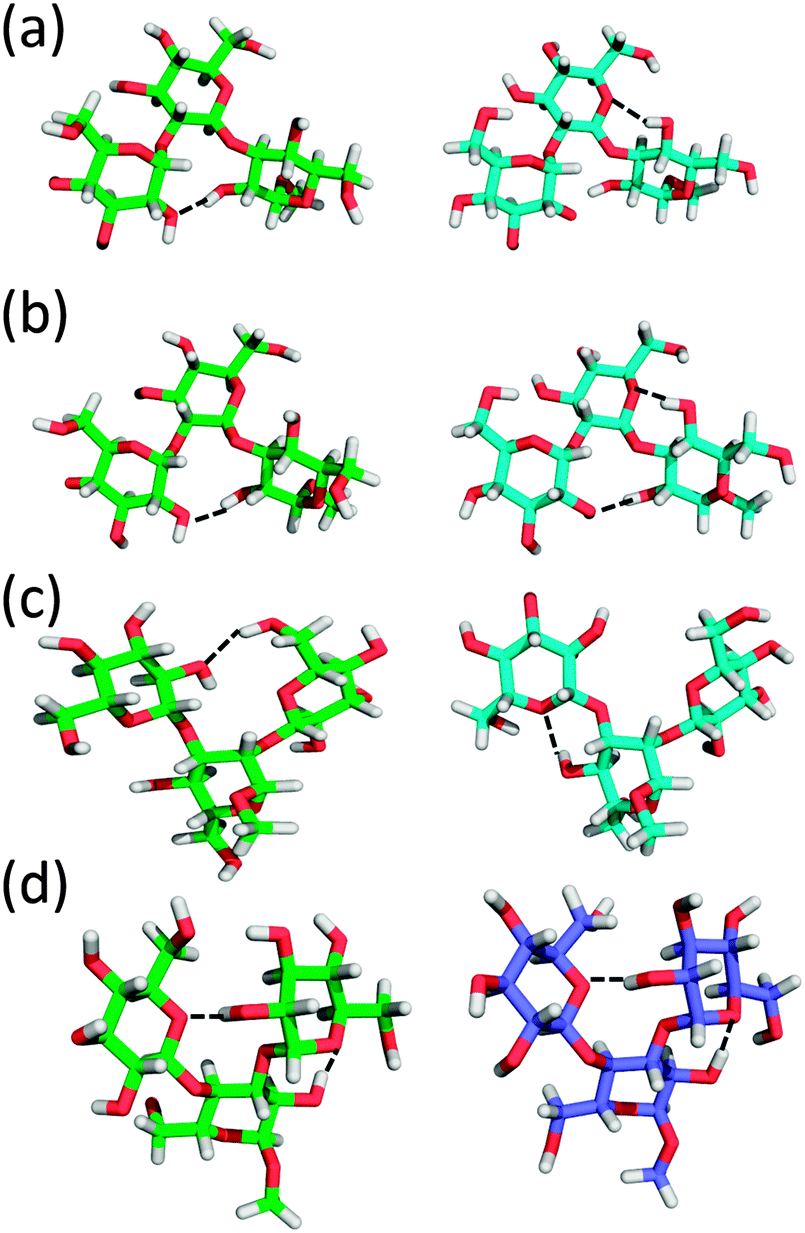 | ||
| Fig. 13 Structural models of the hydrogen bond interactions (dashed line) in different GL clusters of trisaccharides 1–4. (a) GL cluster 1 (left) and 2 (right) of trisaccharide 1. (b) GL cluster 1 (left) and 2 (right) of trisaccharide 2. (c) GL cluster 1 (left) and 2 (right) of trisaccharide 3. (d) GL cluster 1 (left) and 3 (right) of trisaccharide 4. | ||
| GL cluster | Trisaccharide 1 | Trisaccharide 2 | Trisaccharide 3 | Trisaccharide 4 | Trisaccharide 5 |
|---|---|---|---|---|---|
| O2′–O2′′ | O4–HO6′ | O4–HO6′′ | O4–O2′′ | O4–HO6′ | |
a Occupancy (occ) was computed as 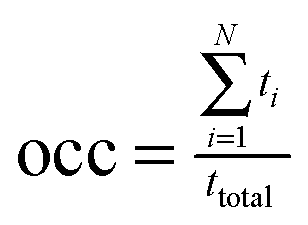 , with N, ti and ttotal the number of water mediated hydrogen bonding events for a given pair of atoms, the lifetime of the ith event, and the total simulation time for a given conformation pool, respectively. The water-mediated hydrogen bonding event was defined active when the distance is less than 2.4 Å between water atom and the respective donor or acceptor of both atoms in the given pair. The occupancy was computed relative to the conformations in a given GL cluster only and all frames in the entire trajectory (values in parenthesis). The inter-saccharide atom pair with the largest occupancy value was listed in this table for each trisaccharide system. , with N, ti and ttotal the number of water mediated hydrogen bonding events for a given pair of atoms, the lifetime of the ith event, and the total simulation time for a given conformation pool, respectively. The water-mediated hydrogen bonding event was defined active when the distance is less than 2.4 Å between water atom and the respective donor or acceptor of both atoms in the given pair. The occupancy was computed relative to the conformations in a given GL cluster only and all frames in the entire trajectory (values in parenthesis). The inter-saccharide atom pair with the largest occupancy value was listed in this table for each trisaccharide system.
|
|||||
| 1 | 0.09 (0.06) | 0.17 (0.10) | 0.12 (0.09) | 0.05 (0.03) | 0.23 (0.06) |
| 2 | 0.05 (0.01) | 0.08 (0.02) | 0.06 (0.01) | 0.07 (0.02) | 0.24 (0.06) |
| 3 | 0.03 (0.00) | 0.06 (0.01) | 0.18 (0.01) | 0.06 (0.00) | 0.00 (0.00) |
| 4 | 0.01 (0.00) | 0.15 (0.01) | 0.03 (0.00) | 0.11 (0.00) | 0.32 (0.02) |
| 5 | 0.00 (0.00) | 0.00 (0.00) | 0.16 (0.00) | 0.07 (0.00) | 0.17 (0.01) |
| Entire trajectory | (0.07) | (0.14) | (0.11) | (0.06) | (0.16) |
For the J coupling constants and effective 1H,1H distances, the agreement is very good between experimental and simulated results. The largest deviation was 0.4 Hz for J coupling constants along torsional angle ϕ3 (3.4 vs. 3.8 Hz) if the corrected eqn (7) was used (Table 3) and 0.11 for the effective distance between H1′ and H1′′ (2.37–2.40 vs. 2.26 Å) (Table 2). Interestingly, the simulated values of different effective proton–proton distances for the first five GL clusters show large variations with respect to the experimental results as shown by the RMSD value (Table 5), while the weighted average with the respective cluster populations results in very good agreement to the experimental measurements (Tables 2 and 3). This observation indicates that the simulation can faithfully reproduce the distribution of thermodynamically accessible conformations of this trisaccharide molecule, yielding the overall good agreement with the NMR data.
Trisaccharide 2 differs from trisaccharide 1 in the anomeric configuration of the central monosaccharide, with β-D-glucopyranose replacing the α-D-glucopyranose in trisaccharide 1 (Fig. 1). There are again two largely populated clusters observed for trisaccharide 2, which account for 82% of the total population (see Table S1 in ESI†). The largest cluster, occupying 60% of the overall conformations, corresponds to the global minima in the free energy surfaces of the two glycosidic linkages, ϕ3 ∈ (0°, 120°)/ψ3 ∈ (0°, 120°) & ϕ2 ∈ (−120°, 0°)/ψ2 ∈ (−120°, 0°). The second GL cluster positions within ϕ3 ∈ (0°, 120°)/ψ3 ∈ (−120°, 0°) & ϕ2 ∈ (−120°, 0°)/ψ2 ∈ (−120°, 0°). One stable hydrogen bond interaction was observed in GL clusters 1 and 2 between HO2 and O2′′ (Fig. 13 and Fig. S4 in ESI†). In GL cluster 2 there is a another stable hydrogen bond interaction HO4–O5′. GL clusters 3 and 4 account for populations of 9.1% and 7.0%, respectively. Interestingly, the stable HO4–O5′ interaction pair exists in the conformations of cluster 3, while no stable interaction was observed in cluster 4. For this molecule, the water-mediated hydrogen bonding interaction has an occupancy ratio of 0.14, with these interactions more frequently observed in GL clusters 1 and 4 (Table 6). The two largest J coupling constant deviations were observed along torsional angles ψ3 (4.7 vs. 5.7 Hz) and ϕ2 (3.1 vs. 3.5 Hz) and about the effective 1H,1H distances for the intra-saccharide H1′′–H5′′ (3.82 vs. 3.65 Hz) and the inter-saccharide H1′′–H2 (3.22 vs. 3.34 Hz), both of which are long distances (relative to the intraresidual reference distance) differing by ∼0.15 Å between experiment and simulation (Tables 2 and 3). The decomposition of simulated results also shows a large variation in different GL clusters, suggesting the influence of different conformational states to the measured J coupling constants and effective distances (see Table S1 in ESI†). Taken together, the simulation can well reproduce the experimental measurements for this trisaccharide and the contributions for various conformational states are further decomposed into different GL clusters.
Unlike a linear connection through the (1 → 2)- and (1 → 3)-glycosidic linkages in trisaccharides 1 and 2, trisaccharide 3 is a model of a branched molecule with only one reducing end monosaccharide mannose (Fig. 1). For 3, the first 2 clusters account for 91% of the total population. They correspond to the most stable states in the linkage dihedral space, ϕ2 ∈ (0°, 120°)/ψ2 ∈ (0°, 120°) & ϕ3 ∈ (0°, 120°)/ψ3 ∈ (0°, 120°) for the largest cluster and ϕ2 ∈ (0°, 120°)/ψ2 ∈ (0°, 120°) & ϕ3 ∈ (0°, 120°)/ψ3 ∈ (−120°, 0°) for the second cluster (see Table S2 in ESI†). One highly populated inter-monosaccharide hydrogen bond, HO6′–O2′′, between the two terminal adjacent glucosyl residues is formed in cluster 1, stabilizing this conformation. In addition, a HO4–O5′′ hydrogen bond was found in clusters 2 and 4 of this trisaccharide (Fig. 13 and Fig. S5 in ESI†). The longer range HO6′–O2′′ hydrogen bond appears to stabilize the conformation of GL cluster 1 to a greater extent than the HO4–O5′′ hydrogen bonds that occur across the glycosidic linkage in adjacent monosaccharides even though the latter occurs with a higher probability. Water-mediated hydrogen bonding interactions have an occupancy ratio of 0.11 with the largest contribution from GL cluster 1 (Table 6). The agreement for J coupling constants along ϕ and ψ is very good, with the largest deviation observed for torsion angle ψ2 (5.1 vs. 4.7 Hz) and the other three dihedrals less than 0.1 Hz (Table 3). This good agreement was also observed for the effective 1H,1H distances with the largest discrepancy of 0.19 Å between H1′ and H2 (2.23 vs. 2.42 Å) (Table 2). However, the simulation overestimated the 3Jcc by approximately 0.5 Hz for torsion angles ϕC2 and ψC1–Cn+1. Importantly, though, the values differ at the two glycosidic linkages indicating that torsional preferences and/or dynamics are not the same at these two linkages. Cluster analysis (see Table S2 in ESI†) shows that the corresponding J coupling constants in GL cluster 1 are all overestimated with respect to the experimental values along ϕC2 and ψC1,Cn+1, e.g. JC2′,C2, JC2′′,C3, JC1′–C3, and JC1′′,C4. Under the assumption that eqn (3) and (4) used to compute the J coupling constants are accurate, this result suggests that conformations in the first GL cluster were over-sampled in the simulation. However, in the current study, we cannot identify if this discrepancy arises from deviations from the ideal parameterizations in eqn (3) and (4) or the relative population of conformational sampling (see Table S2 in ESI†). Overall, the agreement between experimental and simulated observations is satisfactory for this trisaccharide.
Both trisaccharides 4 and 5 are representing branched oligosaccharide structures connected through (1 → 4)- and (1 → 3)-glycosidic linkages. The same (1 → 4)-linkage is present in the two molecules between the α-D-glucose and β-D-glucose at the reducing and non-reducing ends, respectively, (Fig. 1). This type of linkage is present in cellobiose. However, the (1 → 3)-linkages differ with respect to the anomeric configurations in the non-reducing end monosaccharides, with α-D-glucose in trisaccharide 4 and β-D-glucose in trisaccharide 5. The anomeric difference results in significantly different conformational heterogeneity of the two molecules. For trisaccharide 4, the two largest clusters comprise 85% of the total population (see Table S3 in ESI†) while those in trisaccharide 5 only accounts for 50% of the population (see Table S4 in ESI†). For the two trisaccharides, the largest cluster involves the free energy global minima for the glycosidic linkages: ϕ3 ∈ (−120°, 0°)/ψ3 ∈ (0°, 120°) & ϕ4 ∈ (0°, 120°)/ψ4 ∈ (0°, 120°) for trisaccharide 4 and ϕ3 ∈ (0°, 120°)/ψ3 ∈ (0°, 120°) & ϕ4 ∈ (0°, 120°)/ψ4 ∈ (0°, 120°) for trisaccharide 5. In trisaccharide 4, one stable hydrogen bond between HO2 and O5′ is formed in GL clusters 1, 3 and 4 with an additional interacting pair involving HO2′ and O5′′ between the terminal glucosyl residues in clusters 1 and 3 (Fig. 13 and Fig. S6 in ESI†). For this system, the water-mediated interactions are very weak and only have an occupancy ratio of 0.06. In trisaccharide 5 no stable hydrogen bond interactions were observed, which, together with the large number of clusters that sample relatively small amounts of conformation, indicates additional conformational flexibility due to the lack of stabilizing inter-monosaccharide hydrogen bonds. Alternatively, the water-mediated hydrogen bonding interactions most frequently observed in this molecule with an occupancy ratio of 0.16. Such hydrogen bonding interactions occur in GL clusters 1, 2, 4, and 5 (Table 6). The simulations overestimate the J coupling constants by 0.6 and 0.5 Hz for torsion angles ψ3 (4.5 vs. 5.1 Hz) and ψ4 (5.4 vs. 5.9 Hz) in trisaccharide 4 and 0.6 and 0.7 Hz along dihedrals ψ3 (4.8 vs. 5.4 Hz) and ψ4 (5.3 vs. 6.0 Hz) in trisaccharide 5 (Table 3). For the effective 1H,1H distances, the largest two discrepancies were observed for H1′–H2′′ (3.56 vs. 3.27 Å) and H1′–H1′′ (3.99 vs. 4.10 Å) in trisaccharide 4 and for H1′′–H5 (3.30 vs. 3.60 Å) and H1′–H3 (2.34 vs. 2.49 Å) as well as H1′′–H4 (2.62 vs. 2.45 Å) in trisaccharide 5 (Table 2). Table S3 in ESI† shows that the first 3 GL clusters all overestimate the J coupling constants along ψ3 and ψ4 in trisaccharide 4. The similar overestimation of 3JC,H was also observed from the simulation of 5 along torsional angles ψ3 and ψ4 (see Table S4 in ESI†). It is interesting to note that the third most populated cluster of trisaccharide 5, with index 45 and a population of 19%, contains a significantly populated anti-ψ conformation (Fig. 10). This indicates that the enhanced conformational heterogeneity as seen from the dispersed distribution of the GL clusters and the free energy landscape of the glycosidic linkages may indicate the presence of conformational epitopes in more complex oligosaccharide structures, such as lipopolysaccharides from Moraxella catarrhalis where an anti-ψ conformation is present at the corresponding β-(1 → 4)-linkage. Accordingly, trisaccharide 5 represents a structural element of a larger oligosaccharide.88–91
Taken together, specific hydrogen bonding patterns are found in different GL clusters of a given trisaccharide, suggesting specific interactions that stabilize respective conformational states. Notably, the conformational heterogeneity differs significantly with variations in the anomeric configuration of only one monosaccharide as observed from the comparison between trisaccharides 4 and 5. Such an effect indicates that small changes in the composition of a polysaccharide can have a significant impact on the overall conformational properties.
3D spatial distribution of the trisaccharide conformations
GL clustering identifies conformers of a saccharide that are in the same local minima on the free energy landscapes of the glycosidic linkages. However, this clustering method does not present a direct 3D spatial distribution of the conformations. To show the spatial extension for individual GL clusters, we computed the Cartesian coordinate-based RMSD distributions and the spatial 3D probability distribution for the trisaccharides. For each GL cluster, the ‘central conformation’ was determined based on the conformer with the smallest deviation relative to the remaining conformations in the cluster. Then RMSD values for all conformations in each cluster were computed with respect to the central conformation. In addition, the RMSD values were calculated for all conformations for each trisaccharide relative to the central conformations of the top five GL clusters. The RMSD distributions shows that most conformations associated with each GL cluster are distributed around one major peak within a range of 1.5 Å in most cases (Fig. 14, solid lines). This is consistent with the GL clusters being defined based on the local minima in the 2D glycosidic linkage free energy surfaces. However, GL cluster 3 of trisaccharides 3 and 5 has a broader distribution out to 2.2 Å. Concerning the RMSD values calculated for all the conformations in the trisaccharides with respect to the central conformation of individual GL clusters (Fig. 14, dotted lines), the RMSD distributions are significantly larger than in the individual GL clusters, with RMSD values of 3 Å. The largest extent of conformational sampling is observed for trisaccharides 3, 4 and 5, representing branched structures, compared to the linear trisaccharides 1 and 2. The combination of the GL cluster and RMSD analysis indicates that sampling of conformations beyond a single GL cluster leads to an expected increase in sampling of Cartesian coordinate space. However, even within a given GL cluster the extent of Cartesian coordinate sampling is significant and likely to occur on short time scales given the lack of significant barriers between conformations.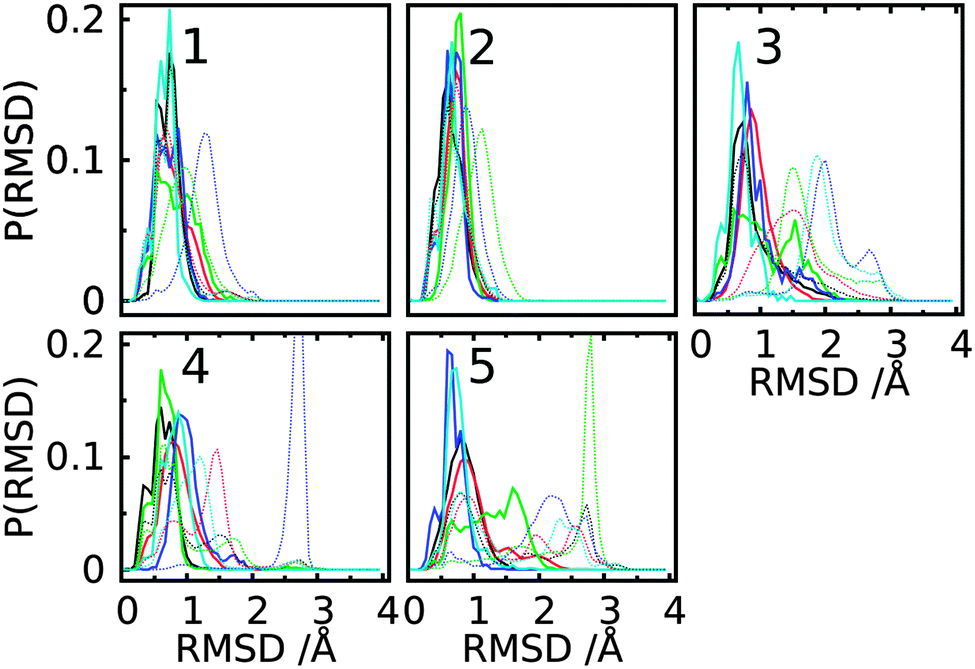 | ||
| Fig. 14 Distribution of the RMSD values for the first five dihedral-based clusters in each simulation of trisaccharides 1–5. Solid lines represents RMSD values computed using conformations only in the given cluster with respect to the central conformation of the cluster; dotted lines correspond to the RMSD for all conformations in the trajectory relative to the same reference as the respective solid line with same color represented. Each conformation in one cluster or the whole trajectory was first aligned to the reducing-end monosaccharide, i.e. the O-methyl glycoside residue, of the reference state and then the RMSD was computed for all atoms in the other two monosaccharides. GL clusters are colored black for cluster 1, red for cluster 2, green for cluster 3, blue for cluster 4 and cyan for cluster 5. | ||
Besides RMSD, the spatial distribution can also be represented by the volume of the sampled conformations. To compute the sampled volume, a 3D map with a voxel size of 1 Å × 1 Å × 1 Å was constructed around each saccharide and then each non-hydrogen atom of an aligned conformation was assigned to a grid. The sampled volume is the total number of voxels occupied by at least one atom. This analysis was performed for all conformations sampled by each trisaccharide or for individual GL clusters (Fig. 15). The most highly populated clusters typically sample the largest volumes, though with trisaccharides 2, 4 and 5, GL cluster 2 samples larger volumes. This indicates that specific hydrogen bond interactions that stabilize a GL cluster may lead to a decrease in conformational variability.
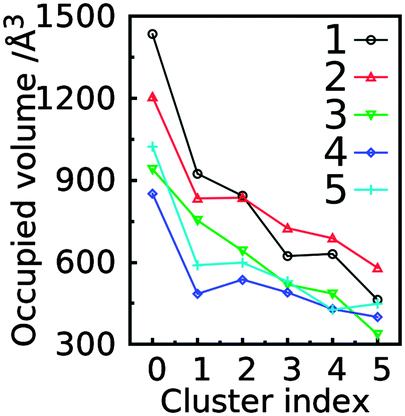 | ||
| Fig. 15 The occupied volume for conformations in the first five clusters or the whole trajectory (cluster 0) in the simulations of trisaccharides 1–5 based on the number of occupied voxels. The spatial occupancy was computed by aligning the reducing-end monosaccharide of each conformation to the reference state and then assigning each non-hydrogen atom of a conformation into one voxel. The voxel size is defined as 1 Å × 1 Å × 1 Å. | ||
Analysis of the volumes sampled by the saccharides offers a convenient approach to visualize the extent of conformational sampling. Shown in Fig. 16 are 3D spatial distributions sampled by trisaccharide 4 overlaid on a selected conformation of the trisaccharide (Fig. 1). As is evident, a broad spatial range of conformations is being sampled by the trisaccharide. Notable is the sampling of similar, but slightly different spatial regions by GL cluster 1 vs. 2 and, as expected, a wider range of sampling occurs when all conformations are taken into account.
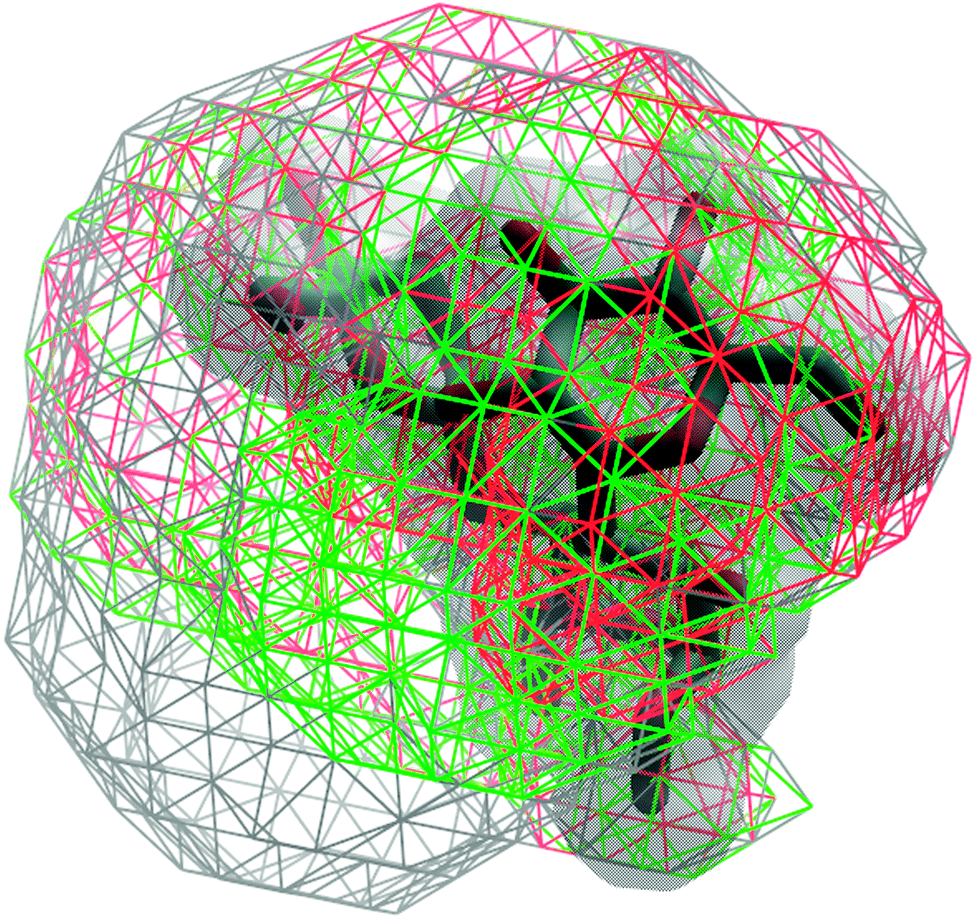 | ||
| Fig. 16 3D spatial distribution of the sampled conformations for trisaccharide 4. The occupied volume for the entire trajectory, GL clusters 1 and 2 are shown in wireframes and colored in gray, red and green, respectively. The solid surface in gray represents the van der Waals surface of a selected conformation of the trisaccharide. Conformations were aligned based on the O-methyl monosaccharide (Fig. 1). | ||
The range of the spatial distributions sampled in the different GL clusters being similar is expected because of the presence of only two glycosidic linkages. With additional glycosidic linkages that would be present in complex oligo- or polysaccharides, small deviations in the dihedral space sampled in different GL clusters can be anticipated to result in larger accumulated spatial differences. This spatial difference may correspond to different packing patterns, which are stabilized by favorable long-range hydrogen bond interactions. In such cases, the inter-monosaccharide nonbonded interactions in conjunction with the localized glycosidic linkage conformations will play an important role in dictating to the overall conformational sampling of complex saccharides.
Conclusions
For the five studied trisaccharides the simulated results reproduce well the experimental J coupling constants and effective 1H,1H distances. Whereas the NOE-based experiments give a good description of the 3D-structure of an oligosaccharide, they are limited by the 〈r−6〉 averaging making the detailed interpretation somewhat less precise with respect to subtle conformational differences, the J-based experiments are excellent in picking up small perturbations from the environment (solvent) per se or due to changes in structure such as with the five trisaccharides investigated herein. However, the combination of the two types of experiments facilitates a powerful way to elucidate the conformational space sampled by the molecules. Detailed analysis of the simulation results additionally provides an atomic-level interpretation of the conformational heterogeneity of the trisaccharides, from which the impact of monosaccharide compositions and linkage types can be identified. Notably, accounting for the full range of sampled conformations, as defined by clustering of the conformational states based on the glycosidic linkage dihedrals, is required to reproduce the experimental data. These results stress the usefulness of the MD simulations in obtaining a high-resolution description at the atomic level of detail of the conformational heterogeneity of the oligosaccharides.The present study shows that the variation in anomeric configuration can result in significant difference in the conformational preferences of the trisaccharides. In addition, the inter-monosaccharide hydrogen bonding interactions also play a critical role in defining the conformational sampling of the trisaccharides. The present observations will facilitate our understanding of how trisaccharides contribute to conformational heterogeneity in more complicated saccharides, as well as enable the determination of structure–function relationships, which will help to direct the rational design of oligo- and polysaccharides with specific functions, such as those that are used in the development of vaccines where the presentation of key structural epitopes is essential for immunogenic response.
Acknowledgements
This work was supported by grants from NIH (GM070855) to ADM Jr and the Swedish Research Council (No. 621-2013-4859) and The Knut and Alice Wallenberg Foundation to GW. The Swedish NMR Centre at Göteborg University is thanked for access to a high field spectrometer and computational support from the University of Maryland Computer-Aided Drug Design Center is acknowledged. MJ acknowledges the helpful discussion with Dr Jing Huang on the calculation of J coupling constants using the DFT method.References
- Essentials of Glycobiology, ed. A. Varki, R. Cummins, J. Esko, H. Freeze, G. Hart and J. Marth, Cold Spring Harbor Laboratory Press, Cold Spring Harbor, New York, 2nd edn, 2009 Search PubMed.
- D. M. Alonso, S. G. Wettstein and J. A. Dumesic, Chem. Soc. Rev., 2012, 41, 8075–8098 RSC.
- A. M. Slaney, V. A. Wright, P. J. Meloncelli, K. D. Harris, L. J. West, T. L. Lowary and J. M. Buriak, ACS Appl. Mater. Interfaces, 2011, 3, 1601–1612 Search PubMed.
- R. D. Astronomo and D. R. Burton, Nat. Rev. Drug Discovery, 2010, 9, 308–324 CrossRef CAS PubMed.
- Y. Huang and C. Wun, Expert Rev. Vaccines, 2010, 9, 1257–1274 CrossRef CAS PubMed.
- D. R. Burton, P. Poignard, R. L. Stanfield and I. A. Wilson, Science, 2012, 337, 183–186 CrossRef CAS PubMed.
- R. Lang, G. Winter, L. Vogt, A. Zuercher, B. Dorigo and B. Schimmele, Drug Dev. Ind. Pharm., 2009, 35, 83–97 CrossRef CAS PubMed.
- R. K. Shukla and A. Tiwari, Crit. Rev. Ther. Drug Carrier Syst., 2011, 28, 255–292 CrossRef CAS PubMed.
- E. Hatcher, E. Säwén, G. Widmalm and A. D. MacKerell, Jr., J. Phys. Chem. B, 2011, 115, 597–608 CrossRef CAS PubMed.
- S. S. Mallajosyula and A. D. MacKerell, Jr., J. Phys. Chem. B, 2011, 115, 11215–11229 CrossRef CAS PubMed.
- S. Re, N. Miyashita, Y. Yamaguchi and Y. Sugita, Biophys. J., 2011, 101, L44–L46 CrossRef CAS PubMed.
- S. Re, W. Nishima, N. Miyashita and Y. Sugita, Biophys. Rev., 2012, 4, 179–187 CrossRef CAS PubMed.
- S. S. Mallajosyula, K. M. Adams, J. J. Barchi and A. D. MacKerell, Jr., J. Chem. Inf. Model., 2013, 53, 1127–1137 CrossRef CAS PubMed.
- D. S. Patel, R. Pendrill, S. S. Mallajosyula, G. Widmalm and A. D. MacKerell, Jr., J. Phys. Chem. B, 2014, 118, 2851–2871 CrossRef CAS PubMed.
- S. Andre, T. Kozar, R. Schuberth, C. Unverzagt, S. Kojima and H.-J. Gabius, Biochemistry, 2007, 46, 6984–6995 CrossRef CAS PubMed.
- E. C. Stanca-Kaposta, D. P. Gamblin, E. J. Cocinero, J. Frey, R. T. Kroemer, A. J. Fairbanks, B. G. Davis and J. P. Simons, J. Am. Chem. Soc., 2008, 130, 10691–10696 CrossRef CAS PubMed.
- X. He, E. Hatcher, L. Eriksson, G. Widmalm and A. D. MacKerell, Jr., J. Phys. Chem. B, 2013, 117, 7546–7553 CrossRef CAS PubMed.
- S. Krishnan, F. Liu, R. Abrol, J. Hodges, W. A. Goddard and N. V. Prasadarao, J. Biol. Chem., 2014, 289, 30937–30949 CrossRef CAS PubMed.
- G. Widmalm, Carbohydr. Res., 2013, 378, 123–132 CrossRef CAS PubMed.
- NMR Spectroscopy of Glycoconjugates, ed. J. Jiménez-Barbero and T. Peters, Wiley-VCH Verlag GmbH & Co. KGaA, 2003 Search PubMed.
- A. Adeyeye, P.-E. Jansson, L. Kenne and G. Widmalm, J. Chem. Soc., Perkin Trans. 2, 1991, 963–973 RSC.
- A. Kjellberg, J. Kowalewski and G. Widmalm, J. Phys. Chem. B, 1998, 102, 1013–1020 CrossRef CAS.
- P. Söderman, P.-E. Jansson and G. Widmalm, J. Chem. Soc., Perkin Trans. 2, 1998, 639–648 RSC.
- A. Kjellberg and G. Widmalm, Biopolymers, 1999, 50, 391–399 CrossRef CAS PubMed.
- C. Höög and G. Widmalm, Arch. Biochem. Biophys., 2000, 377, 163–170 CrossRef PubMed.
- A. M. Dixon, R. Venable, G. Widmalm, T. E. Bull and R. W. Pastor, Biopolymers, 2003, 69, 448–460 CrossRef CAS PubMed.
- R. Eklund and G. Widmalm, Carbohydr. Res., 2003, 338, 393–398 CrossRef CAS PubMed.
- O. Guvench, S. N. Greene, G. Kamath, J. W. Brady, R. M. Venable, R. W. Pastor and A. D. Mackerell, Jr., J. Comput. Chem., 2008, 29, 2543–2564 CrossRef CAS PubMed.
- K. N. Kirschner, A. B. Yongye, S. M. Tschampel, J. Gonzalez-Outeirino, C. R. Daniels, B. L. Foley and R. J. Woods, J. Comput. Chem., 2008, 29, 622–655 CrossRef CAS PubMed.
- O. Guvench, E. Hatcher, R. M. Venable, R. W. Pastor and A. D. MacKerell, Jr., J. Chem. Theory Comput., 2009, 5, 2353–2370 CrossRef CAS PubMed.
- E. Hatcher, O. Guvench and A. D. MacKerell, Jr., J. Phys. Chem. B, 2009, 113, 12466–12476 CrossRef CAS PubMed.
- E. P. Raman, O. Guvench and A. D. MacKerell, Jr., J. Phys. Chem. B, 2010, 114, 12981–12994 CrossRef CAS PubMed.
- W. Plazinski, A. Lonardi and P. H. Hünenberger, J. Comput. Chem., 2016, 37, 354–365 CrossRef CAS PubMed.
- M. Yang, L. Yang, Y. Gao and H. Hu, J. Chem. Phys., 2014, 141, 044108 CrossRef PubMed.
- M. Yang, J. Huang and A. D. MacKerell Jr., J. Chem. Theory Comput., 2015, 11, 2855–2867 CrossRef CAS PubMed.
- M. Yang and A. D. MacKerell, Jr., J. Chem. Theory Comput., 2015, 11, 788–799 CrossRef CAS PubMed.
- L. Jin, K. E. Kövér, M. R. Lenoir and D. Uhrin, J. Magn. Reson., 2008, 190, 171–182 CrossRef CAS PubMed.
- R. Pendrill, O. W. Sørensen and G. Widmalm, Magn. Reson. Chem., 2014, 52, 82–86 CrossRef CAS PubMed.
- E. Säwén, T. Massad, C. Landersjö, P. Damberg and G. Widmalm, Org. Biomol. Chem., 2010, 8, 3684–3695 Search PubMed.
- O. Guvench, S. S. Mallajosyula, E. P. Raman, E. Hatcher, K. Vanommeslaeghe, T. J. Foster, F. W. Jamison and A. D. MacKerell, Jr., J. Chem. Theory Comput., 2011, 7, 3162–3180 CrossRef CAS PubMed.
- P. Damberg, J. Jarvet and A. Gräslund, J. Magn. Reson., 2001, 148, 343–348 CrossRef CAS PubMed.
- R. Mills, J. Phys. Chem., 1973, 77, 685–688 CrossRef CAS.
- M. Findeisen, T. Brand and S. Berger, Magn. Reson. Chem., 2007, 45, 175–178 CrossRef CAS PubMed.
- A. Meissner and O. W. Sørensen, Magn. Reson. Chem., 2001, 39, 49–52 CrossRef CAS.
- K. Stott, J. Keeler, Q. N. Van and A. J. Shaka, J. Magn. Reson., 1997, 125, 302–324 CrossRef CAS.
- H. Hu, S. A. Bradley and K. Krishnamurthy, J. Magn. Reson., 2004, 171, 201–206 CrossRef CAS PubMed.
- M. J. Thrippleton and J. Keeler, Angew. Chem., Int. Ed., 2003, 42, 3938–3941 CrossRef CAS PubMed.
- A. Bax, R. Freeman and S. P. Kempsell, J. Am. Chem. Soc., 1980, 102, 4849–4851 CrossRef CAS.
- S. Berger, Angew. Chem., Int. Ed., 1988, 27, 1196–1197 CrossRef.
- F. del Río-Portilla, V. Blechta and R. Freeman, J. Magn. Reson., Ser. A, 1994, 111, 132–135 CrossRef.
- P.-E. Jansson, A. Kjellberg, T. Rundlöf and G. Widmalm, J. Chem. Soc., Perkin Trans. 2, 1996, 33–37 RSC.
- B. R. Brooks, C. L. Brooks, III, A. D. Mackerell, Jr., L. Nilsson, R. J. Petrella, B. Roux, Y. Won, G. Archontis, C. Bartels, S. Boresch, A. Caflisch, L. Caves, Q. Cui, A. R. Dinner, M. Feig, S. Fischer, J. Gao, M. Hodoscek, W. Im, K. Kuczera, T. Lazaridis, J. Ma, V. Ovchinnikov, E. Paci, R. W. Pastor, C. B. Post, J. Z. Pu, M. Schaefer, B. Tidor, R. M. Venable, H. L. Woodcock, X. Wu, W. Yang, D. M. York and M. Karplus, J. Comput. Chem., 2009, 30, 1545–1614 CrossRef CAS PubMed.
- W. L. Jorgensen, J. Chandrasekhar, J. D. Madura, R. W. Impey and M. L. Klein, J. Chem. Phys., 1983, 79, 926–935 CrossRef CAS.
- W. E. Reiher, Theoretical studies of hydrogen bonding, 1985 Search PubMed.
- E. Neria, S. Fischer and M. Karplus, J. Chem. Phys., 1996, 105, 1902–1921 CrossRef CAS.
- W. G. Hoover, Phys. Rev. A, 1985, 31, 1695–1697 CrossRef.
- S. E. Feller, Y. Zhang, R. W. Pastor and B. R. Brooks, J. Chem. Phys., 1995, 103, 4613–4621 CrossRef CAS.
- J.-P. Ryckaert, G. Ciccotti and H. J. C. Berendsen, J. Comput. Phys., 1977, 23, 327–341 CrossRef CAS.
- T. Darden, D. York and L. Pedersen, J. Chem. Phys., 1993, 98, 10089–10092 CrossRef CAS.
- W. Jiang, M. Hodoscek and B. Roux, J. Chem. Theory Comput., 2009, 5, 2583–2588 CrossRef CAS PubMed.
- A. D. MacKerell, Jr., M. Feig and C. L. Brooks, J. Comput. Chem., 2004, 25, 1400–1415 CrossRef PubMed.
- A. D. MacKerell, Jr., M. Feig and C. L. Brooks, J. Am. Chem. Soc., 2004, 126, 698–699 CrossRef PubMed.
- K. Ruud, T. Helgaker, K. L. Bak, P. Jørgensen and H. J. Aa. Jensen, J. Chem. Phys., 1993, 99, 3847–3859 CrossRef CAS.
- C. Lee, W. Yang and R. G. Parr, Phys. Rev. B, 1988, 37, 785–789 CrossRef CAS.
- J. Breitling and A. Markus, Cold Spring Harbor Perspect. Biol., 2013, 5, a013359 Search PubMed.
- D. Kaur, H. Pham, G. Larrouy-Maumus, M. Rivière, V. Vissa, M. E. Guerin, G. Puzo, P. J. Brennan and M. Jackson, PLoS One, 2009, 4, e5447 CrossRef PubMed.
- H. Hu and K. Krishnamurthy, J. Magn. Reson., 2006, 182, 173–177 CrossRef CAS PubMed.
- S. Macura, B. T. Farmer II and L. R. Brown, J. Magn. Reson., 1986, 70, 493–499 CAS.
- A. M. Dixon, G. Widmalm and T. E. Bull, J. Magn. Reson., 2000, 147, 266–272 CrossRef CAS PubMed.
- T. Nishida, G. Widmalm and P. Sandor, Magn. Reson. Chem., 1995, 33, 596–599 CrossRef CAS.
- T. Nishida, G. Widmalm and P. Sándor, Magn. Reson. Chem., 1996, 34, 377–382 CrossRef CAS.
- M. Zerbetto, A. Polimeno, D. Kotsyubynskyy, L. Ghalebani, J. Kowalewski, E. Meirovitch, U. Olsson and G. Widmalm, J. Chem. Phys., 2009, 131, 234501 CrossRef PubMed.
- R. Pendrill, O. Engström, A. Volpato, M. Zerbetto, A. Polimeno and G. Widmalm, Phys. Chem. Chem. Phys., 2016, 18, 3086–3096 RSC.
- K. H. M. Jonsson, E. Säwén and G. Widmalm, Org. Biomol. Chem., 2012, 10, 2453–2463 Search PubMed.
- M. Oikawa, S. Adachi and S. Kusumoto, Org. Lett., 2005, 7, 661–664 CrossRef CAS PubMed.
- T. Church, I. Carmichael and A. S. Serianni, Carbohydr. Res., 1996, 280, 177–186 CrossRef CAS.
- F. Cloran, I. Carmichael and A. S. Serianni, J. Am. Chem. Soc., 2000, 122, 396–397 CrossRef CAS.
- D. Neuhaus, G. Wagner, M. Vasák, J. H. R. Kägi and K. Wüthrich, Eur. J. Biochem., 1985, 151, 257–273 CrossRef CAS PubMed.
- K. G. R. Pachler, Tetrahedron, 1971, 27, 187–199 CrossRef CAS.
- K. G. R. Pachler, Tetrahedron Lett., 1970, 11, 1955–1958 CrossRef.
- D. S. Patel, X. He and A. D. MacKerell, Jr., J. Phys. Chem. B, 2015, 119, 637–652 CrossRef CAS PubMed.
- M. Jana and A. D. MacKerell Jr., J. Phys. Chem. B, 2015, 119, 7846–7859 CrossRef CAS PubMed.
- D. Cremer and J. A. Pople, J. Am. Chem. Soc., 1975, 97, 1354–1358 CrossRef CAS.
- V. S. R. Rao, P. K. Qasba, P. V. Balaji and R. Chandrasekaran, Conformation of carbohydrates, Harwood Academic, Amsterdam, 1998 Search PubMed.
- R. Stenutz, I. Carmichael, G. Widmalm and A. S. Serianni, J. Org. Chem., 2002, 67, 949–958 CrossRef CAS PubMed.
- S. Jo and W. Im, Nucleic Acids Res., 2013, 41, D470–D474 CrossRef CAS PubMed.
- S. Jo, H. S. Lee, J. Skolnick and W. Im, PLoS Comput. Biol., 2013, 9, e1002946 CrossRef CAS PubMed.
- H. Masoud, M. B. Perry, J.-R. Brisson, D. Uhrin and J. C. Richards, Can. J. Chem., 1994, 72, 1466–1477 CrossRef CAS.
- T. Holme, M. Rahman, P. E. Jansson and G. Widmalm, Eur. J. Biochem., 1999, 265, 524–529 CrossRef CAS PubMed.
- K. Lycknert, P. Edebrink and G. Widmalm, Angew. Chem., Int. Ed., 2004, 43, 2288–2290 CrossRef CAS PubMed.
- M. Frank, P. M. Collins, I. R. Peak, I. D. Grice and J. C. Wilson, Molecules, 2015, 20, 14234–14253 CrossRef CAS PubMed.
- T. Rundlöf, A. Kjellberg, C. Damberg, T. Nishida and G. Widmalm, Magn. Reson. Chem., 1998, 36, 839–847 CrossRef.
Footnotes |
| † Electronic supplementary information (ESI) available. See DOI: 10.1039/c6cp02970a |
| ‡ M. Y. and T. A. d’O. contributed equally to this work. |
| This journal is © the Owner Societies 2016 |