
 Open Access Article
 This Open Access Article is licensed under a
 Creative Commons Attribution 3.0 Unported Licence
Getting excited: challenges in quantum-classical studies of excitons in polymeric systems†
Behnaz
Bagheri
,
Björn
Baumeier
 * and
Mikko
Karttunen
*
* and
Mikko
Karttunen
*
Department of Mathematics and Computer Science & Institute for Complex Molecular Systems, Eindhoven University of Technology, P.O. Box 513, 5600 MB Eindhoven, The Netherlands. E-mail: b.baumeier@tue.nl; m.e.j.karttunen@tue.nl
First published on 18th July 2016
Abstract
A combination of classical molecular dynamics (MM/MD) and quantum chemical calculations based on the density functional theory (DFT) was performed to describe the conformational properties of diphenylethyne (DPE), methylated-DPE and poly para phenylene ethynylene (PPE). DFT calculations were employed to improve and develop force field parameters for MM/MD simulations. Many-body Green's function theory within the GW approximation and the Bethe–Salpeter (GW-BSE) equation were utilized to describe the excited states of the systems. The reliability of the excitation energies based on the MM/MD conformations was examined and compared to the excitation energies from DFT conformations. The results show an overall agreement between the optical excitations based on MM/MD conformations and DFT conformations. This allows for the calculation of excitation energies based on MM/MD conformations.
1 Introduction
Multiscale modelling has become one of the leading themes in modelling materials and their different properties. The most famous use of this term is in the 2013 Nobel Prize in Chemistry “for the development of multiscale models for complex chemical systems”. Its increasing popularity can also be seen in the titles of published peer reviewed papers: according to the Web of Science, in 2015, 1157 articles had the term “multiscale” in their title, a decade earlier the number was 520 and in 1990 it was only 41.“Multiscale” is often used synonymously with “coarse graining”. Coarse graining typically refers to obtaining interaction potentials and parameters for a higher level system from structural equilibrium data. Examples of such are force matching,1,2 and inverse Boltzmann3 and inverse Monte Carlo methods.4,5 The latter two are based on the Henderson theorem6 which is essentially the Hohenberg–Kohn theorem7 for classical systems; for a brief derivation and discussion of the relationship between them, see the study of Murtola et al.8 More heuristic approaches such as the Martini model9 and the PLUM model10 are other common approaches; for a comparison between PLUM, Martini and atomistic models, see the study of Bereau et al.11 One of the leading ideas is that systematic coarse graining allows, at least in principle, also fine graining, that is, remapping the higher level model back to the original more microscopic one.12 Backmapping procedures exist for the Martini model13,14 and such approaches have been proven to be useful in modelling lipids and proteins, see e.g. the study of Pannuzzo et al.15 One somewhat less considered but an important issue is sampling at different levels of coarse-graining.16 For more details on coarse graining, see recent reviews in ref. 8, 17–19.
Multiscale modelling is a much broader concept. For example, instead of linking scales via deriving new interaction potentials, in hybrid simulations some part of the system is described with a different resolution from the rest and information is transmitted between the two different regions. Examples of such are QM/MM (quantum–molecular mechanics), MM/CG (molecular mechanics–coarse grained) and even QM/QM (quantum–quantum). The idea is that more detailed information in some well defined region is sought after and the crucial issue is how to couple the main system and the subsystem. This has been discussed extensively, see, e.g., ref. 20, but the essence is that both the dynamic and static properties must be communicated between the systems. This may include polarization, changes in the charge-state of the system, and so on. Yet another multiscale approach is the so-called adaptive resolution method, or AdResS. In this case, run-time information is transmitted between layers of description ranging from atomistic even up to continuum.21,22
Electronic excitations pose a significant challenge for multiscaling23–31 since typical DFT methods describe the ground state. An assessment of the interplay between the molecular electronic structure, the morphological order, and thermodynamic properties requires the knowledge of the material morphology at atomic resolution, as well as strategies to couple quantum mechanical techniques to classical environments for accurate evaluation of electronic excitations.32–34
Morphology can have several characteristic length scales and be kinetically arrested. Employing all-atom molecular dynamics is limited to a few microseconds, which might be too short to fully relax molecular positions and orientations during aggregation35 in polymer melts,36–38 or polymers in miscible solutions.39 In such cases more coarse representations might be helpful to overcome the limitations of atomistic models.40–43 Using empirical atomistic potentials in multiscale simulations of excitations based on quantum calculations requires that the structural description at different levels of resolution are compatible with each other. For example, bond length deviations or fluctuations in angles and torsions can lead to substantial artifacts if the backmapped/fine-grained geometries do not match the potential energy surfaces (PESs) of the underlying quantum mechanical system. Such a situation regularly arises for conjugated polymers since conjugation can depend sensitively on conformation. In (semi)flexible polymers, conjugation along a single chain can be broken due to large out-of-plane torsions between two repeat units. Broken conjugation and wave function localization44–46 are often intuitively interpreted based on a simple empirical criterion, the dihedral angle between two adjacent repeat units.28 In general, details are specific to the backbone chemistry, functionalization by side chains, and solute–solvent interactions. Characteristics of conjugation also directly influence the localization behavior of electronic excitations and hence the electronic and optical properties of the polymer.
In this paper, some of the underlying challenges pertaining to the transfer of structural atomistic details between quantum and all-atom resolutions are demonstrated. As an example, we consider the calculation of the optical properties of poly-PPE (see the chemical structure in Fig. 1), a relatively rigid conjugated polymer consisting of aromatic phenyl rings bridged by alternating single and triple carbon bonds. PPEs can be prepared in a variety of morphologies, ranging from extended single chains to polydots and their optical properties make them particularly attractive for use in fluorescence imaging and sensing.47–49 Due to the importance of backbone torsions for conjugation and hence excitations, we compare PESs for phenyl rotations in diphenylethyne (DPE, see Fig. 2) obtained using density functional theory (DFT) to the ones from all-atom simulations using a standard force field and experimental data. Significant discrepancies were found and as a result, the atomistic force field was re-parameterized. With this modified force field, ground state geometries are optimized for n-PPE oligomers with n = 1,…, 10 and then used in GW-BSE calculations. The associated excitation energies are benchmarked with results from quantum-mechanical treatment, revealing qualitatively similar characteristics as a function of n but deviations at the quantitative level. Finally, conformations from MD simulations of 2,5-dinonyl-10-PPE solvated in toluene are used in a QM/MM setup to evaluate absorption and emission spectra.
 | ||
| Fig. 1 Chemical structure of poly para phenylene ethynylene (poly-PPE). n is the number of repeat units along the polymer (degree of polymerization). | ||
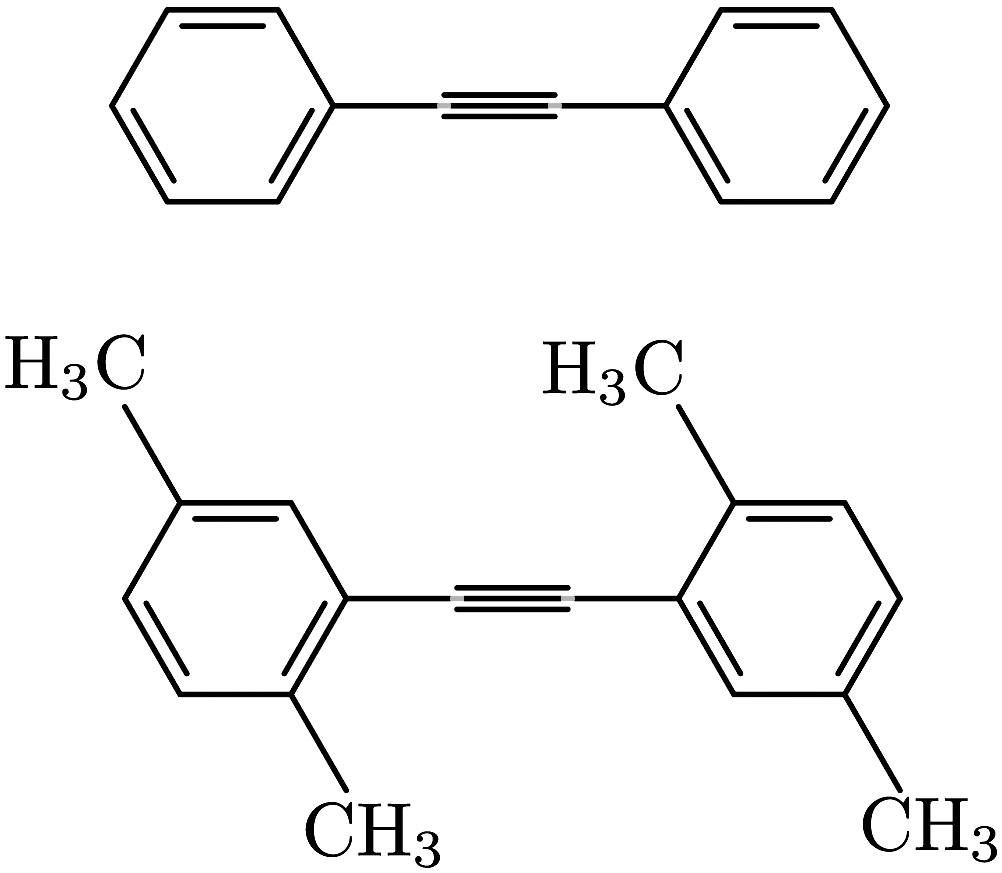 | ||
| Fig. 2 Chemical structures of diphenylethyne (DPE, top) and methylated diphenylethyne (Me-DPE, bottom). It consists of two aromatic rings bridged by a sequence of single bonds and very stiff triple bonds. | ||
2 Methodology
MM/MD calculations were performed by a force field of OPLS (optimized potential for liquid simulation)50–52 form using GROMACS simulation software version 4.53 The force field parameters are taken from the polymer consistent force field54,55 (PCFF) as converted to the OPLS form in ref. 56 and 57. We refer to it as PCFF* from now on. The OPLS potential energy function consists of harmonic bond stretching (Vbond), angle bending potential (Vangle), and non-bonded terms (Vnon-bonded) including Lennard-Jones (LJ) and electrostatics, and proper and improper dihedral potential terms (Vtorsion):50–52 | (1) |
 | (2) |
 | (3) |
 | (4) |
 and
and  . The intramolecular non-bonded interactions were evaluated for atom pairs separated by three or more bonds. The 1,4-intramolecular interactions were reduced50–52 by a factor of 1/2.
To obtain relaxed scans of potential energy surfaces (PESs) from MM/MD, energy minimization of the DPE molecule in a vacuum was performed using the conjugate gradient method followed by a short MD run (100 ps) with constant particle number (N) and temperature (T). A Langevin thermostat58 with a time step of 1 fs and open boundary conditions was applied. Temperature was maintained at 10 K with 10 fs damping constant. All LJ interactions were cut-off at 1.2 nm. A plain cut-off scheme was used for electrostatic interactions with 2.0 nm real space cut-off: with open boundary conditions plain cut-off can be used. For systems with periodic boundary conditions, the particle-mesh Ewald (PME)59,60 should be used instead. For more discussion about the importance of electrostatic interactions, please see ref. 61. The cut-off distance for the short-range neighbor list was 1.2 nm and the neighbor lists were updated at every step. The intention was to evaluate the ground state energies of DPE molecules with different torsional angles between aromatic rings. To do that, after the first energy minimization step, a short MD run at very low temperature was used to bring the system out of possible local minima. Then a second conjugate gradient energy minimization was performed to obtain the ground state MM/MD PES.
DFT optimizations and relaxed PES scans were performed using the B3LYP exchange correlation functional62–65 and the def2-TZVP basis set66 as implemented in the Orca package.67 Due to the lack of van der Waals (dispersion) interactions in standard DFT, Grimme's DFT-D3 method68 was employed.
In order to calculate electronically excited states, many-body Green's function theory in the GW approximation with the Bethe–Salpeter equation (GW-BSE)69 was employed, since static DFT70 cannot describe coupled electron–hole excitations. For details of the application to molecular systems, the reader is referred to ref. 71–76. The GW-BSE method is based on a set of Green's function equations of motion which contain electron–hole interaction (BSE) leading to the formation of excitons. It utilizes the DFT molecular orbitals and energies to calculate the one-particle Green's function (G) and screened Coulomb interaction (W) to obtain single-particle excitations within the GW approximation as introduced by Hedin and Lundqvist.69 An electron–hole excitation cannot be described in an effective single-particle picture but instead requires explicit treatment of a coupled two-particle system. The electron–hole amplitudes and associated transition energies can be obtained by solving the Bethe–Salpeter equation72–74. For the calculation of excitation energies according to the GW-BSE method, first DFT calculations were performed using the Orca package,67 the B3LYP functional,62–65 the effective core potentials of the Stuttgart/Dresden type,77 and the associated basis sets that are augmented by additional polarization functions78 of d symmetry. The specialized GW-BSE implementation for isolated systems71–73,79 available in the XTP module of the VOTCA software package80,81 is used in all further steps related to the excitations. For molecular visualizations, Visual Molecular Dynamics (VMD)82 and Jmol83 were used.
3 Results
3.1 Force field parametrization
Due to the influence of conformational details on the optical properties84,85 in PPEs, one needs to determine if the force field yields reliable minimum energy configurations. Hence, relaxed scans of the potential energy surface (PES) were obtained using both MM/MD and DFT.The resulting PESs are shown in Fig. 3. The PCFF* result (red triangles) shows a minimum at 90°, corresponding to twisted phenylene rings. In contrast, the result of the DFT-based scan (black squares) indicates a minimum energy configuration in which the two phenyl rings are co-planar, which is also extracted from experiments.48,86 The force field predicts a practically free rotation of phenylenes for T ≥ 0, while a barrier of around ∼4 kJ mol−1 (∼1.5 kBT) is obtained using DFT. The latter is comparable to the one reported in ref. 87. The experimental potential barrier is around ∼2 kJ mol−1.48,86,88 Overall, the scans imply that the PCFF* force field does not correctly model the ground state conformations of DPE, which can have severe implications for the derived optical properties.
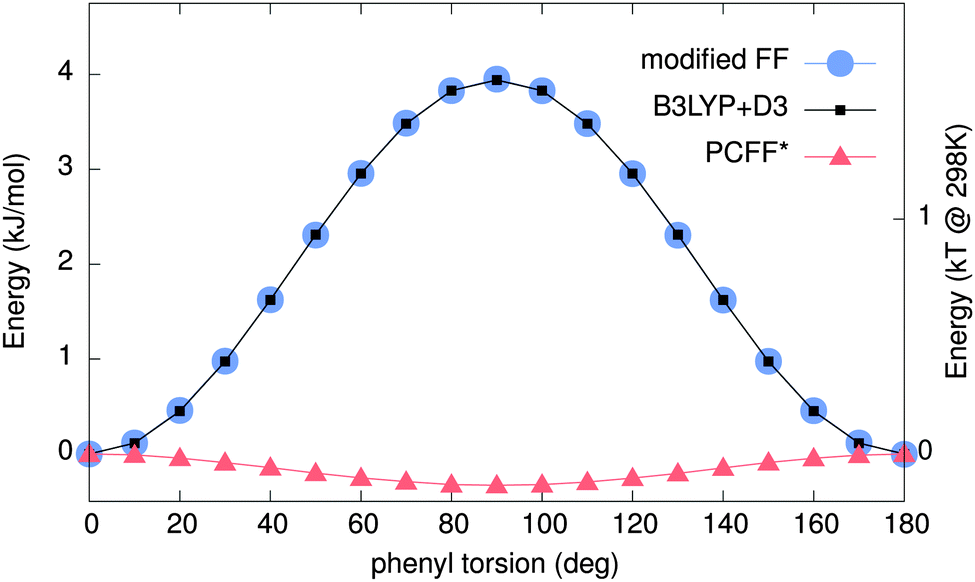 | ||
| Fig. 3 Potential energy surface (PES) obtained by MM/MD and quantum mechanical (QM) calculations. Red triangles show the PES calculated using the PCCF*56,57 force field. Black squares are the QM results using B3LYP+D3. Blue circles show the PES obtained using our new modified force field. The modified force field and B3LYP+D3 are in excellent agreement. | ||
To remedy this situation, the existing force field is refined by the addition of a torsional potential between the two adjacent phenylenes (see Fig. 4 for definition of involved atoms). By fitting eqn (4) to the differences of DFT and PCFF* potential energy surfaces, corresponding Ryckaert–Bellemans89 force parameters, provided in Table 1, were obtained. The PES is re-calculated with MM/MD using the modified force field, yielding the scan as shown in Fig. 3 (blue circles). It is in good agreement with the DFT result.
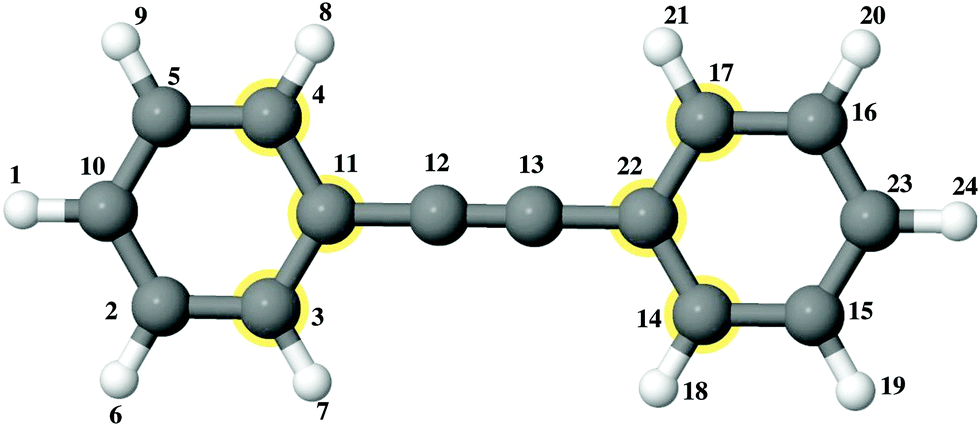 | ||
| Fig. 4 Atomic structure of DPE. Gray spheres show carbon atoms and white spheres indicate hydrogen atoms. The indices show the atom number. There is a triple bond between 12 and 13. | ||
| Torsion type | k 0 | k 1 | k 2 | k 3 | k 4 | k 5 |
|---|---|---|---|---|---|---|
| C–C–C—C | 1.0685 | 0.0007 | −1.0660 | 0.00004 | −0.00375 | −0.0004 |
To assess the transferability of the modified force field, we repeat the above scans of the torsional potential for para methylated-DPE (see the chemical structure shown in Fig. 2). The PESs resulting from both MD and DFT calculations are shown in Fig. 5. With the modified force field (blue circles) one can observe a good agreement with the DFT data (black squares). Both approaches predict a minimum energy configuration at 180° twist. The energetic preference of this cis conformation of Me-DPE over the trans conformation (0°) is driven by attractive dispersion interaction among the two CH3. While this preference is also obtained with the original PCFF* force field (red triangles), no barrier between cis and trans configurations is found. In terms of obtaining minimum energy configurations and energy barriers in the PES, the modified PCFF is clearly more reliable.
 | ||
| Fig. 5 Potential energy surface (PES) obtained using the modified force field (black squares), DFT calculations (blue circles), the PCFF* force field (red triangles). The modified force field gives reasonable agreement with the B3LYP+D3. Dispersion interaction between the methyl side chains leads to cis conformation (180°) preference over trans conformation (0°). | ||
3.2 Optical excitations in single molecules
For systems such as solvated polymer chains, the system size makes use of classical simulations inevitable to obtain structural information. Even with the modified force field at hand, it is not automatically guaranteed that the use of the MM/MD geometries in QM/MM schemes does not lead to spurious errors in the computed excitations. To further assess the level of reliability of such calculations, the evolution of the optical absorption properties of Me-DPE is examined as a function of phenyl torsions based on the respective optimized geometries.The optical absorption spectra resulting from the GW-BSE are shown in Fig. 6. DFT optimized geometries were used in (a) and MD energy minimized geometries using the modified force field were used in (b). The height of the curves indicates the strength of the excitation. Comparing both results, it is evident that the same dependency on the torsional angle is obtained by both approaches. With increasing twist from 0° to 90° the main absorption peak gradually shifts to higher energies while its strength decreases at the same time until it vanishes at 90°. Inspection of the electron and hole densities of the excitations for co-planar and perpendicular (see bottom of Fig. 6) also reveals no localization of the excitation during the rotation confirming that the conjugation via the C![[triple bond, length as m-dash]](https://www.rsc.org/images/entities/char_e002.gif) C bond is indeed strong. The identical behavior of the lowest energy excitations (which are typically those of interest) for both MM/MD and DFT conformations indicates that the modified force field is suitable for use in QM/MM calculations.
C bond is indeed strong. The identical behavior of the lowest energy excitations (which are typically those of interest) for both MM/MD and DFT conformations indicates that the modified force field is suitable for use in QM/MM calculations.
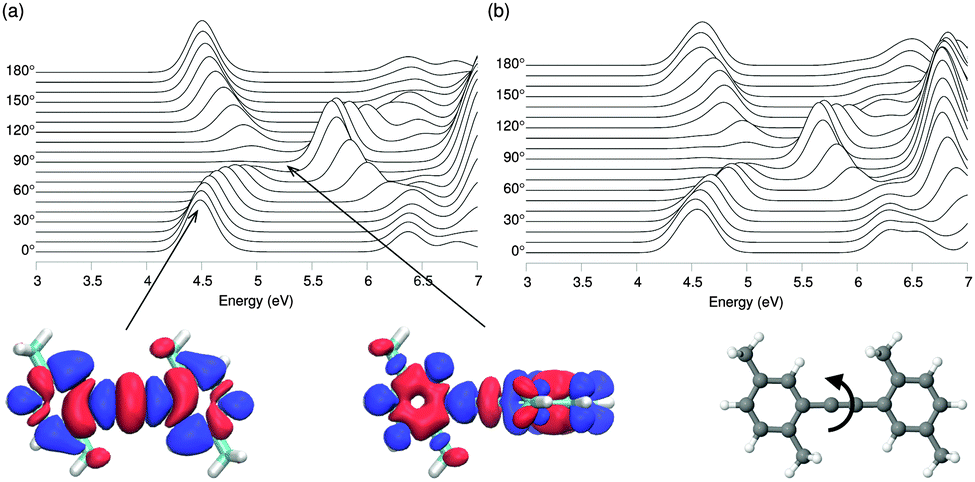 | ||
| Fig. 6 Top: Optical absorption spectra of Me-DPE as a function of torsional angle between phenylene rings based on (a) DFT optimized structures and (b) MM/MD energy minimized structures. The lower energy excitations in both (a) and (b) show the same dependency on the angle. Bottom: Isosurfaces (±5 × 10⁻³ e Å−3) of excitation electron density at 0° and 90° based on DFT optimized structures. The red color corresponds to negative values (hole density) and the blue color corresponds to positive values (electron density). Electron and hole densities are extended along the molecule at 0° and 90° and no localization of the excitation occurs. MAE (MAPE) of the energies underlying the spectra: S1 0.13 eV (2.7%), S2 0.05 eV (1.1%), and S3 0.05 eV (0.7%). | ||
So far the analysis has been limited to small model systems. As a next step towards more realistic system sizes, para phenylene ethynylene (PPE) oligomers (see Fig. 1) are investigated. Increasing the number of repeat units n from one to 10, lowest optically active excitation energies were computed with the GW-BSE for geometries optimized using quantum (GW-BSE@QM) and force field (GW-BSE@MM) approaches, respectively. The results shown in Fig. 7 exhibit a monotonous decrease with n for both approaches. Such a strong size-dependence can be traced back to an increase in the size of the conjugated system. From the particle-in-a-box model, one can estimate, e.g., the optical excitation energy of an infinitely long chain via Ω(n) = Ω∞ − a/n. By fitting the data for n > 3 to this model, a value of ΩQM∞ = 3.08 eV is obtained for QM geometries. For n > 7 the respective excitation energies vary only slightly and approach the region in which experimental absorption is measured in experiment.48 This indicates that studying more complex morphologies, i.e. solvated polymers, based on oligomers with n = 10 is an adequate choice. For MM geometries, the absorption energies are slightly higher, evidenced by the estimate of ΩMM∞ = 3.33 eV. Upon further inspection, this offset of 0.25 eV with respect to ΩQM∞ is a cumulative result of slight discrepancies in the bond length within the phenylenes and the C–C bridge bonds. In conclusion, the use of geometries determined using MM/MD in GW-BSE calculations can be expected to lead to slight quantitative overestimates of excitation energies. Qualitatively, however, a satisfying agreement is found.
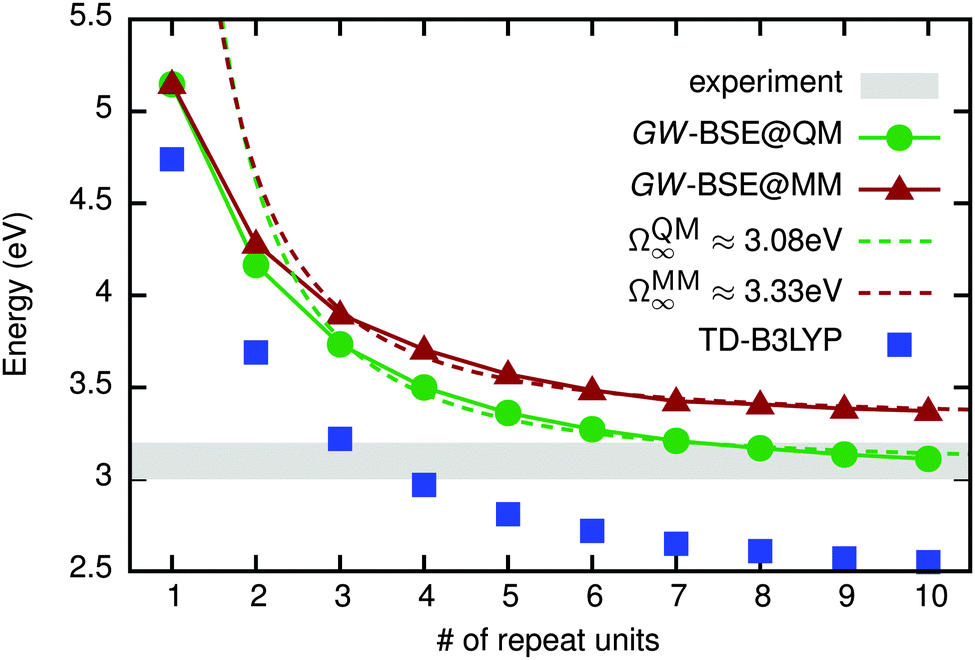 | ||
| Fig. 7 Lowest optically active excitation energies in n-PPE as the number of repeat units is increased from n = 1 to n = 10. The results obtained on DFT (MM/MD) geometries are shown as green points (red triangles). For comparison, results of TDDFT calculations using the B3LYP functional are indicated as blue squares. The respective dashed lines indicate the fit to the quantum-size model. The gray shaded area indicates the width of the experimental data.48 MAE (MAPE) of MM vs. QM structures is 0.19 eV (5.6%). MAE (MAPE) of TD-B3LYP vs. GW-BSE is 0.53 eV (15.3%). | ||
3.3 Absorption and emission of solvated 2,5-dinonyl-10-PPE
As an illustrative example of a typical application of a combined quantum-classical simulation of optical excitations, a single chain of 10-PPE was functionalized by nonyl side chains in 2,5 positions of the phenyl rings and solvated by toluene. The modified PCFF force field for the PPE backbone is used in combination with OPLS for nonyl and toluene. For technical details of the simulations, see ref. 90. A sample configuration of the backbone and side chains is taken from the 56 ns long trajectory and is shown in Fig. 8(a). Since toluene is a poor solvent for the nonyl, one can observe extended and partially strongly interacting side chains. As a consequence, the backbone is under considerable non-uniform stress leading to the overall curvature of the usually rigid polymer. | ||
| Fig. 8 (a) Sample configuration of 2,5-dinonyl-10-PPE solvated in toluene. Nonyl side chains are indicated in red and solvent molecules are not shown for clarity. (b) Definition of three types of rigid fragments used in back mapping of the backbone conformations used in the QM/MM setup. | ||
Starting from the same initial configuration, sets of 11 snapshots with time steps of 10 fs, 100 fs, 1 ps, and 10 ps, respectively, have been taken from the classical MD trajectory and optical excitation energies were calculated for them. For snapshots with a time step of 10 fs and 100 fs, no variation in the excitation energies was observed. We noticed that the excitation energies start to change once there is a 1 ps time step between the snapshots. A plot for excitation energies of these 11 snapshots for different time steps is given in the ESI.† These 11 snapshots with a time step of 1 ps are taken from the classical MD trajectory and each of the snapshots is partitioned into a quantum (the backbone) and a classical region comprising the side chains and the solvent molecules. QM and MM regions interact via static partial charge distributions. The aim of this setup is to evaluate the excitations of the polymer backbone taking its curved conformation into account while reducing discrepancies between the force-field and QM geometries, as much as possible. At the same time, the bridging carbon–carbon bond between the phenyl 2 and 5 positions and the nonyl side chain, defining the boundary between QM and MM regions, needs to be broken and the dangling bond is saturated by the hydrogen atom. This can be achieved with the help of a re-mapping scheme based on the definition of molecular fragments. Using centers of mass and gyration tensors, fragments of optimized QM configurations were mapped onto the orientation and alignment of the corresponding fragments in the MD configurations.
Fig. 8(b) illustrates the re-mapping scheme for PPE. Each phenyl ring (PHE), ethyne pair (ETH), and terminal methyl group (CH3) are defined as a unique fragment. A 10-PPE backbone is hence subdivided into a total of 23 fragments (10 PHE, 11 ETH, and 2 CH3) for mapping purposes.
With the re-mapped conformations at hand, the coupled GW-BSE/MM system is solved and the absorption spectrum is determined as an average over the eleven snapshots. Individual spectra are broadened by Gaussian functions with a FWHM of 0.3 eV and the resulting spectrum is shown as a blue line in Fig. 9. It is characterized by a single peak at an energy of 3.64 eV, which is larger than the value of 3.11 eV obtained for an isolated single oligomer. This spectral blue shift is a direct result of the polymer's curvature constrained by the side chain interactions. With the re-mapping scheme it is also possible to approximate emission spectra by using excited state QM geometries as a reference.91 Upon excitation, electrons are promoted to higher, often anti-bonding, molecular orbitals causing an extension of bonds. Constrained by side chains, a more general modification of the overall conformation (at least on short time scales) cannot be expected. Solving the GW-BSE/MM system based on excited state re-mapping yields the emission spectrum shown as a red line in Fig. 9. While no changes in the spectral shape can be observed, the peak position of the emission is red-shifted by 0.29 eV compared to the absorption peak. This Stokes shift is in good agreement with experimental data in the range of 0.3–0.4 eV.48
 | ||
| Fig. 9 Optical absorption (blue) and emission (blue) spectra of 2,5-dinonyl-10-PPE in toluene as obtained from GW-BSE/MM calculations using fragment based re-mapping. Both spectra are averages over 11 snapshots taken every 1 ps, respectively. A Stokes shift (red shift) of 0.29 eV is found, which compares well to experimental observations of 0.3–0.4 eV.48 | ||
4 Conclusions
A combination of atomistic (MM/MD) and DFT calculations was performed to describe the conformational properties of diphenylethyne (DPE), methylated-DPE and poly para phenylene ethynylene (PPE). MM/MD simulations based on the PCCF* force field were not able to provide a good description of the ground state conformation of the DPE molecule. Due to this, DFT calculations were employed to develop force field parameters to improve the MM/MD simulations. The modified force field was able to describe the conformation of methylated-DPE in agreement with DFT results. The GW-BSE method was utilized to describe excited states of the methylated-DPE and n-PPE polymer with n = 1, 2,…, 10. Optical excitations were obtained for the methylated-DPE and nPPE based on MM/MD energy minimized structures using the modified force field and DFT optimized geometries. The results for methylated-DPE show that the lowest energy excitations based on the MM/MD conformations and DFT optimized geometries follow the same pattern. This nearly identical behavior for the lowest energy excitations indicates that one can describe optical excitations using the GW-BSE method based on MM/MD conformations. The results for the excitation energies for nPPE indicate that there is an overall agreement between the results of the GW-BSE based on MM/MD energy minimized structures and DFT optimized geometries. There is a discrepancy of around 0.25 eV between the two. This discrepancy is a cumulative result of geometric differences between MM/MD and DFT structures. Overall agreement between MM/MD and QM based excitations is enough to validate the use of MM/MD conformations as the basis for the calculation of optical excitations using the GW-BSE method.References
- S. Izvekov and G. A. Voth, J. Chem. Phys., 2005, 123, 134105 CrossRef PubMed.
- L. Lu, S. Izvekov, A. Das, H. C. Andersen and G. A. Voth, J. Chem. Theory Comput., 2010, 6, 954–965 CrossRef CAS PubMed.
- D. Reith, M. Pütz and F. M. Plathe, J. Comput. Chem., 2003, 24, 1624–1636 CrossRef CAS PubMed.
- A. P. Lyubartsev and A. Laaksonen, Phys. Rev. E: Stat., Nonlinear, Soft Matter Phys., 1995, 52, 3730–3737 CrossRef CAS.
- A. P. Lyubartsev, M. Karttunen, I. Vattulainen and A. Laaksonen, Soft Mater., 2002, 1, 121–137 CrossRef.
- R. Henderson, Phys. Lett. A, 1974, 49, 197–198 CrossRef.
- P. Hohenberg and W. Kohn, Phys. Rev., 1964, 136, B864–B871 CrossRef.
- T. Murtola, A. Bunker, I. Vattulainen, M. Deserno and M. Karttunen, Phys. Chem. Chem. Phys., 2009, 11, 1869–1892 RSC.
- S. J. Marrink and D. P. Tieleman, Chem. Soc. Rev., 2013, 42, 6801–6822 RSC.
- T. Bereau, Z.-J. Wang and M. Deserno, J. Chem. Phys., 2014, 140, 115101 CrossRef PubMed.
- T. Bereau, W. F. D. Bennett, J. Pfaendtner, M. Deserno and M. Karttunen, J. Chem. Phys., 2015, 143, 243127 CrossRef PubMed.
- V. Krishna and L. Larini, J. Chem. Phys., 2011, 135, 124103 CrossRef PubMed.
- A. J. Rzepiela, L. V. Schaefer, N. Goga, H. J. Risselada, A. H. De Vries and S. J. Marrink, J. Comput. Chem., 2010, 1333–1343 CAS.
- T. A. Wassenaar, K. Pluhackova, R. A. Bockmann, S. J. Marrink and D. P. Tieleman, J. Chem. Theory Comput., 2014, 10, 676–690 CrossRef CAS PubMed.
- M. Pannuzzo, A. Raudino, D. Milardi, C. La Rosa and M. Karttunen, Sci. Rep., 2013, 3, 2781 Search PubMed.
- E. Lyman and D. M. Zuckerman, J. Chem. Theory Comput., 2006, 2, 656–666 CrossRef CAS PubMed.
- H. I. Ingolfsson, C. A. Lopez, J. J. Uusitalo, D. H. de Jong, S. M. Gopal, X. Periole and S. J. Marrink, Wiley Interdiscip. Rev.: Comput. Mol. Sci., 2013, 4, 225–248 CrossRef PubMed.
- W. G. Noid, J. Chem. Phys., 2013, 139, 090901 CrossRef CAS PubMed.
- E. Brini, E. A. Algaer, P. Ganguly, C. Li, F. Rodriguez-Ropero and N. F. A. van der Vegt, Soft Mater., 2013, 9, 2108–2119 RSC.
- S. Pezeshki and H. Lin, Mol. Simul., 2014, 41, 168–189 CrossRef.
- M. Praprotnik, L. D. Site and K. Kremer, Annu. Rev. Phys. Chem., 2008, 59, 545–571 CrossRef CAS PubMed.
- R. Delgado-Buscalioni, K. Kremer and M. Praprotnik, J. Chem. Phys., 2009, 131, 244107 CrossRef PubMed.
- Y. Olivier, L. Muccioli, V. Lemaur, Y. H. Geerts, C. Zannoni and J. Cornil, J. Phys. Chem. B, 2009, 113, 14102–14111 CrossRef CAS PubMed.
- E. Di Donato, R. P. Fornari, S. Di Motta, Y. Li, Z. Wang and F. Negri, J. Phys. Chem. B, 2010, 114, 5327–5334 CrossRef CAS PubMed.
- J. Nelson, J. J. Kwiatkowski, J. Kirkpatrick and J. M. Frost, Acc. Chem. Res., 2009, 42, 1768–1778 CrossRef CAS PubMed.
- T. Vehoff, B. Baumeier and D. Andrienko, J. Chem. Phys., 2010, 133, 134901 CrossRef PubMed.
- T. Vehoff, B. Baumeier, A. Troisi and D. Andrienko, J. Am. Chem. Soc., 2010, 132, 11702–11708 CrossRef CAS PubMed.
- V. Rühle, J. Kirkpatrick and D. Andrienko, J. Chem. Phys., 2010, 132, 134103 CrossRef PubMed.
- L. Wang, G. Nan, X. Yang, Q. Peng, Q. Li and Z. Shuai, Chem. Soc. Rev., 2010, 39, 423 RSC.
- M. Schrader, R. Fitzner, M. Hein, C. Elschner, B. Baumeier, K. Leo, M. Riede, P. Baeuerle and D. Andrienko, J. Am. Chem. Soc., 2012, 134, 6052–6056 CrossRef CAS PubMed.
- F. May, M. Al-Helwi, B. Baumeier, W. Kowalsky, E. Fuchs, C. Lennartz and D. Andrienko, J. Am. Chem. Soc., 2012, 134, 13818–13822 CrossRef CAS PubMed.
- F. May, B. Baumeier, C. Lennartz and D. Andrienko, Phys. Rev. Lett., 2012, 109, 136401 CrossRef PubMed.
- B. Baumeier, M. Rohlfing and D. Andrienko, J. Chem. Theory Comput., 2014, 10, 3104–3110 CrossRef CAS PubMed.
- C. Poelking, M. Tietze, C. Elschner, S. Olthof, D. Hertel, B. Baumeier, F. Würthner, K. Meerholz, K. Leo and D. Andrienko, Nat. Mater., 2015, 14, 434–439 CrossRef CAS PubMed.
- P. Clancy, Chem. Mater., 2011, 23, 522–543 CrossRef CAS.
- G. Zhang, L. A. Moreira, T. Stuehn, K. C. Daoulas and K. Kremer, ACS Macro Lett., 2014, 3, 198–203 CrossRef CAS.
- R. Potestio, C. Peter and K. Kremer, Entropy, 2014, 16, 4199–4245 CrossRef CAS.
- P. Gemünden, C. Poelking, K. Kremer, D. Andrienko and K. C. Daoulas, Macromolecules, 2013, 46, 5762–5774 CrossRef.
- D. Mukherji, C. M. Marques and K. Kremer, Nat. Commun., 2014, 5, 4882 CrossRef PubMed.
- V. Rühle, C. Junghans, A. Lukyanov, K. Kremer and D. Andrienko, J. Chem. Theory Comput., 2009, 5, 3211–3223 CrossRef PubMed.
- D. M. Huang, R. Faller, K. Do and A. J. Moulé, J. Chem. Theory Comput., 2010, 6, 526–537 CrossRef CAS PubMed.
- L. A. Moreira, G. Zhang, F. Müller, T. Stuehn and K. Kremer, Macromol. Theory Simul., 2015, 24, 419–431 CrossRef CAS.
- P. Gemünden, C. Poelking, K. Kremer, K. Daoulas and D. Andrienko, Macromol. Rapid Commun., 2015, 36, 1047–1053 CrossRef PubMed.
- N. Vukmirović and L. Wang, J. Chem. Phys., 2008, 128, 121102 CrossRef PubMed.
- N. Vukmirović and L. Wang, Nano Lett., 2009, 9, 3996–4000 CrossRef PubMed.
- D. P. McMahon and A. Troisi, Chem. Phys. Lett., 2009, 480, 210–214 CrossRef CAS.
- C. Wu, B. Bull, C. Szymanski, K. Christensen and J. McNeill, ACS Nano, 2008, 2, 2415–2423 CrossRef CAS PubMed.
- C. E. Halkyard, M. E. Rampey, L. Kloppenburg, S. L. Studer-Martinez and U. H. F. Bunz, Macromolecules, 1998, 31, 8655–8659 CrossRef CAS.
- D. Tuncel and H. V. Demir, Nanoscale, 2010, 2, 484–494 RSC.
- W. L. Jorgensen, J. D. Madura and C. J. Swenson, J. Am. Chem. Soc., 1984, 106, 6638–6646 CrossRef CAS.
- W. L. Jorgensen, D. S. Maxwell and J. Tirado-Rives, J. Am. Chem. Soc., 1996, 118, 11225–11236 CrossRef CAS.
- E. K. Watkins and W. L. Jorgensen, J. Phys. Chem. A, 2001, 105, 4118–4125 CrossRef CAS.
- D. Van Der Spoel, E. Lindahl, B. Hess, G. Groenhof, A. E. Mark and H. J. C. Berendsen, J. Comput. Chem., 2005, 26, 1701–1718 CrossRef CAS PubMed.
- H. Sun, S. J. Mumby, J. R. Maple and A. T. Hagler, J. Am. Chem. Soc., 1994, 116, 2978–2987 CrossRef CAS.
- H. Sun, Macromolecules, 1995, 28, 701–712 CrossRef CAS.
- S. Maskey, N. C. Osti, D. Perahia and G. S. Grest, ACS Macro Lett., 2013, 2, 700–704 CrossRef CAS.
- S. Maskey, F. Pierce, D. Perahia and G. S. Grest, J. Chem. Phys., 2011, 134, 244906 CrossRef PubMed.
- G. S. Grest and K. Kremer, Phys. Rev. A: At., Mol., Opt. Phys., 1986, 33, 3628–3631 CrossRef CAS.
- T. Darden, D. York and L. Pedersen, J. Chem. Phys., 1993, 98, 10089–10092 CrossRef CAS.
- U. Essmann, L. Perera, M. L. Berkowitz, T. Darden, H. Lee and L. G. Pedersen, J. Chem. Phys., 1995, 103, 8577–8593 CrossRef CAS.
- G. A. Cisneros, M. Karttunen, P. Ren and C. Sagui, Chem. Rev., 2014, 114, 779–814 CrossRef CAS PubMed.
- A. D. Becke, J. Chem. Phys., 1993, 98, 5648–5652 CrossRef CAS.
- C. Lee, W. Yang and R. G. Parr, Phys. Rev. B: Condens. Matter Mater. Phys., 1988, 37, 785–789 CrossRef CAS.
- S. H. Vosko, L. Wilk and M. Nusair, Can. J. Phys., 1980, 58, 1200–1211 CrossRef CAS.
- P. J. Stephens, F. J. Devlin, C. F. Chabalowski and M. J. Frisch, J. Phys. Chem., 1994, 98, 11623–11627 CrossRef CAS.
- F. Weigend and R. Ahlrichs, Phys. Chem. Chem. Phys., 2005, 7, 3297 RSC.
- F. Neese, Wiley Interdiscip. Rev.: Comput. Mol. Sci., 2012, 2, 73–78 CrossRef CAS.
- S. Grimme, J. Comput. Chem., 2006, 27, 1787–1799 CrossRef CAS PubMed.
- L. Hedin and S. Lundqvist, Solid State Physics: Advances in Research and Application, Academix Press, New York, 1969, vol. 23, pp. 1–181 Search PubMed.
- W. Kohn and L. J. Sham, Phys. Rev., 1965, 140, A1133–A1138 CrossRef.
- Y. Ma, M. Rohlfing and C. Molteni, J. Chem. Theory Comput., 2010, 6, 257–265 CrossRef CAS PubMed.
- B. Baumeier, D. Andrienko, Y. Ma and M. Rohlfing, J. Chem. Theory Comput., 2012, 8, 997–1002 CrossRef CAS PubMed.
- B. Baumeier, D. Andrienko and M. Rohlfing, J. Chem. Theory Comput., 2012, 8, 2790–2795 CrossRef CAS PubMed.
- G. Onida, L. Reining and A. Rubio, Rev. Mod. Phys., 2002, 74, 601–659 CrossRef CAS.
- X. Blase and C. Attaccalite, Appl. Phys. Lett., 2011, 99, 171909 CrossRef.
- C. Faber, I. Duchemin, T. Deutsch, C. Attaccalite, V. Olevano and X. Blase, J. Mater. Sci., 2012, 1–10 CAS.
- A. Bergner, M. Dolg, W. Küchle, H. Stoll and H. Preuss, Mol. Phys., 1993, 80, 1431–1441 CrossRef CAS.
- R. Krishnan, J. S. Binkley, R. Seeger and J. A. Pople, J. Chem. Phys., 1980, 72, 650–654 CrossRef CAS.
- Y. Ma, M. Rohlfing and C. Molteni, Phys. Rev. B: Condens. Matter Mater. Phys., 2009, 80, 241405 CrossRef.
- V. Rühle, A. Lukyanov, F. May, M. Schrader, T. Vehoff, J. Kirkpatrick, B. Baumeier and D. Andrienko, J. Chem. Theory Comput., 2011, 7, 3335–3345 CrossRef PubMed.
- Available at http://www.votca.org.
- W. Humphrey, A. Dalke and K. Schulten, J. Mol. Graphics, 1996, 14, 33–38 CrossRef CAS PubMed.
- Jmol: an open-source Java viewer for chemical structures in 3D, http://www.jmol.org/.
- U. H. F. Bunz, Macromol. Rapid Commun., 2009, 30, 772–805 CrossRef CAS PubMed.
- T. Miteva, L. Palmer, L. Kloppenburg, D. Neher and U. H. F. Bunz, Macromolecules, 2000, 33, 652–654 CrossRef CAS.
- J. K. Young and J. S. Moore, Modern Acetylene Chemistry, Wiley-VCH Verlag GmbH, Weinheim, Germany, 1995, pp. 415–442 Search PubMed.
- S. Toyota, Chem. Rev., 2010, 110, 5398–5424 CrossRef CAS PubMed.
- K. Okuyama, T. Hasegawa, M. Ito and N. Mikami, J. Phys. Chem., 1984, 88, 1711–1716 CrossRef CAS.
- J.-P. Ryckaert and A. Bellemans, Faraday Discuss. Chem. Soc., 1978, 66, 95–106 RSC.
- B. Bagheri, M. Karttunen and B. Baumeier, Eur. Phys. J.: Spec. Top., 2016, DOI:10.1140/epjst/e2016-60144-5.
- The lack of analytical forces for the GW-BSE makes the optimization of the excited state geometries of molecules of the size of 10-PPE practically impossible. Therefore, the geometry of the first excited state is optimized using time-dependent DFT (TDDFT), with the same functional and basis set as in the ground state. Numerical gradients of DFT/GW-BSE total energies based on the TDDFT optimized structure yield very small forces.
Footnote |
| † Electronic supplementary information (ESI) available. See DOI: 10.1039/c6cp02944b |
| This journal is © the Owner Societies 2016 |