
 Open Access Article
 This Open Access Article is licensed under a Creative Commons Attribution-Non Commercial 3.0 Unported Licence
Photoisomerization of azobenzenes isolated in cryogenic matrices†
Luís
Duarte
*a,
Leonid
Khriachtchev
a,
Rui
Fausto
b and
Igor
Reva
*b
aDepartment of Chemistry, University of Helsinki, P.O. Box 55, FI-00014 Helsinki, Finland. E-mail: luis.duarte@helsinki.fi
bDepartment of Chemistry, University of Coimbra, P-3004-535 Coimbra, Portugal. E-mail: reva@qui.uc.pt
First published on 25th May 2016
Abstract
2,2′-Dihydroxyazobenzene (DAB), 2,2′-azotoluene (AT) and azobenzene (AB) were isolated in argon and xenon matrices and their molecular structures and photochemical transformations were characterized by infrared spectroscopy and theoretical calculations. All these compounds can adopt the E and Z isomeric forms around the central CNNC moiety, which can be enriched by several conformational and tautomeric modifications for DAB and AT. A number of DAB and AT isomeric forms were identified for the first time. For DAB, the E azo-enol isomer with two intramolecular six-membered quasi-rings formed via OH⋯N hydrogen bonds was found after deposition. Irradiation with UV light generated a different E azo-enol form with two intramolecular H-bonded five-membered quasi-rings. Phototransformation was shown to be reversible and the forms could be interconverted by irradiation at different wavelengths. The isomerization between these two forms constitutes a direct experimental observation of an E → E isomerization in azobenzene-type molecules. Further irradiation generated a form(s) bearing both OH and NH groups. For AT, two E isomers with the CH3 groups forming five-membered and five/six-membered quasi-rings with the azo group were observed in the as-deposited matrices. Irradiation of AT with UV light generated a Z form that can be converted back to the E form at different irradiation wavelengths. E-AB was deposited in a xenon matrix and both E → Z and Z → E phototransformations were observed (contrary to what was previously reported in an argon matrix where only the Z → E conversion occurred). AB photoisomerization becomes more pronounced at elevated temperatures, thus indicating that the matrix effects responsible for hindering the AB photoisomerization are essentially due to steric restrictions. The different photoisomerization channels observed for these compounds are discussed in terms of a small-amplitude pedal motion.
Introduction
The reversible isomerization of azobenzenes between the E and Z forms (or trans and cis) with different physicochemical properties has been successfully exploited in a wide range of applications. In industry, they are commonly used as dyes in the production of optical and color-changing materials such as sunglasses, textiles, paints, and cosmetics.1,2 In addition, the azobenzenes are also frequently employed to give light-induced functionality to biomolecules,3 in the development of photoactive drug delivery systems,4,5 molecular switches,6,7 photoresponsive crystalline materials,8–11 and promising solar thermal fuels.12–15The photoisomerization of azobenzenes involves excitation in the UV-Vis range to either the S1 or S2 state.16–19 The process may be more complex, and the involvement of other states has also been suggested.20–22 The mechanism of the photoisomerization of azobenzene and its derivatives has been addressed in a great number of theoretical and experimental studies and several isomerization pathways have been proposed (rotation, inversion, concerted inversion, inversion-assisted rotation, and pedal motion).23–32 However, at present, the mechanism of this process is not consensual and continues to be a challenge.
The photoisomerization of azobenzenes in condensed phases or other confined environments has been shown to be particularly important for their applications. For example, Kucharski et al. synthesized azobenzene-functionalized carbon nanotubes and showed that the enforcement of conformational restriction and steric strain resulted in enhanced energy-storage capabilities.15 Wöll and co-workers integrated azobenzene molecules into metal–organic frameworks and investigated the photoisomerization and barrier for thermal isomerization.9,33 Benassi et al. studied the photodynamics of thiolated azobenzenes chemisorbed on a gold surface and evaluated the surface effects on the photoisomerization.34 Understanding the details of the photoisomerization of azobenzenes under constraints may give valuable information for both fundamental and applied research and contribute to an even more successful design of photofunctional systems.
In the present work, we report on the photoisomerization of three azobenzenes, 2,2′-dihydroxyazobenzene (DAB), 2,2′-azotoluene (AT) and azobenzene (AB), isolated in rare-gas matrices. All of them bear two equal substituents R, in two equivalent-by-symmetry positions with respect to the central N![[double bond, length as m-dash]](https://www.rsc.org/images/entities/char_e001.gif) N double bond (Scheme 1). Due to this substitution pattern, the highest possible symmetry of each molecule is C2h. As shown below, the most stable isomeric forms in each compound are the C2h structures, and due to symmetry considerations, a half of the vibrational modes of each molecule are infrared-inactive. This simplifies the analysis of the vibrational spectra. Furthermore, unlike in AB where R = H, the substitution pattern in DAB and AT makes their aromatic rings asymmetric with respect to the internal rotation around the CN bonds. This renders three different E isomers in DAB and AT (Scheme 1a), which are indistinguishable in AB.
N double bond (Scheme 1). Due to this substitution pattern, the highest possible symmetry of each molecule is C2h. As shown below, the most stable isomeric forms in each compound are the C2h structures, and due to symmetry considerations, a half of the vibrational modes of each molecule are infrared-inactive. This simplifies the analysis of the vibrational spectra. Furthermore, unlike in AB where R = H, the substitution pattern in DAB and AT makes their aromatic rings asymmetric with respect to the internal rotation around the CN bonds. This renders three different E isomers in DAB and AT (Scheme 1a), which are indistinguishable in AB.
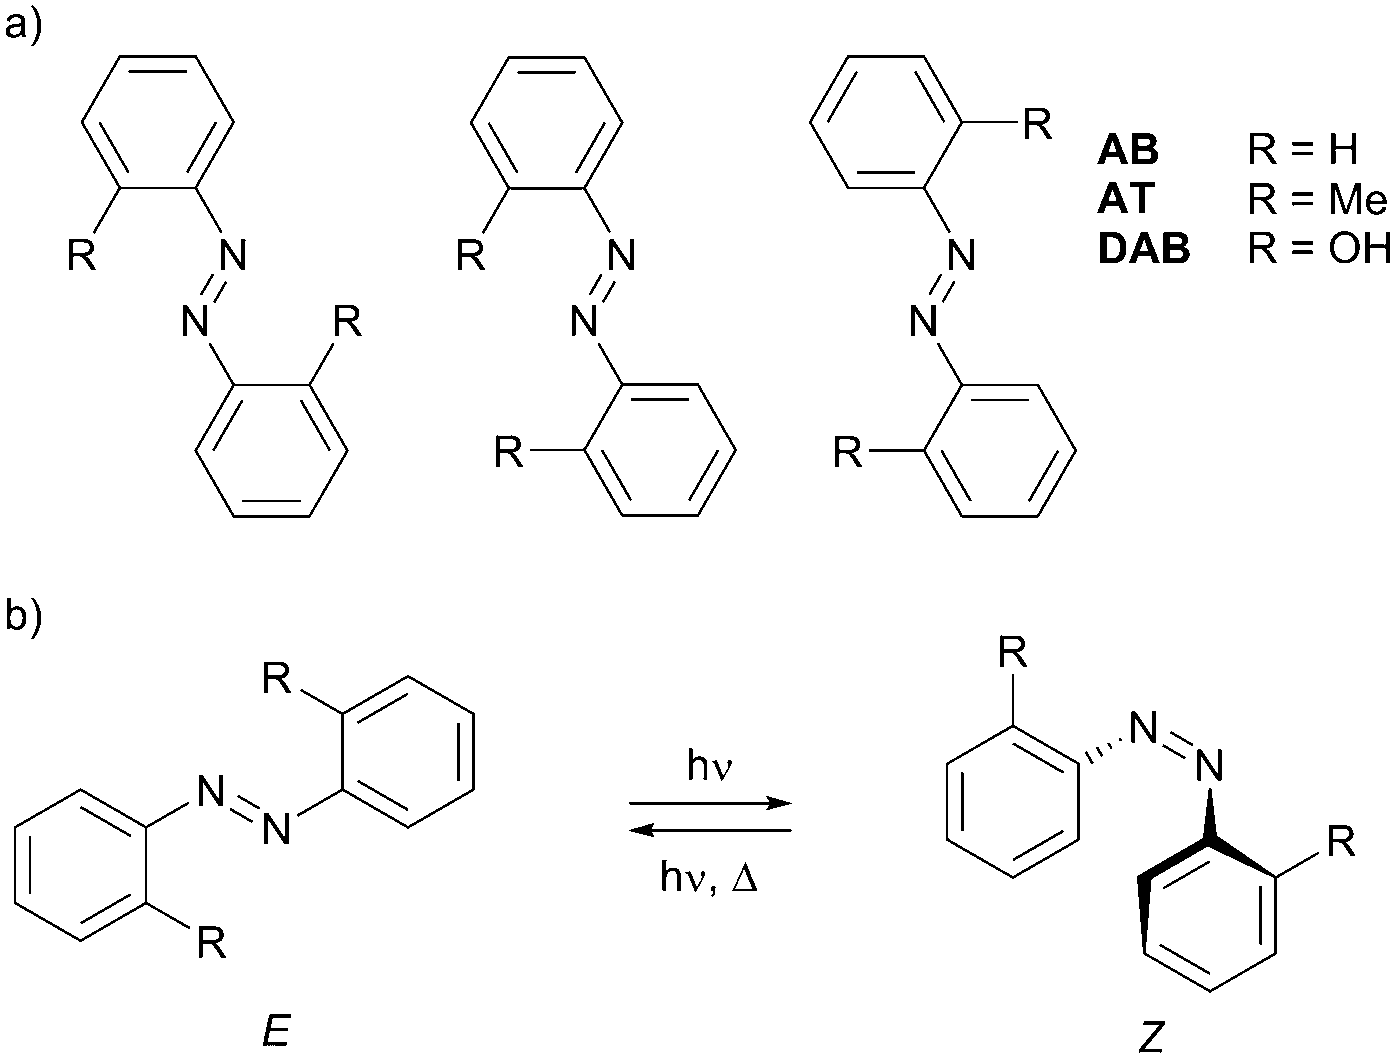 | ||
| Scheme 1 Structures of AB, AT, and DAB azobenzenes studied in this work. (a) Three different E structures in AT and DAB, rendered by substituents R. (b) E–Z photoisomerization of azobenzenes. | ||
Introducing substituents R ≠ H permits the studies of the E–E isomerizations in DAB and AT, reactions akin to the E–E self-exchange reactions in AB where the reactant and the product are identical. These so-called narcissistic reactions have been previously reported for porphycenes.35,36 In the present work, the possibility of such reactions in AB will be tested on its analogues DAB and AT. Besides that, we discuss the effects of different substituents and spatial confinement of matrix-isolated azobenzenes on their E–Z photoisomerization in solids (Scheme 1b).
Materials and methods
Experimental details
Commercial AB (Fluka, purity 98%), DAB (Sigma-Aldrich, purity 97%), and AT (Sigma-Aldrich, 98%) were placed in a glass tube connected to the vacuum chamber of the cryostat through a shutoff valve. The compound vapors were deposited with a large excess of the matrix gas (argon N60 or xenon N48, Air Liquide) onto a CsI substrate cooled using a closed-cycle helium refrigerator (APD Cryogenics DE-202A). The deposition temperature was 15 and 30 K for argon and xenon matrices, respectively. The infrared spectra were recorded in the 4000–400 cm−1 range with 0.5 cm−1 resolution using a Nicolet 6700 FTIR spectrometer equipped with DTGS and MCT-B detectors and a Ge/KBr beam splitter. The matrices were irradiated through a quartz window of the cryostat using tunable narrowband (0.2 cm−1 spectral width) light provided by a Spectra Physics Quanta-Ray MOPO-SL optical parametric oscillator (OPO) pumped with a pulsed Nd:YAG laser (repetition rate = 10 Hz, duration ∼10 ns). In the visible range (440–600 nm), the signal beam of the OPO was used (pulse energy of ∼30–40 mJ). In the UV range (230–440 nm), the frequency-doubled signal or idler beam was used (pulse energy of ∼3 mJ). The selection of the irradiation wavelengths was guided by the absorption spectra of the compounds in solution (Fig. S2, ESI†).Computational details
The quantum chemical calculations were performed using the Gaussian 09 program package, and the functionals (M06-2X and B3LYP) and the basis set (cc-pVTZ) were employed as implemented in the program.37 The equilibrium geometries for the molecules in vacuum were optimized using the default Berny optimization algorithm.38 The geometry optimizations were followed by harmonic frequency calculations at the same level of theory. No imaginary frequencies were found. The harmonic vibrational frequencies above and below 2000 cm−1 were scaled by factors of 0.95 and 0.97, respectively, to correct them for the basis set limitations and the anharmonicity effects. The theoretical infrared spectra were simulated using Lorentzian profiles centered at the calculated frequencies and with the full width at half maximum (FWHM) of 2 cm−1. Unless stated otherwise, the maxima of these profiles correspond to the calculated infrared intensities. Vertical excitation energies of the low-energy electronic excited states were calculated using the time-dependent density functional theory (TD-DFT).39 The results of these calculations are provided in Table S4 of the ESI.† The theoretical UV-Vis spectra were simulated using Gaussian profiles centered at the calculated transition wavelengths with the FWHM of 0.4 eV, as described elsewhere.40,41 The simulated spectra are shown in Fig. S3 of the ESI.†Results
Dihydroxyazobenzene (DAB)
After taking into account all tautomeric possibilities, the calculations predict 24 minima on the ground potential energy surface of DAB. Eleven minima correspond to the DOH conformers, nine minima to the NHOH forms, and the remaining four minima to the DNH conformers. The optimized geometries and relative energies of the DAB isomers most relevant for the present discussion are shown in Fig. 1 and Table 1, respectively. All DAB isomers and their energies are given in the ESI† (Fig. S1 and Table S1).
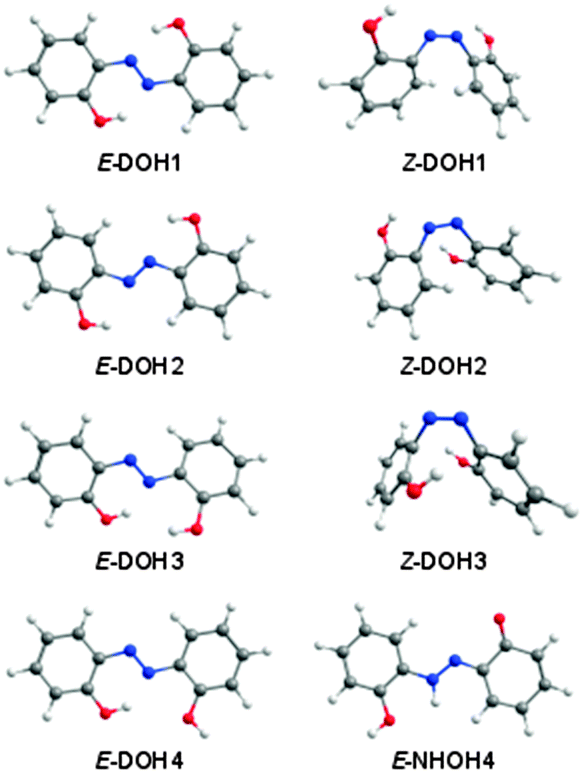 | ||
| Fig. 1 Structures of selected DOH and NHOH isomeric forms of 2,2′-dihydroxyazobenzene calculated at the M06-2X/cc-pVTZ level of theory.42 | ||
| DAB | B3LYP | M06-2X | ||
|---|---|---|---|---|
| ΔEZPVE | ΔEGibbs | ΔEZPVE | ΔEGibbs | |
| a ΔEZPVE – relative energy including the zero-point vibrational energy correction. ΔEGibbs – relative energy including a thermal correction to the Gibbs free energy at 298.15 K. The calculations were performed with the cc-pVTZ basis set. | ||||
| E-DOH1 | 0.00 | 0.00 | 0.00 | 0.00 |
| E-DOH2 | 23.97 | 16.35 | 16.86 | 12.23 |
| E-DOH3 | 22.86 | 19.91 | 17.73 | 14.57 |
| E-DOH4 | 29.00 | 25.07 | 22.64 | 18.18 |
| Z-DOH1 | 89.93 | 87.26 | 76.17 | 74.75 |
| Z-DOH2 | 105.60 | 98.88 | 84.85 | 80.41 |
| Z-DOH3 | 123.02 | 120.47 | 96.84 | 93.46 |
| E-NHOH4 | 95.13 | 88.61 | 100.32 | 93.66 |
According to the calculations, most of the conformers of the azo-enol type (DOH) are lower in energy than their tautomeric counterparts (DNH and NHOH; see Table S1, ESI†). The most stable isomer of DAB is the planar E-DOH1 form (C2h symmetry), bearing two six-membered quasi-rings stabilized by intramolecular OH⋯N interactions. The azo-enol isomers with two intramolecular H-bonded five-membered rings (E-DOH2) and five/six-membered rings (E-DOH3) are found to be 16.9 and 17.7 kJ mol−1 higher in energy than E-DOH1 (M06-2X/cc-pVTZ values). In E-DOH4, one of the six-membered rings is maintained but one of the hydroxyl groups is rotated by 180 degrees and points away from the azo group. Its relative energy is 22.6 kJ mol−1. The Z-DOH1, Z-DOH2, and Z-DOH3 forms have the aromatic rings located in close geometrical proximity and the CNNC dihedral angles of 10.1, 6.3, and 3.8 degrees, respectively. These structures are energetically less favorable by at least 75 kJ mol−1 (see Table 1).
The relative population of E-DOH1 at room temperature, estimated from the calculated Gibbs free energy at 298.15 K and the Boltzmann distribution (>98%), suggests that this form gives the major contribution to the gas-phase equilibrium and should be dominant in the deposited matrices. The expected populations of the E-DOH2, E-DOH3, and E-DOH4 forms in the gas phase are below 1%. In agreement with this estimate, only the signature of the most stable isomer, E-DOH1, was found in the spectra of deposited matrices.
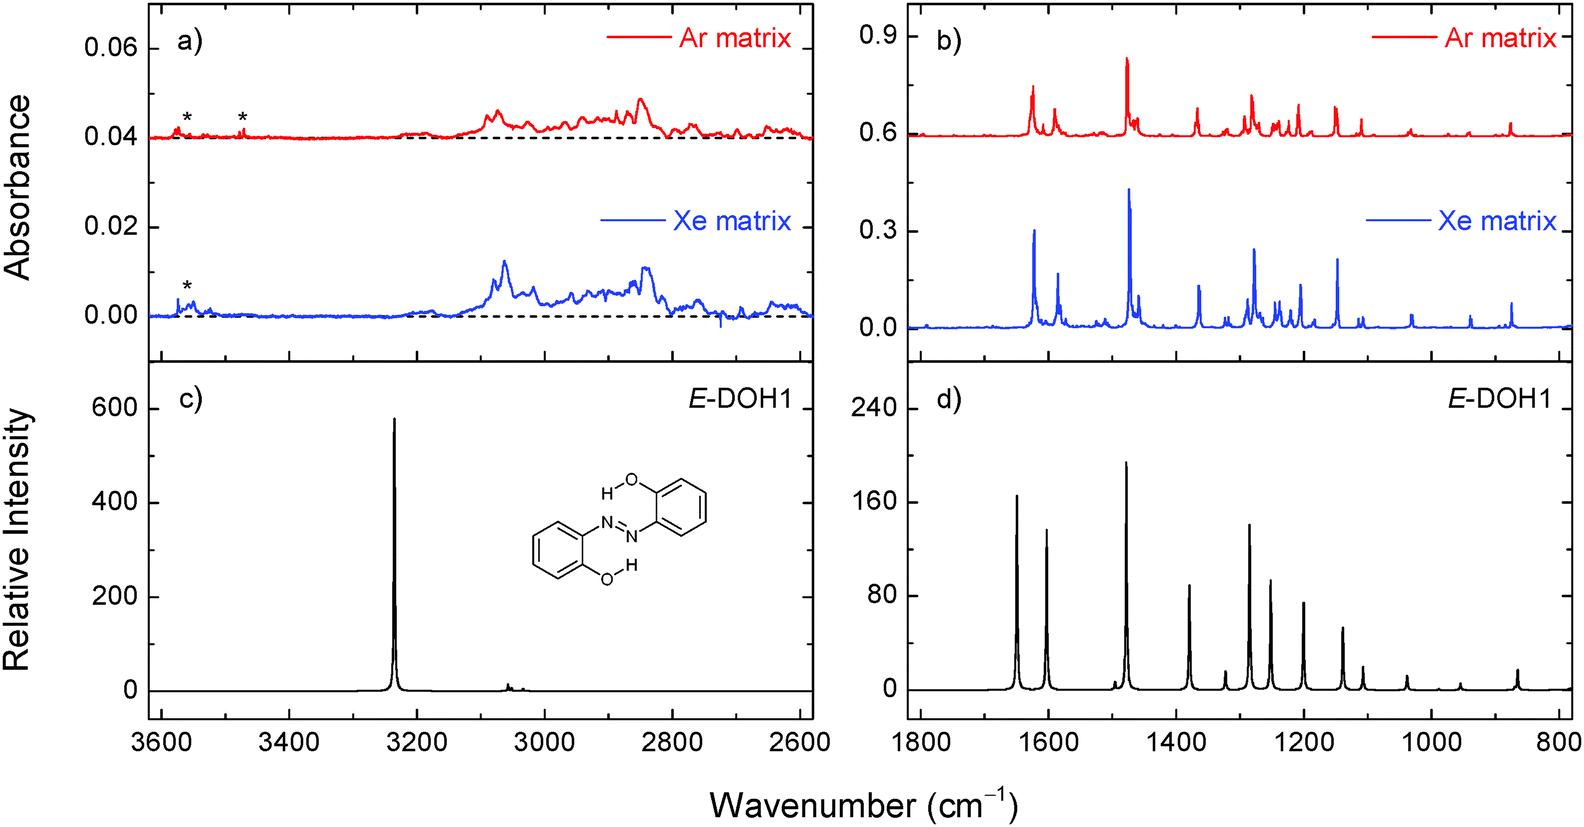 | ||
| Fig. 2 Selected regions of the experimental infrared spectra of 2,2′-dihydroxyazobenzene in xenon (30 K) and argon (15 K) matrices (panels a and b) and the theoretical spectrum of E-DOH1 calculated at the M06-2X/cc-pVTZ level of theory (panels c and d). The asterisks indicate the bands due to impurities. | ||
At higher frequencies, the appearance of a broad absorption feature in the 3200–2700 cm−1 range with a large integrated intensity and the absence of the absorption peak at around 3600 cm−1 (due to a free OH group)43,44 indicate that the OH groups in DAB are involved in strong intramolecular OH⋯N hydrogen bonds. Similar observations were found for another aromatic azo compound with a strong intramolecular hydrogen bond isolated in noble-gas matrices.45 Other characteristic absorptions and tentative band assignments are given in Table 2 and Table S3 (ESI†). The experimental bands observed in argon and xenon matrices are close to each other. It follows that the matrix effect on the vibrational frequencies is not large and the deviations between the calculated and experimental frequencies are mainly due to the limitations of the theory. In our analysis, we use mainly spectral shifts instead of absolute band positions.
| Ar (15 K) | Xe (30 K) | Calculated | |||
|---|---|---|---|---|---|
| ω | ω | ω | I | Sym. | Tentative assignment |
| a The strongest components of split bands are given in bold; M06-2X/cc-pVTZ wavenumbers and infrared intensities (I, in km mol−1) are also given. The calculated wavenumbers are scaled by 0.97. ν, stretching; δ, in-plane-bending; γ, out-of-plane bending; τ, torsion. | |||||
| 1625.7, 1623.6 | 1622.7, 1622.1 | 1649.1 | 166.7 | B u | ν(CC) + δ(CH) + δ(OH) |
| 1589.7, 1584.4 | 1585.0, 1581.2 | 1602.5 | 137.6 | B u | ν(CC) + δ(OH) + δ(CH) |
| 1518.0 | 1511.1 | 1495.4 | 6.4 | B u | δ(CH) + δ(OH) + ν(CC) |
| 1477.2, 1476.0 | 1473.3, 1471.4 | 1477.8 | 194.7 | B u | δ(CH) + ν(CO) + ν(CC) |
| 1370.2, 1368.9, 1366.9, 1364.4 | 1364.5, 1362.6 | 1379.1 | 89.2 | B u | δ(OH) + δ(CH) |
| 1326.7, 1322.8, 1320.6, 1319.8 | 1323.6, 1322.3, 1318.0, 1314.6 | 1322.6 | 16.1 | B u | ν(CC) + ν(CO) + δ(CH) |
| 1282.1, 1280.7 | 1277.8, 1277.0 | 1284.9 | 140.9 | B u | ν(CO) + ν(CC) |
| 1249.9, 1247.8, 1245.3, 1244.3, 1240.9, 1239.2 | 1245.4, 1244.2, 1240.9, 1239.4, 1238.0, 1236.7 | 1252.0 | 93.6 | B u | ν(CN) + δ(CH) |
| 1210.2, 1208.0 | 1205.5, 1204.3 | 1200.5 | 74.9 | B u | δ(CH) + ν(CN) |
| 1151.6, 1149.3, 1147.3 | 1147.5 | 1138.9 | 53.7 | B u | δ(CH) |
| 1112.6, 1109.8 | 1107.9, 1106.3 | 1107.3 | 19.7 | B u | δ(CH) + ν(CC) |
| 1036.7, 1034.7, 1032.7 | 1032.1, 1030.9, 1029.8 | 1038.4 | 12.3 | B u | δ(CH) + ν(CC) |
| 943.9, 943.0, 941.6, 940.7 | 939.8, 937.8 | 954.8 | 5.4 | A u | γ(CH) |
| 876.5, 876.1, 874.0, 871.5 | 875.0, 874.0, 871.3, 868.9 | 865.4 | 17.1 | B u | δ(ring) + ν(CN) |
| 770.0, 767.7 | 765.5, 762.9 | 770.3 | 75.3 | A u | γ(CH) + γ(CN) |
| 762.8, 762.1, 760.8 | 760.6, 758.5, 757.3 | 754.7 | 157.7 | A u | γ(CH) + τ(OH) |
| 752.2, 744.5 | 747.5, 742.9, 741.3 | 733.0 | 42.2 | A u | τ(OH) + γ(CH) |
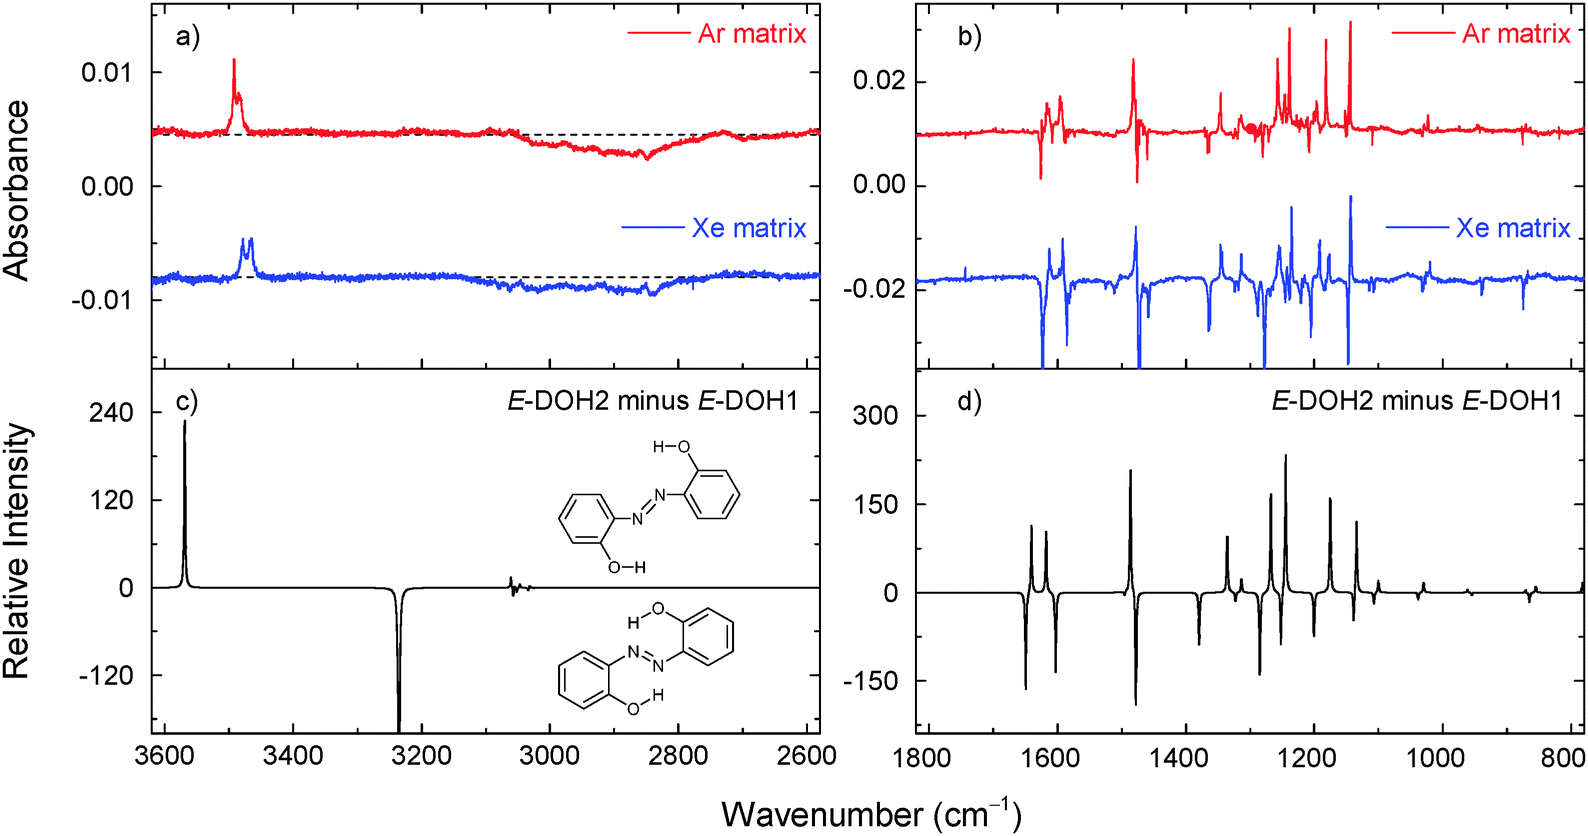 | ||
| Fig. 3 Changes in the experimental infrared spectra of 2,2′-dihydroxyazobenzene in argon (at 15 K) and xenon matrices (at 30 K) after irradiation at 420 nm for 4 and 2 min, respectively (panels a and b). The negative bands correspond to the consumed form (assigned to E-DOH1). The positive bands correspond to the photogenerated isomer (assigned to E-DOH2). The theoretical (M06-2X/cc-pVTZ) difference spectrum is simulated as “E-DOH2 minus E-DOH1” (panels c and d). | ||
Upon irradiation at 323 nm, the consumption of E-DOH1 and the production of E-DOH2 continued but a different set of bands also appeared. With successive irradiation cycles between 420 nm and 323 nm it was possible to group the new bands in one distinct set (Table S5, ESI† and Fig. 4). This set indicates the formation of at least one additional isomeric form. The bands in the 3650–3300 cm−1 region are consistent with the OH and NH stretching vibrations and suggest the presence of a form(s) bearing the OH and NH groups. After comparison with the calculated spectra, the most satisfactory agreement was found for E-NHOH4 (Fig. 1). However, this assignment is somewhat tentative and some of the other E-NHOH forms (e.g., E-NHOH3 and E-NHOH7) cannot be completely ruled out (see Fig. S1 and Table S2, ESI†) because their spectra are very similar. For prolonged irradiation, particularly at shorter wavelengths (250 nm), the appearance of bands in the region at around 2145–2100 cm−1 and at 1681 cm−1 suggests a partial decomposition of DAB.44
 | ||
| Fig. 4 Changes in the experimental infrared spectrum of 2,2′-dihydroxyazobenzene in a xenon matrix at 30 K induced by irradiation at 420 nm (8 min) followed by irradiation at 323 nm (7 min; panel a). The negative absorptions correspond to E-DOH2. The positive peaks correspond to the emerging bands of a new isomeric form(s), tentatively assigned to E-NHOH4. The theoretical (M06-2X/cc-pVTZ) difference spectrum is simulated as “E-NHOH4 minus E-DOH2” (panel b). | ||
Azotoluene (AT)
N bond (E and Z forms). Seven energy minima were computationally found for this compound, four E forms and three Z forms. The optimized geometries and relative energies of the AT isomers are shown in Fig. 5 and Table 3.
 | ||
| Fig. 5 Isomers of 2,2′-azotoluene calculated at the M06-2X/cc-pVTZ level of theory.42 | ||
| AT | B3LYP | M06-2X | ||
|---|---|---|---|---|
| ΔEZPVE | ΔEGibbs | ΔEZPVE | ΔEGibbs | |
| a ΔEZPVE – relative energy including the zero-point vibrational energy correction. ΔEGibbs – relative energy including a thermal correction to the Gibbs free energy at 298.15 K. The calculations were performed with the cc-pVTZ basis set. b Not an energy minimum at this level. | ||||
| E-AT1 | 0.00 | 0.00 | 0.00 | 0.00 |
| E-AT2 | 9.67 | 9.74 | 6.80 | 3.98 |
| E-AT3 | 19.63 | 23.22 | 17.19 | 18.99 |
| E-AT4 | 18.37 | 17.72 | ||
| Z-AT1 | 54.82 | 58.31 | 43.14 | 43.87 |
| Z-AT2 | 62.78 | 65.61 | 45.17 | 46.63 |
| Z-AT3 | 75.10 | 78.34 | 52.43 | 56.52 |
The two methyl groups in AT have net repulsive interactions with the NN fragment. It is different from DAB, where the two OH substituents lead to stabilizing interactions with the NN fragment, and the most stable DAB isomer has two six-membered quasi-rings. The most stable isomeric form of AT, E-AT1, has C2h symmetry and the geometry, in which the methyl groups form two five-membered quasi-rings with the azo moiety. The second most stable form, E-AT2, is ∼7 kJ mol−1 higher in energy and has Cs symmetry. As compared to E-AT1, one of the E-AT2 CCNN dihedrals is rotated by 180 degrees and both methyl groups are on the same side of the azo group, forming five-membered and six-membered quasi-rings. The higher energy E forms, E-AT3 (C2 symmetry) and E-AT4 (Ci symmetry), have two six-membered quasi-rings. Due to the increased steric repulsion between the CH3 groups and the nitrogen atoms, the aromatic rings are not in the same plane and the CCNN dihedrals are ∼27 and ∼21 degrees in E-AT3 and E-AT4, respectively. In the Z-AT forms, the aromatic rings are located in close geometrical proximity, creating less energetically favorable structures with relative energies ≥43 kJ mol−1 (Table 3). The CNNC dihedral angle is 8.9, 5.7, and 2.7 degrees in Z-AT1, Z-AT2, and Z-AT3, respectively.
 | ||
| Fig. 6 Selected region of the experimental infrared spectrum of 2,2′-azotoluene in an argon matrix at 15 K (panel a) and the calculated spectra of E-AT1 and E-AT2 at the M06-2X/cc-pVTZ level of theory (panel b). Arrows indicate the bands of E-AT2. The asterisk indicates a band due to traces of matrix-isolated monomeric ethanol impurity. The calculated intensities of E-AT1 and E-AT2 are scaled by 0.71 and 0.29, respectively, according to the expected gas-phase populations. | ||
| Ar (15 K) | Xe (30 K) | Calculated | |||
|---|---|---|---|---|---|
| ω | ω | ω | I | Sym. | Tentative assignment |
| a Strongest components of split bands are given in bold; M06-2X/cc-pVTZ wavenumbers and infrared intensities (I, in km mol−1) are also given. Calculated wavenumbers are scaled by 0.97. ν, stretching; δ, in-plane-bending; γ, out-of-plane bending; τ, torsion. | |||||
| 1602.6 | 1604.6, 1599.9 | 1631.8 | 14.3 | B u | ν(CC) + δ(CH) |
| 1492.4, 1490.4, 1483.3 | 1490.2, 1487.9, 1481.6, 1480.1 | 1493.7 | 25.2 | B u | δ(CH) + ν(CC) |
| 1464.6 | 1461.3 | 1467.2 | 27.4 | B u | δ(CH) + δ(CH3) + ν(CC) |
| 1438.3 | 1433.5 | 1443.4 | 14.8 | A u | δ(CH3) |
| 1429.6 | 1424.8 | 1437.2 | 15.4 | B u | δ(CH3) + δ(CH) |
| 1380.4 | 1376.6 | 1378.8 | 3.9 | B u | δ(CH3) + ν(C–CH3) |
| 1304.4 | 1306.8, 1304.5 | 1303.4 | 16.0 | B u | ν(CC) + δ(CH) + δ(CH3) |
| 1276.8 | 1274.8 | 1269.5 | 7.1 | B u | δ(CH) + ν(CC) + δ(CH3) |
| 1222.5 | 1220.3 | 1232.5 | 28.1 | B u | ν(CN) + δ(CH) |
| 1195.2 | 1195.5, 1193.1, 1191.6 | 1192.9 | 8.5 | B u | ν(C–CH3) + δ(CH) + δ(ring) |
| 1152.03 | 1154.4, 1151.7, 1150.1 | 1143.3 | 22.1 | B u | δ(CH) |
| 1117.0 | 1116.5 | 1111.8 | 3.4 | B u | δ(CH) |
| 1045.6, 1042.4 | 1045.4, 1041.9 | 1048.7 | 13.2 | B u | δ(CH) + ν(CC) |
| 1037.6 | 1035.9 | 1043.0 | 5.0 | A u | γ(CH3) |
| 775.9, 773.1 | 772.4, 720.6 | 788.3 | 61.5 | A u | γ(CH) + γ(CN) |
| 722.9, 721.7, 720.8 | 721.6, 718.7 | 733.2 | 49.0 | A u | γ(CH) + γ(CH3) + τ(ring) |
The relative populations of E-AT1 and E-AT2 at room temperature, estimated from the Gibbs free energies at 298.15 K and the Boltzmann distribution, are 71% and 29% at the M06-2X level of theory. Therefore, the E-AT2 form can contribute non-negligibly to the gas phase equilibrium and appear in the deposited matrices. The E-AT2 strongest bands are predicted to be very similar to those of E-AT1 and its experimental spectral signatures are not absolutely evident. However, a close inspection of the spectrum reveals the presence of absorptions at 1302, 1280, 1218, 1158, 1118 and 510 cm−1 that are consistent with the presence of the E-AT2 form (Fig. 6). Other forms of AT are predicted to have negligible populations at room temperature.
 | ||
| Fig. 7 Changes in the experimental infrared spectrum of 2,2′-azotoluene in argon and xenon matrices after irradiation at 230 nm for 20 min (panel a). The negative bands correspond to the consumed E-AT (mainly E-AT1) form. The positive peaks correspond to the photoproduct (assigned to the Z-AT1 form). The theoretical difference spectrum (M06-2X/cc-pVTZ) is simulated as “Z-AT1 minus E-AT1” (panel b). | ||
Azobenzene (AB)
The vibrational characterization and photoisomerization of AB in an argon matrix has been recently reported by us.47 We observed that the irradiation of E-AB in the gas phase with UV-Vis broadband light provided by an Hg (Xe) arc lamp led to its partial conversion to the Z-AB isomer and trapping of both forms in an argon matrix. However, UV-Vis irradiation could only induce the Z → E conversion in an argon matrix, whereas the opposite E → Z process was not achieved. In the present work, we try to evaluate the role of the matrix in the suppression of the E → Z photoisomerization. For this purpose, we performed a series of irradiation of AB isolated in a xenon matrix at different temperatures.The experimental infrared spectra of AB in argon (15 K) and xenon (30 K) matrices are presented in Fig. 8. There is a good agreement between the experimental and calculated (M06-2X and B3LYP levels of theory) spectra for the E-AB isomeric form (Table S8, ESI†). The complete E- and Z-AB band assignments and the potential energy distributions are presented elsewhere.47 Due to a large energy barrier,26 the most stable E-AB form is the only form relevant to the gas-phase thermal equilibrium at room temperature and, consequently, only this form is observed in the deposited matrices (in the absence of light).47,48
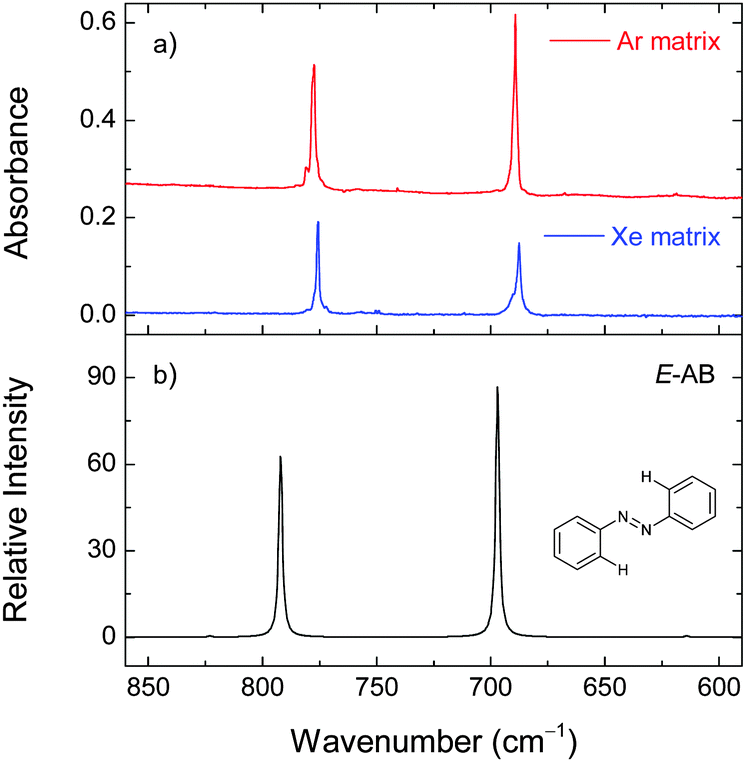 | ||
| Fig. 8 Selected region of the experimental infrared spectra of azobenzene isolated in xenon (30 K) and argon (15 K) matrices (panel a) and the calculated spectrum of E-AB at the M06-2X/cc-pVTZ level of theory (panel b). | ||
The deposited (at 30 K) xenon matrix was annealed to 60 K and irradiated at 340 nm. At this temperature the irradiation consumes the E-AB form and produces a number of new bands (e.g., at 701 and 759 cm−1) consistent with the Z-AB form. Before the next irradiation at a different temperature, the produced Z-AB form was consumed by irradiating at 420 nm. For 340 nm irradiation at lower temperatures (50, 40, and 30 K), the E → Z photoisomerization becomes less pronounced (Fig. 9). In different experiments, the deposited matrices were cooled down to 20 K and 16 K and also irradiated at 340 nm. Under these conditions, some E → Z isomerization was also observed.
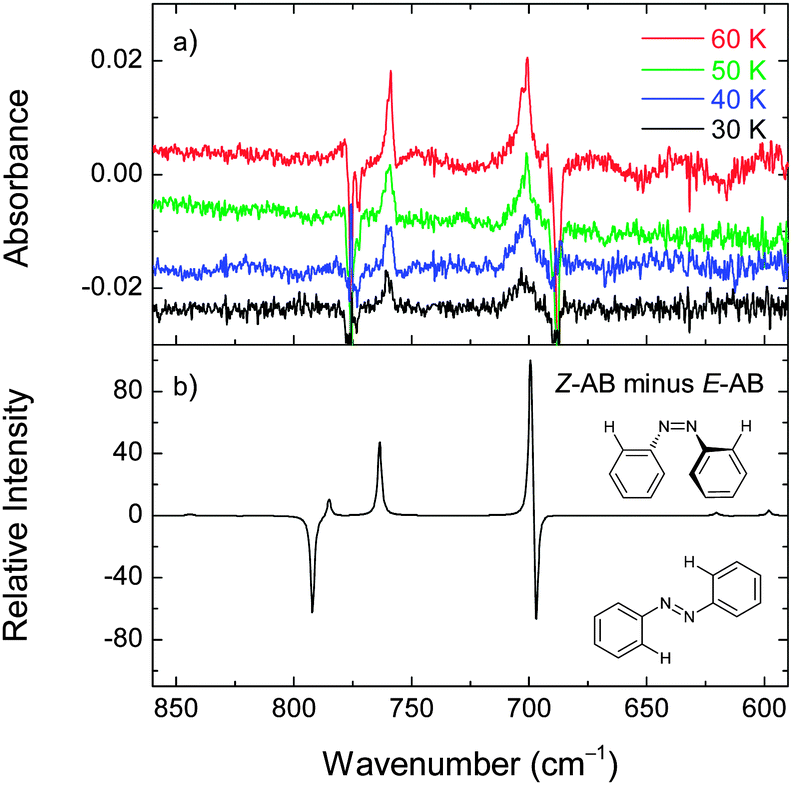 | ||
| Fig. 9 Changes in the experimental infrared spectrum of azobenzene in a xenon matrix after irradiation at 340 nm for 15 min at 30, 40, 50, and 60 K (panel a). The negative bands correspond to the consumed isomer (E-AB). The positive bands correspond to the photogenerated isomer (Z-AB). Each 340 nm irradiation was preceded by the consumption of the Z form by irradiating at 420 nm for 2 min. The calculated difference spectrum (M06-2X/cc-pVTZ) is simulated as “Z-AB minus E-AB” (panel b). | ||
Remarks on the photoisomerization process
One of the most striking findings of the present work is the isomerization (or the lack of it) observed for these azobenzenes. For DAB, no E → Z photoisomerization was found in argon and xenon matrices. The most stable form observed in the matrices after deposition, E-DOH1, has two strong intramolecular hydrogen bonds that enforce the planar structure. The presence of this structural restriction may affect the channels of the isomerization. In fact, Bandara et al. studied 2,2′-diaminoazobenzene derivatives with several intramolecular hydrogen bonds in diethylether/ethanol solutions frozen at 77 K and reported minimal to none E → Z photoisomerization.49 The photoisomerization was observed when the formation of the hydrogen bonds was prevented by the alkylation of the –NH groups. In our case, the E → Z isomerization may be also suppressed by a matrix-induced barrier resulting from the reorganization of the matrix material in order to accommodate the bent Z form (that requires a larger “3D-cage” when compared to the “2D-cage” sufficient to accommodate the planar E form).The E-DOH2 form is similarly locked in a planar configuration by two intramolecular hydrogen bonds (Fig. 1) and can be formed from E-DOH1 by three possible mechanisms: (i) pedal motion, (ii) inversion around the CNN angles, and (iii) rotation of both phenol groups around the CN bonds. In the confined matrix environment, movements involving a smaller reorganization of the matrix material, such as small-amplitude pedal motion, seem to be more plausible. The non-observation of E-DOH3 among the photoproducts indicates that rotation of the phenol groups does not occur and mechanism (iii) should not be operational. However, without further theoretical calculations involving the excited state dynamics of both forms in condensed phases, the pathway (ii) cannot be completely ruled out.
The E-DOH1 → E-DOH2 isomerization constitutes a direct experimental observation of an E → E isomerization in azobenzene-type molecules. For non-substituted azobenzene (AB), this process cannot be detected in our experiments. It becomes possible for DAB, due to the introduction of two OH substituents at the 2 and 2′ positions of the aromatic rings. The present observation also indirectly supports that similar E → E isomerizations, representing self-exchange reactions, may occur in azobenzene. These self-exchange reactions have been observed previously for porphycenes.35 In porphycenes, those reactions were detected by methods of polarized spectroscopy, due to the change in the transition moment of the system. Similarly, the self-exchange reactions in azobenzenes may be detectable experimentally by other methods using the methodology based on polarized spectroscopy or the analyses of anisotropy data.36
The observation of a NHOH-type form(s) of DAB (Fig. 4) resulting from its tautomerization is in agreement with a recent theoretical work on 2-hydroxyazobenzene. Guang et al. have employed the complete active space self-consistent field (CASSCF) and its multistate second-order perturbation (MS-CASPT2) methods to explore the photochemical mechanism of 2-hydroxyazobenzene in the two lowest excited singlet states. They have found that once the system is excited to the bright S2(1ππ*) state, the proton transfer from the azo-enol form to the keto-hydrazone form is barrierless. Along the 1ππ* relaxation path, the dark S1(1nπ*) state can be efficiently populated, but the proton transfer is inhibited due to a barrier of about 42 kJ mol−1.50
In the case of AT, the E → Z and Z → E photoisomerization occurs in argon and xenon matrices. This molecule has two bulky methyl substituents and requires a larger trapping space than the other studied azobenzenes. It is possible that this difference in the trapping morphology decreases the spatial limitations enforced by the matrices on AT in the process of its photoisomerization. Furthermore, the methyl groups lead to a relative stabilization of azotoluene Z forms (the relative energies between the most stable E and Z forms of DAB, AB, and AT are 76.17, 52.03, and 43.14 kJ mol−1, respectively), which may play a role in lowering the barrier for the isomerization process. Schweighauser et al. studied the rates of the Z → E isomerization of several alkyl-substituted azobenzene derivatives in different solvents by temperature-controlled UV-Vis spectroscopy and DFT calculations.51 They proposed that the isomerization was influenced by the attractive London dispersion interactions stabilizing the Z isomers. The non-observation of E-AT3 in our experiments (resulting from the E → E isomerization process) can also be explained by the effect of the methyl substituents. In E-AT3, the steric repulsion between the CH3 groups and the nitrogen atoms results in a distorted non-planar geometry and the E → E reaction channel (AT1 → AT3) can become less favorable compared to that leading to the E → Z photoisomerization.
For AB, the observation of the E → Z and Z → E isomerizations in a xenon matrix, in contrast to an argon matrix where only Z → E was observed,47 suggests that the matrix affects the photoisomerization process. It appears interesting to compare the present observation in matrices with the results of the recent studies. Böckmann et al. have performed nonadiabatic QM/MM molecular dynamics simulations to investigate the photoisomerization of azobenzene in the gas and liquid phases.24,52 They have found that the Z → E photoisomerization is only slightly affected by the liquid bulk environment compared to the gas phase while the E → Z process is strongly hindered in the liquid phase. The simulations have revealed that the photoisomerization mechanism is initially dominated by a small-amplitude pedal motion of the central CNNC moiety that competes in the S1 state with the movement of the aromatic rings toward planarity.53 However, due to the initial orientation of the aromatic rings in both forms, these two competing movements only favor the Z → E process. In addition, they have also found that the vertical excitation brings the Z-AB to a steeper Franck–Condon (FC) region compared to E-AB, providing a large driving force for isomerization. For E-AB, the FC region is relatively flat and the resulting forces are smaller, thus, making the E → Z photoisomerization more sensitive to environmental effects.
Despite the obvious differences between AB in the liquid phase and in solid matrices, the theoretical results discussed above are helpful for the rationalization of our experimental observations. The matrix materials used (argon and xenon) usually adopt a face centered cubic (fcc) crystal structure where small molecules can be trapped in interstitial or substitutional sites.54 In the case of larger molecules, like the ones studied in this work, multiple substitutional sites (resulting from the “removal” of several matrix atoms) usually occur. As the atomic radii increase from argon to xenon, the size of the possible trapping sites also increases, and it seems reasonable to expect that steric effects imposed by the environment on the azobenzenes are reduced in xenon matrices. This seems to be the case for AB where both E → Z and Z → E processes were observed in a xenon matrix whereas in an argon matrix only the Z → E process occurred. The increase of the AB photoisomerization efficiency at elevated temperatures is consistent with this picture.
Conclusions
Three structurally related azobenzenes, 2,2′-dihydroxyazobenzene (DAB), 2,2′-azotoluene (AT), and azobenzene (AB), were investigated by matrix-isolation infrared spectroscopy and theoretical calculations at the M06-2X (and B3LYP)/cc-pVTZ level. The spectral signatures of DAB and AT in cryogenic matrices and their light-induced transformations have been reported for the first time.For DAB, among the possible isomeric forms, only the azo-enol form E-DOH1 with two OH groups involved in strong intramolecular hydrogen bonds is found in the as-deposited argon and xenon matrices. Irradiation at 420 nm generates a different azo-enol isomeric form of DAB with two intramolecular H-bonded five-membered rings (E-DOH2). The phototransformation is reversible and irradiating at 396 nm recovers the E-DOH1 isomer, probably by a pedal motion. The E-DOH1 → E-DOH2 isomerization constitutes a direct experimental observation of an E → E isomerization in azobenzene-type molecules. After further irradiation at 323 nm, a form(s) bearing both OH and NH groups appear. No Z forms were observed after various irradiation cycles, which may be connected with the existence of the strong hydrogen bonds and/or constraints imposed by the matrices on the initial planar structure.
For AT, two E isomeric forms are found experimentally after matrix deposition. In the most stable form (E-AT1), the methyl groups form five-membered quasi-rings with the azo moiety whereas in the other form (E-AT2) both methyl groups are on the same side of the azo group forming five-membered and six-membered quasi-rings. UV irradiation at 330–230 nm partially converts the E forms into a Z form (Z-AT1). This photoisomerization is reversible and irradiation at 400 nm regenerates the E-AT1 isomer. No additional E forms are produced by light. The E → Z process may be connected to the presence of bulky methyl groups and a specific trapping morphology.
For AB in a xenon matrix, both the E → Z and Z → E isomerization processes are experimentally observed. At higher temperatures, the photoisomerization becomes more pronounced, thus indicating that the matrix effects, hindering the AB photoisomerization, are essentially due to the steric constraints imposed by the solid rigid medium. To recall, only the Z → E process was observed in the previous studies in an argon matrix.47
Our results provide valuable experimental insights into the photoisomerization process of different azobenzenes in condensed phase environments. We present a rationalization of our findings in terms of a pedal motion. However, a totally comprehensive interpretation of the matrix effects and a full explanation of the different photoisomerization channels observed for the compounds studied here is a challenge for computational chemistry and future experiments.
Acknowledgements
This work was supported by Project KUMURA of the Academy of Finland (No. 1277993). The CSC-IT Center for Science is thanked for computational resources. I. R. acknowledges the Portuguese “Fundação para a Ciência e a Tecnologia” (FCT) for the Investigador FCT grant. The research leading to these results has also received support from LASERLAB-EUROPE, grant agreement no 284464, EC's Seventh Framework Programme. The Coimbra Chemistry Centre (CQC) is supported by FCT through the project UI0313/QUI/2013, co-funded by UE. The authors thank the Advanced Computing Laboratory at University of Coimbra for providing computing resources that have contributed to the present study.Notes and references
-
Industrial Dyes: Chemistry, Properties, Applications, ed. K. Hunger, Wiley-VCH Verlag GmbH & Co. KGaA, Weinheim, FRG, 2002 Search PubMed
.
-
P. Bamfield, Chromic Phenomena, Royal Society of Chemistry, Cambridge, 2010 Search PubMed
- A. A. Beharry and G. A. Woolley, Chem. Soc. Rev., 2011, 40, 4422–4437 RSC
- J. Liu, W. Bu, L. Pan and J. Shi, Angew. Chem., Int. Ed., 2013, 52, 4375–4379 CrossRef CAS PubMed
- W. A. Velema, W. Szymanski and B. L. Feringa, J. Am. Chem. Soc., 2014, 136, 2178–2191 CrossRef CAS PubMed
- L. Osorio-Planes, M. Espelt, M. A. Pericas and P. Ballester, Chem. Sci., 2014, 5, 4260–4264 RSC
- B. K. Pathem, S. A. Claridge, Y. B. Zheng and P. S. Weiss, Annu. Rev. Phys. Chem., 2013, 64, 605–630 CrossRef CAS PubMed
- O. S. Bushuyev, T. C. Corkery, C. J. Barrett and T. Friscic, Chem. Sci., 2014, 5, 3158–3164 RSC
- Z. Wang, L. Heinke, J. Jelic, M. Cakici, M. Dommaschk, R. J. Maurer, H. Oberhofer, S. Grosjean, R. Herges, S. Bräse, K. Reuter and C. Wöll, Phys. Chem. Chem. Phys., 2015, 17, 14582–14587 RSC
- M. Baroncini, S. d'Agostino, G. Bergamini, P. Ceroni, A. Comotti, P. Sozzani, I. Bassanetti, F. Grepioni, T. M. Hernandez, S. Silvi, M. Venturi and A. Credi, Nat. Chem., 2015, 7, 634–640 CrossRef CAS PubMed
- E. Uchida, R. Azumi and Y. Norikane, Nat. Commun., 2015, 6, 7310 CrossRef CAS PubMed
- I. Tochitsky, M. R. Banghart, A. Mourot, J. Z. Yao, B. Gaub, R. H. Kramer and D. Trauner, Nat. Chem., 2012, 4, 105–111 CrossRef CAS PubMed
- E. Durgun and J. C. Grossman, J. Phys. Chem. Lett., 2013, 4, 854–860 CrossRef CAS PubMed
- K. Masutani, M.-a. Morikawa and N. Kimizuka, Chem. Commun., 2014, 50, 15803–15806 RSC
- T. J. Kucharski, N. Ferralis, A. M. Kolpak, J. O. Zheng, D. G. Nocera and J. C. Grossman, Nat. Chem., 2014, 6, 441–447 CrossRef CAS PubMed
- I. K. Lednev, T. Q. Ye, P. Matousek, M. Towrie, P. Foggi, F. V. R. Neuwahl, S. Umapathy, R. E. Hester and J. N. Moore, Chem. Phys. Lett., 1998, 290, 68–74 CrossRef CAS
- H. Satzger, S. Spörlein, C. Root, J. Wachtveitl, W. Zinth and P. Gilch, Chem. Phys. Lett., 2003, 372, 216–223 CrossRef CAS
- H. Satzger, C. Root and M. Braun, J. Phys. Chem. A, 2004, 108, 6265–6271 CrossRef CAS
- T. Fujino, S. Y. Arzhantsev and T. Tahara, J. Phys. Chem. A, 2001, 105, 8123–8129 CrossRef CAS
- T. Schultz, J. Quenneville, B. Levine, A. Toniolo, T. J. Martínez, S. Lochbrunner, M. Schmitt, J. P. Shaffer, M. Z. Zgierski and A. Stolow, J. Am. Chem. Soc., 2003, 125, 8098–8099 CrossRef CAS PubMed
- A. Cembran, F. Bernardi, M. Garavelli, L. Gagliardi and G. Orlandi, J. Am. Chem. Soc., 2004, 126, 3234–3243 CrossRef CAS PubMed
- I. Conti, M. Garavelli and G. Orlandi, J. Am. Chem. Soc., 2008, 130, 5216–5230 CrossRef CAS PubMed
- G. Tiberio, L. Muccioli, R. Berardi and C. Zannoni, ChemPhysChem, 2010, 11, 1018–1028 CrossRef CAS PubMed
- M. Böckmann, D. Marx, C. Peter, L. D. Site, K. Kremer and N. L. Doltsinis, Phys. Chem. Chem. Phys., 2011, 13, 7604–7621 RSC
- M. Pederzoli, J. Pittner, M. Barbatti and H. Lischka, J. Phys. Chem. A, 2011, 115, 11136–11143 CrossRef CAS PubMed
- H. M. D. Bandara and S. C. Burdette, Chem. Soc. Rev., 2012, 41, 1809–1825 RSC
- J. A. Gámez, O. Weingart, A. Koslowski and W. Thiel, J. Chem. Theory Comput., 2012, 8, 2352–2358 CrossRef PubMed
- Y. Harabuchi, M. Ishii, A. Nakayama, T. Noro and T. Taketsugu, J. Chem. Phys., 2013, 138, 064305 CrossRef PubMed
- A. J. Neukirch, L. C. Shamberger, E. Abad, B. J. Haycock, H. Wang, J. Ortega, O. V. Prezhdo and J. P. Lewis, J. Chem. Theory Comput., 2014, 10, 14–23 CrossRef CAS PubMed
- E. Wei-Guang Diau, J. Phys. Chem. A, 2004, 108, 950–956 CrossRef
- E. M. M. Tan, S. Amirjalayer, S. Smolarek, A. Vdovin, F. Zerbetto and W. J. Buma, Nat. Commun., 2015, 6, 5860 CrossRef PubMed
- L. Yu, C. Xu and C. Zhu, Phys. Chem. Chem. Phys., 2015, 17, 17646–17660 RSC
- X. Yu, Z. Wang, M. Buchholz, N. Fullgrabe, S. Grosjean, F. Bebensee, S. Bräse, C. Wöll and L. Heinke, Phys. Chem. Chem. Phys., 2015, 17, 22721–22725 RSC
- E. Benassi, G. Granucci, M. Persico and S. Corni, J. Phys. Chem. C, 2015, 119, 5962–5974 CAS
- H. Piwoński, A. Sokołowski, M. Kijak, S. Nonell and J. Waluk, J. Phys. Chem. Lett., 2013, 4, 3967–3971 CrossRef
- P. Ciąćka, P. Fita, A. Listkowski, M. Kijak, S. Nonell, D. Kuzuhara, H. Yamada, C. Radzewicz and J. Waluk, J. Phys. Chem. B, 2015, 119, 2292–2301 CrossRef PubMed
-
M. J. Frisch, G. W. Trucks, H. B. Schlegel, G. E. Scuseria, M. A. Robb, J. R. Cheeseman, G. Scalmani, V. Barone, B. Mennucci, G. A. Petersson, H. Nakatsuji, M. Caricato, X. Li, H. P. Hratchian, A. F. Izmaylov, J. Bloino, G. Zheng, J. L. Sonnenberg, M. Hada, M. Ehara, K. Toyota, R. Fukuda, J. Hasegawa, M. Ishida, T. Nakajima, Y. Honda, O. Kitao, H. Nakai, T. Vreven, J. A. Montgomery Jr., J. E. Peralta, F. Ogliaro, M. J. Bearpark, J. Heyd, E. N. Brothers, K. N. Kudin, V. N. Staroverov, T. Keith, R. Kobayashi, J. Normand, K. Raghavachari, A. P. Rendell, J. C. Burant, S. S. Iyengar, J. Tomasi, M. Cossi, N. Rega, N. J. Millam, M. Klene, J. E. Knox, J. B. Cross, V. Bakken, C. Adamo, J. Jaramillo, R. Gomperts, R. E. Stratmann, O. Yazyev, A. J. Austin, R. Cammi, C. Pomelli, J. W. Ochterski, R. L. Martin, K. Morokuma, V. G. Zakrzewski, G. A. Voth, P. Salvador, J. J. Dannenberg, S. Dapprich, A. D. Daniels, Ö. Farkas, J. B. Foresman, J. V. Ortiz, J. Cioslowski and D. J. Fox, Gaussian 09, Revision D.01, Gaussian, Inc., Wallingford, CT, USA, 2013 Search PubMed
- H. B. Schlegel, J. Comput. Chem., 1982, 3, 214–218 CrossRef CAS
- R. Bauernschmitt and R. Ahlrichs, Chem. Phys. Lett., 1996, 256, 454–464 CrossRef CAS
- Gaussian Tech Notes, Plotting UV/Vis Spectra from Oscillator & Dipole Strengths, http://www.gaussian.com/g_whitepap/tn_uvvisplot.htm.
- P. J. Stephens and N. Harada, Chirality, 2010, 22, 229–233 CAS
- Similar structures (with small variations in the bond lengths and angles) are found at the B3LYP/cc-pVTZ level of theory. The M06-2X/cc-pVTZ and the B3LYP/cc-pVTZ levels of theory give similar descriptions of the vibrational spectra.
- Q. Cao, N. Andrijchenko, A.-E. Ahola, A. Domanskaya, M. Räsänen, A. Ermilov, A. Nemukhin and L. Khriachtchev, J. Chem. Phys., 2012, 137, 134305 CrossRef PubMed
- B. M. Giuliano, I. Reva, L. Lapinski and R. Fausto, J. Chem. Phys., 2012, 136, 024505 CrossRef PubMed
- L. Duarte, B. M. Giuliano, I. Reva and R. Fausto, J. Phys. Chem. A, 2013, 117, 10671–10680 CrossRef CAS PubMed
- Under similar irradiation conditions (420 nm, Ar matrix, 15 K), non-substituted azobenzene (E-AB) does not change (see ref. 47); therefore, the changes occurring in DAB may be expected to occur between the different E-isomers, which are equivalent in AB but different in DAB.
- L. Duarte, R. Fausto and I. Reva, Phys. Chem. Chem. Phys., 2014, 16, 16919–16930 RSC
- The calculated difference between the energies of the Z-AB and E-AB forms is 52.03 kJ mol−1 including the ZPVE correction and 52.55 kJ mol−1 including a thermal correction to the Gibbs free energy at 298.15 K (M06-2X/cc-pVTZ). This result is in agreement with the experimental values (46 kJ mol−1; see G. S. Hartley, J. Chem. Soc., 1938, 633–642 RSC
- H. M. D. Bandara, T. R. Friss, M. M. Enriquez, W. Isley, C. Incarvito, H. A. Frank, J. Gascon and S. C. Burdette, J. Org. Chem., 2010, 4817–4827 CrossRef CAS PubMed
- P.-J. Guan, G. Cui and Q. Fang, ChemPhysChem, 2015, 16, 805–811 CrossRef CAS PubMed
- L. Schweighauser, M. A. Strauss, S. Bellotto and H. A. Wegner, Angew. Chem., Int. Ed., 2015, 54, 13436–13439 CrossRef CAS PubMed
- M. Böckmann, N. L. Doltsinis and D. Marx, J. Phys. Chem. A, 2010, 114, 745–754 CrossRef PubMed
- Other calculations also suggest the existence of pedal motion. See, for example, ref. 24, 27 and 29. Pedal motion has also been reported for azobenzene crystals: J. Harada and K. Ogawa, Chem. Soc. Rev., 2009, 38, 2244–2252 RSC
- Despite several studies on the subject, the exact morphology of solid cryogenic matrices is unknown. Additionally, due to the nature of the deposition process (which involves rapid cooling from the gas phase), the structure of the formed matrix is unlikely to be perfect and additional trapping sites resulting from lattice imperfections are also possible.
Footnote |
| † Electronic supplementary information (ESI) available: Structures of DAB isomeric forms, UV-Vis spectra, relative energies, experimental and theoretical wavenumbers and IR intensities. See DOI: 10.1039/c6cp02583h |
| This journal is © the Owner Societies 2016 |