 Open Access Article
Creative Commons Attribution 3.0 Unported Licence
Elucidation of the surface structure–selectivity relationship in ethanol electro-oxidation over platinum by density functional theory†
Tian
Sheng
*a,
Wen-Feng
Lin
b and
Shi-Gang
Sun
*a
aCollaborative Innovation Centre of Chemistry for Energy Materials, State Key Laboratory of Physical Chemistry of Solid Surfaces, Xiamen University, Xiamen, 361005, China. E-mail: tsheng@xmu.edu.cn; sgsun@xmu.edu.cn
bDepartment of Chemical Engineering, Loughborough University, Loughborough, Leicestershire LE11 3TU, UK
First published on 6th May 2016
Abstract
We have successfully built a general framework to comprehend the structure–selectivity relationship in ethanol electrooxidation on platinum by density functional theory calculations. Based on the reaction mechanisms on three basal planes and five stepped surfaces, it was found that only (110) and n(111) × (110) sites can enhance CO2 selectivity but other non-selective step sites are more beneficial to activity.
The use of direct ethanol fuel cells (DEFCs) is a hopeful future energy solution for directly converting chemical energy into electricity to replace the usage of fossil fuels. Liquid ethanol, which can be sustainably produced from biomass, has a high energy density and is stored and transported easily compared to hydrogen gas. However, there are still challenges hindering DEFCs' widespread applications commercially, in particular, the slow ethanol oxidative kinetics and formation of some poisoning intermediates. Platinum catalysts are the most common in fuel cell systems operating under strongly acidic conditions and thus, understanding of the catalytic processes on platinum catalysts is fundamentally important.1–7 The complete oxidation of ethanol to CO2 is the ideal anodic reaction in DEFCs, with 12 electron transfer (C2H5OH + 3H2O → 2CO2 + 12H+ + 12e−), but in reality, acetaldehyde (C2H5OH → CH3CHO + 2H+ + 2e−) and acetic acid (C2H5OH + H2O → CH3COOH + 4H+ + 4e−) predominate the final products, with only 2 and 4 electron transfer, respectively.1–7 The optimal catalyst for ethanol oxidation is inevitably linked with CO2 selectivity which is expected to be highly active towards cleaving the C–C bond at low potentials. Unfortunately, the production of CO2 is identified in the region of 0.5–7.5% on platinum catalysts in real systems,2 which is far below the desirable selectivity for implementation of the technology.
Understanding the structure–selectivity relationship at atomic levels is one of the fundamental scientific challenges in surface science and catalysis, which is of great significance for rationally designing catalysts. For practical catalysts with a high complexity of surface structures, what sites may actually govern the product distribution is largely unresolved due to the current technological limitation in revealing the detailed selectivity at different surface sites. Surface structural effects on ethanol electrooxidation have been studied by using single-crystal planes or nanoparticles enclosed by unique facets, and the low-coordination sites on the surface have been identified to facilitate the reaction rate.8–16 However, in terms of selectivity, the low-coordination sites do not always promote CO2 selectivity. Experiments have shown that the formation of acetic acid was also enhanced by the presence of low-coordination sites.8,11 The formation of CO2 is sensitive to the surface structure, and surfaces with terraces of (111) symmetry separated by monoatomic (110) step sites were found to be very active for C–C bond breaking since the amounts of CO/CO2 produced increase with the step density.8–12,15,16
The Brnsted–Evans–Polanyi (BEP) relationship reveals that the thermodynamics of any catalytic reaction controls the kinetics in general.17–20 Since CO2 is considerably more stable than acetaldehyde and acetic acid as the major products in ethanol electrooxidation, the thermodynamically favored CO2 production is expected to be faster kinetically than acetic acid production, but in fact the CO2 selectivity is rather low. The underlying reason behind the low CO2 selectivity is believed to be the kinetics, which may significantly determine the reaction route. Therefore, a fundamental understanding of ethanol selective oxidation reactions is significant for elucidating the structure–selectivity relationship at the atomic level, also shedding light on the selectivity concerned in many other electrocatalytic systems.
To date, a general framework for describing the structure–selectivity relationship in ethanol electrooxidation is still lacking, and many puzzles regarding the catalytic selectivity of different sites have not been rationalized yet. In particular, the following questions remain to be solved: What is the key factor determining the complete oxidative (to form CO2) or partial oxidative (to form acetic acid) pathway? Why were (110) step sites on the (111) terrace found experimentally to be excellent for considerably enhancing CO2 selectivity? Are there any possible sites having a high selectivity towards CO2? With all these questions in the mind, we present a detailed study on how platinum surface sites may affect the reaction mechanism, kinetics and selectivity for ethanol electrooxidation by using first-principles calculations. Three basal planes and five typical stepped surfaces with different atomic arrangements of reactive sites were employed for studying the structural effects. By analysing the kinetics, the significance of β-dehydrogenation in CH3CHOH* is illustrated and the structure–selectivity relationship is thus revealed.
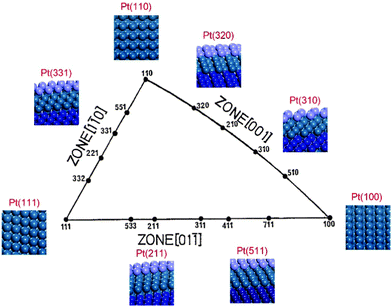
Platinum single-crystal planes defined by Miller indices provide a variety of surface structures with different atomic arrangements, conventionally by a unit stereographic triangle as shown in Fig. 1.27,28 Three vertices of the triangle represent the three basal planes, i.e., flat (111) and (100), and stepped (110). The three side-lines of the triangle represent the [01![[1 with combining macron]](https://www.rsc.org/images/entities/char_0031_0304.gif) ], [1
], [1![[1 with combining macron]](https://www.rsc.org/images/entities/char_0031_0304.gif) 0], and [001] crystallographic zones where the planes exhibit a terrace-step structure with different types of step sites. In the [001] and [01
0], and [001] crystallographic zones where the planes exhibit a terrace-step structure with different types of step sites. In the [001] and [01![[1 with combining macron]](https://www.rsc.org/images/entities/char_0031_0304.gif) ] zones, two types of step sites exist, i.e., Pt(211) vs. Pt(511) and Pt(310) vs. Pt(320), on which the local structures of the step sites are different. The reactive sites on Pt(211) and Pt(511) are n(111) × (100) and n(100) × (111) steps, and those on Pt(310) and Pt(320) are n(100) × (110) and n(110) × (100) steps. But in the [1
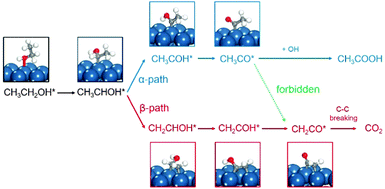
] zones, two types of step sites exist, i.e., Pt(211) vs. Pt(511) and Pt(310) vs. Pt(320), on which the local structures of the step sites are different. The reactive sites on Pt(211) and Pt(511) are n(111) × (100) and n(100) × (111) steps, and those on Pt(310) and Pt(320) are n(100) × (110) and n(110) × (100) steps. But in the [1![[1 with combining macron]](https://www.rsc.org/images/entities/char_0031_0304.gif) 0] zone, the step structures of n(111) × (110) and n(110) × (111) are the same due to the (111) symmetry, leading to only Pt(331) being used. All the calculations reported here are performed using the VASP code and the computational details can be seen in the ESI.† It is worth noting that, in the theoretical calculation, the reaction is localized on steps, hence the overall effects between terraces and steps are not considered,16,29 which is different from the experimental results obtained on single crystal planes where the catalytic reactivity includes both steps and terraces. The ethanol electrooxidation mechanism is rather complicated including over 40 possible intermediates. The reaction mechanisms of ethanol electrooxidation are calculated, respectively, on the above surfaces.20–26 All the calculated data with reaction energies and kinetic barriers are listed in Table S2 (ESI†), the energy profiles are shown in Fig. S2 (ESI†), and all the structures of optimized intermediates and transition states are shown in Fig. S3 (ESI†). Initially, the dehydrogenation of ethanol preferably starts from breaking the α-C–H bond, forming CH3CHOH*. CH3CHOH* is found to be not only able to break the α-C–H bond but also capable of breaking the β-C–H bond. Thus, during the formation of CH2CO* from which the C–C bond breaking would occur inevitably, two pathways need to be considered respectively.20–26 If the α-dehydrogenation pathway follows, the reaction route would be CH3CHOH* → CH3COH* → CH3CO* → CH2CO*; on the other hand, if the β-dehydrogenation pathway follows, the reaction path would be CH3CHOH* → CH2CHOH* → CH2COH* → CH2CO*. Fig. 2 shows the reaction mechanism for ethanol selective dehydrogenation with the structures of key intermediates on Pt(111).
0] zone, the step structures of n(111) × (110) and n(110) × (111) are the same due to the (111) symmetry, leading to only Pt(331) being used. All the calculations reported here are performed using the VASP code and the computational details can be seen in the ESI.† It is worth noting that, in the theoretical calculation, the reaction is localized on steps, hence the overall effects between terraces and steps are not considered,16,29 which is different from the experimental results obtained on single crystal planes where the catalytic reactivity includes both steps and terraces. The ethanol electrooxidation mechanism is rather complicated including over 40 possible intermediates. The reaction mechanisms of ethanol electrooxidation are calculated, respectively, on the above surfaces.20–26 All the calculated data with reaction energies and kinetic barriers are listed in Table S2 (ESI†), the energy profiles are shown in Fig. S2 (ESI†), and all the structures of optimized intermediates and transition states are shown in Fig. S3 (ESI†). Initially, the dehydrogenation of ethanol preferably starts from breaking the α-C–H bond, forming CH3CHOH*. CH3CHOH* is found to be not only able to break the α-C–H bond but also capable of breaking the β-C–H bond. Thus, during the formation of CH2CO* from which the C–C bond breaking would occur inevitably, two pathways need to be considered respectively.20–26 If the α-dehydrogenation pathway follows, the reaction route would be CH3CHOH* → CH3COH* → CH3CO* → CH2CO*; on the other hand, if the β-dehydrogenation pathway follows, the reaction path would be CH3CHOH* → CH2CHOH* → CH2COH* → CH2CO*. Fig. 2 shows the reaction mechanism for ethanol selective dehydrogenation with the structures of key intermediates on Pt(111).
 | ||
| Fig. 1 Unit stereographic triangle of platinum single-crystal surfaces and the models of surface atomic arrangements. | ||
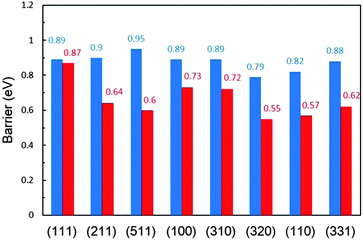
In the α-dehydrogenation pathway, we find that once CH3CO* forms on the surface it would be oxidized by surface oxidants derived from water dissociation at high potentials to produce acetic acid (CH3COOH*), and the further decomposition of CH3CO* to CH2CO* via β-C–H bond breaking is rather difficult since the barriers are very high which are not favoured kinetically at room temperature. CH3CO* on Pt(511) is the most stable one due to the highest decomposition barrier of 0.95 eV. The most active surfaces are Pt(320) and Pt(110) for CH3CO* dehydrogenation with barriers of 0.79 eV and 0.82 eV, respectively. On the other surfaces, the barriers are ∼0.90 eV. Although C1 products are more thermodynamically favored than CH3CO*, the high stability of CH3CO* prevents its further decomposition kinetically. That is, once the α-dehydrogenation occurs in CH3CHOH*, the final dehydrogenation product on the surface has to be CH3CO*.
In contrast, in the β-dehydrogenation pathway for the formation of CH2CO*, which does not involve the formation of CH3CO*, the barrier is much reduced. The comparison of the overall barriers in the two pathways is presented in Fig. 3. It is apparent that the barriers in the β-dehydrogenation pathway (the red columns) are all lower than those in the α-dehydrogenation pathway (the blue columns). The smallest overall barrier difference between the two pathways is obtained on Pt(111), i.e., 0.87 eV via the β-dehydrogenation pathway and 0.89 eV via the α-dehydrogenation pathway, indicating that the reaction rates for the formation of CH2CO* via the two pathways are rather close. But on the other surfaces, the advantage of the β-dehydrogenation pathway in kinetics is considerable owing to a lower barrier of 0.16–0.35 eV, which would result in increasing the rate at about two to four orders of magnitude compared with that via the α-dehydrogenation pathway at room temperature. It is therefore suggested that the β-dehydrogenation pathway is more favoured kinetically for C–C bond breaking.
 | ||
| Fig. 3 Comparison of the overall barriers (in eV) for CH3CHOH* dehydrogenation to CH2CO* via the α-dehydrogenation (blue) and β-dehydrogenation (red) pathways on a series of Pt surfaces. | ||
Whether CH2CO* or CHCO* is a reasonable precursor for C–C bond splitting is found to be dependent on the surface structure.30 We have thus examined the two possible pathways: (i) CH2CO* → CHCO* → CH* + CO* and (ii) CH2CO* → CH2* + CO*, respectively. If the dehydrogenation barrier is lower than the C–C bond breaking barrier, it would suggest the dehydrogenation to CHCO* could occur first. The comparison barriers between paths (i) and (ii) are displayed in Fig. S4 (ESI†). From our results, on Pt(111), Pt(100) and Pt(310), the mechanism follows path (i), while on other five surfaces, the C–C bond breaking in CH2CO* may occur directly without involving the formation of CHCO*. According to the favoured pathways, the C–C bond breaking barriers on different surfaces are presented in Fig. S5 (ESI†). It can be seen that all the barriers are 0.48–0.77 eV, indicating that the C–C bond breaking rate is reasonable kinetically. Once CH2* is produced from CH2CO*, it would be further decomposed into CH* which is stable on the surface since the further C* formation is prohibited by thermodynamics or kinetics. As a result of C–C bond breaking, one would expect the final C1 products to be CH* and CO* on major surfaces.
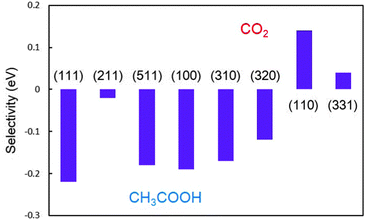
From the above kinetic analyses, it is shown that the selectivity towards CO* formation versus that towards CH3CO* formation on platinum is determined by the competition between the elementary step of CH3CHOH* → CH3COH* and the step of CH3CHOH* → CH2CHOH*. The barriers in C–C bond breaking steps being presented are reasonably low, such that the origin of low CO2 selectivity should date back to the selective dehydrogenation in CH3CHOH*. Only when the β-dehydrogenation pathway is preferred kinetically than the α-dehydrogenation pathway in CH3CHOH*, ethanol C–C bond breaking can occur. We thus defined the selectivity as the difference between the barrier of α-dehydrogenation (Ea,α-CH) and that of β-dehydrogenation (Ea,β-CH) as follows:
| ΔEa = Ea,α-CH − Ea,β-CH |
Quantitatively, the higher ΔEa indicates the more favoured β-dehydrogenation and the higher possibility of forming C1 products.23 The comparison of the selectivities obtained on a series of Pt surfaces is shown in Fig. 4, based on the above definition. It is found that the stepped Pt(110) surface possesses the highest selectivity with ΔEa being 0.13 eV, indicating that the predominant products (>99%, estimated by the Boltzmann distribution) on the surface would be CH* and CO* at low potentials. Upon increasing the width of the (111) terrace, (110) step sites could still hold the selectivity. On Pt(331), the selectivity is reduced to 82%, lower than that on Pt(110). Although having the same local structure of (110) sites, the presence of (111) terrace lowers the selectivity, indicating that the width of the terrace may affect the intrinsic properties of the step sites.
In the [01![[1 with combining macron]](https://www.rsc.org/images/entities/char_0031_0304.gif) ] zone, ΔEa is −0.22 eV on Pt(111) and −0.19 eV on Pt(100), respectively, suggesting that hardly any C1 product can form on the surface. The monoatomic (100) step on the (111) terrace, as the most common defect on surfaces, presents a moderate ability to break the C–C bond, although it is not comparable with the selectivities on Pt(110) and Pt(331); about 32% ethanol on the Pt(211) step would decompose into CH* and CO* finally. However, the monoatomic (111) step on the (100) terrace cannot promote CO2 selectivity. The selectivity obtained on Pt(511) is almost the same as that on Pt(100). Herein, in the [01
] zone, ΔEa is −0.22 eV on Pt(111) and −0.19 eV on Pt(100), respectively, suggesting that hardly any C1 product can form on the surface. The monoatomic (100) step on the (111) terrace, as the most common defect on surfaces, presents a moderate ability to break the C–C bond, although it is not comparable with the selectivities on Pt(110) and Pt(331); about 32% ethanol on the Pt(211) step would decompose into CH* and CO* finally. However, the monoatomic (111) step on the (100) terrace cannot promote CO2 selectivity. The selectivity obtained on Pt(511) is almost the same as that on Pt(100). Herein, in the [01![[1 with combining macron]](https://www.rsc.org/images/entities/char_0031_0304.gif) ] zone, only upon increasing the density of n(111) × (100) step sites, the selectivity can be enhanced. In the [001] zone, despite the selectivities on Pt(320) and Pt(310) being better than that on Pt(100), the former two surfaces still cannot provide any C1 product, indicating that the increase of step sites in this zone is not beneficial to CO2 production.
] zone, only upon increasing the density of n(111) × (100) step sites, the selectivity can be enhanced. In the [001] zone, despite the selectivities on Pt(320) and Pt(310) being better than that on Pt(100), the former two surfaces still cannot provide any C1 product, indicating that the increase of step sites in this zone is not beneficial to CO2 production.
The overall barriers in their kinetically favoured pathways can depict appropriately the activity in ethanol dehydrogenation on different surfaces. It can be seen from Table 1 that Pt(111) is the least active for ethanol dehydrogenation with the highest barrier of 0.78 eV and Pt(100) is more active with a lower barrier of 0.64 eV. Pt(211), Pt(511), Pt(310) and Pt(320) steps are the most active where the barriers are between 0.51 and 0.54 eV. The activities on Pt(110) and Pt(331) are similar with the overall barriers being 0.68 and 0.70 eV, which are determined by the C–C bond breaking barriers. The activities are in the following order:
| (111) < (110) ≈ (331) < (100) < (310) ≈ (211) ≈ (320) ≈ (511) |
| (111) | (211) | (511) | (100) | (310) | (320) | (110) | (331) | |
|---|---|---|---|---|---|---|---|---|
| E a | 0.78 | 0.54 | 0.51 | 0.64 | 0.54 | 0.52 | 0.68 | 0.70 |
| ΔEa | −0.22 | −0.02 | −0.18 | −0.19 | −0.17 | −0.12 | 0.14 | 0.04 |
From these results, it is understood that the presence of (110) or n(111) × (110) step sites may give rise to a high CO2 selectivity on practical catalysts, successfully explaining the experimental observations.8–12,15,16 However, the activities of such sites are less than other typical step sites, on which the partial oxidation to acetic acid is preferred. The reactive selectivity is strongly dependent on the local structure of the step sites and the low-coordination sites are not always active for C–C bond breaking. These findings highlight the need for control of the surface structure that will allow facile C–C bond breaking but hardly provide a high activity at the same time. It is reasonable to infer that how to balance the selectivity and activity will be more crucial for making platinum catalysts more efficient. It is hardly possible that pure platinum catalysts are sufficiently active for complete ethanol electrooxidation to CO2 without acetic acid as the partial oxidation product in DEFCs.
In summary, we have successfully built a general framework to comprehend the surface structure–selectivity relationship in ethanol electrooxidation on platinum catalysts. The reasonable formation mechanisms for the C1 products are pointed out via the β-dehydrogenation pathway from CH3CHOH*. The selectivity is defined as the barrier difference based on the kinetic analyses. It is found that only (110) and n(111) × (110) step sites may enhance CO2 selectivity but other non-selective step sites are more beneficial to the activity towards partial oxidation. This work could help gain more insights into the catalytic processes on practical catalysts with various surface sites, which is essential for the search for new highly active and selective catalysts.
This work was supported by the NSFC (21361140374, 21321062 and 21573183) and the EPSRC (EP/I013229/1).
Notes and references
- E. Antolini, J. Power Sources, 2007, 170, 1 CrossRef CAS.
- H. Wang, Z. Jusys and R. J. Behm, J. Phys. Chem. B, 2004, 108, 19413 CrossRef CAS.
- P. E. Tsiakaras, J. Power Sources, 2007, 171, 107 CrossRef CAS.
- A. Rabis, P. Rodriguez and J. T. Schmidt, ACS Catal., 2012, 2, 864 CrossRef CAS.
- F. Vigier, S. Rousseau, C. Coutanceau, J. M. Leger and C. Lamy, Top. Catal., 2006, 40, 111 CrossRef CAS.
- H. Nonaka and Y. Matsumura, J. Electroanal. Chem., 2002, 520, 101 CrossRef CAS.
- H. Hitmi, E. M. Belgsir, J. M. Leger, C. R. Lamy and O. Lezna, Electrochim. Acta, 1994, 39, 407 CrossRef CAS.
- J. Shin, W. J. Tornquist, C. Korzeniewski and C. S. Hoaglund, Surf. Sci., 1996, 364, 122 CrossRef CAS.
- J. Tarnowski and C. Korzeniewski, J. Phys. Chem. B, 1997, 101, 253 CrossRef.
- F. Colmati, G. Tremiliosi-Filho, E. R. Gonzalez, A. Berna, E. Herrero and J. M. Feliu, Faraday Discuss., 2009, 140, 379 RSC.
- F. Colmati, G. Tremiliosi, E. R. Gonzalez, A. Berna, E. Herrero and J. M. Feliu, Phys. Chem. Chem. Phys., 2009, 11, 9114 RSC.
- J. Souza-Garcia, E. Herrero and J. M. Feliu, ChemPhysChem, 2010, 11, 1391 CrossRef CAS PubMed.
- C. Buso-Rogero, V. Grozovski, F. J. Vidal-Iglesias, J. Solla-Gullon, E. Herrero and J. M. Feliu, J. Mater. Chem. A, 2013, 1, 7068 CAS.
- S. C. S. Lai and M. T. M. Koper, Faraday Discuss., 2008, 140, 399 RSC.
- S. C. S. Lai and M. T. M. Koper, Phys. Chem. Chem. Phys., 2009, 11, 10446 RSC.
- S. C. S. Lai and M. T. M. Koper, J. Phys. Chem. Lett., 2010, 1, 1122 CrossRef CAS.
- V. Pallassana and M. Neurock, J. Catal., 2000, 191, 301 CrossRef CAS.
- Z.-P. Liu and P. Hu, J. Chem. Phys., 2001, 114, 8244 CrossRef CAS.
- A. Logadottir, T. H. Rod, J. K. Norskov, B. Hammer, S. Dahl and C. J. H. Jacobsen, J. Catal., 2001, 197, 229 CrossRef CAS.
- R. Kavanagh, X. M. Cao, W. F. Lin, C. Hardacre and P. Hu, Angew. Chem., Int. Ed., 2012, 51, 1572 CrossRef CAS PubMed.
- H. F. Wang and Z. P. Liu, J. Am. Chem. Soc., 2008, 130, 10996 CrossRef CAS PubMed.
- T. Sheng, W. F. Lin, C. Hardacre and P. Hu, J. Phys. Chem. C, 2014, 118, 5762 CAS.
- T. Sheng, W. F. Lin, C. Hardacre and P. Hu, Phys. Chem. Chem. Phys., 2014, 16, 13248 RSC.
- J. M. Jin, T. Sheng, X. Lin, R. Kavanagh, P. Hamer, P. Hu, C. Hardacre A. Martinez-Bonastre, J. Sharman, D. Thompsett and W. F. Lin, Phys. Chem. Chem. Phys., 2014, 16, 9432 RSC.
- D. D. Hibbitts and M. Neurock, J. Catal., 2013, 299, 261 CrossRef CAS.
- B. Braunchweig, D. Hibbitts, M. Neurock and A. Wieckowski, Catal. Today, 2013, 202, 197 CrossRef CAS.
- J. F. Nicholas, An Atlas of Models of Crystal Surfaces; Gordon & Breach, New York, 1965 Search PubMed.
- N. Tian, Z. Y. Zhou and S. G. Sun, J. Phys. Chem. C, 2008, 112, 19801 CAS.
- N. Hoshi, K. Kida, M. Nakamura, M. Nakada and K. Osada, J. Phys. Chem. B, 2006, 110, 12480 CrossRef CAS PubMed.
- R. Alcala, M. Mavrikakis and J. A. Dumesic, J. Catal., 2003, 218, 178 CrossRef CAS.
Footnote |
| † Electronic supplementary information (ESI) available. See DOI: 10.1039/c6cp02484j |
| This journal is © the Owner Societies 2016 |


