
 Open Access Article
 This Open Access Article is licensed under a Creative Commons Attribution-Non Commercial 3.0 Unported Licence
Liquid self-diffusion of H2O and DMF molecules in Co-MOF-74: molecular dynamics simulations and dielectric spectroscopy studies†
J. M.
Bermúdez-García
a,
J. M.
Vicent-Luna
b,
S.
Yáñez-Vilar
a,
S.
Hamad
b,
M.
Sánchez-Andújar
 a,
S.
Castro-García
a,
S.
Calero
*b and
M. A.
Señarís-Rodríguez
*a
a,
S.
Castro-García
a,
S.
Calero
*b and
M. A.
Señarís-Rodríguez
*a
aQuiMolMat Group, Department of Fundamental Chemistry, Faculty of Science and CICA, University of A Coruña, Campus A Coruña, 15071 A Coruña, Spain. E-mail: m.senaris.rodriguez@udc.es
bDepartment of Physical, Chemical, and Natural Systems, Universidad Pablo de Olavide, Ctra. Utrera km. 1, ES-41013 Seville, Spain. E-mail: scalero@upo.es
First published on 8th June 2016
Abstract
In this work we use molecular dynamics simulations to study the diffusion of N,N-dimethylformamide (DMF) and H2O as a function of temperature within the well-known metal–organic framework Co2(dobdc)·[G] (G = 2DMF·1H2O), also known as Co-MOF-74. The molecular dynamics simulations show that the diffusivity of guest molecules, which is almost negligible at low temperatures (T < 200 K), increases in the range of 200 < T (K) < 400 up to 3 and 4 orders of magnitude for DMF and H2O, respectively. This molecular diffusion can be easily detected by dielectric spectroscopy as it gives rise to extrinsic interfacial polarization effects that result in an apparent “colossal” dielectric constant at room temperature, εr′ ∼ 42![[thin space (1/6-em)]](https://www.rsc.org/images/entities/char_2009.gif) 000 (T = 300 K, ν = 10 Hz). Furthermore, the measured dielectric constant exhibits a thermal dependence similar to that of the diffusion coefficient, revealing the parallelism of the dielectric response and the molecular diffusion as a function of temperature. These results highlight: (a) the great utility of the fast and non-destructive dielectric and impedance spectroscopy techniques for the study and detection of the molecular transport of small polar molecules within porous metal-organic frameworks and related materials; (b) the peculiarity and uniqueness of MOF materials with “medium” size nanopores containing guest molecules as they are solid materials in which the guest molecules display a liquid state-like behaviour close to room temperature; and (c) the potential of these materials for molecular transport applications.
000 (T = 300 K, ν = 10 Hz). Furthermore, the measured dielectric constant exhibits a thermal dependence similar to that of the diffusion coefficient, revealing the parallelism of the dielectric response and the molecular diffusion as a function of temperature. These results highlight: (a) the great utility of the fast and non-destructive dielectric and impedance spectroscopy techniques for the study and detection of the molecular transport of small polar molecules within porous metal-organic frameworks and related materials; (b) the peculiarity and uniqueness of MOF materials with “medium” size nanopores containing guest molecules as they are solid materials in which the guest molecules display a liquid state-like behaviour close to room temperature; and (c) the potential of these materials for molecular transport applications.
1. Introduction
Metal–Organic Frameworks (MOFs), which are built up from inorganic cations connected to polydentate organic molecules, have attracted immense attention during the last two decades, due to the possibility of obtaining a large variety of interesting structures that are of great interest for applications in a number of fields related to porous materials. These include the more traditional areas of storage, separation, and catalysis,1,2 as well as novel environmental applications, such as thermally-driven adsorption heat pumps;3 or biomedical applications, such as synthetic ion channel design, molecular recognition and drug delivery.4These characteristics, combined with their low production cost, make MOFs the target of many studies, focusing mostly on their adsorption properties. MOFs are also receiving increasing attention for displaying a wide range of interesting functional properties,5,6 including dielectric7,8 and even multiferroic properties.9–11 Almost all these properties, and thus their potential applications, depend highly on the interaction between the framework and the guest molecules, as well as on the diffusion of the latter through the pores of the structure; aspects that are currently far from being completely understood.
In this context, great efforts have been devoted to elucidate the diffusion process of small molecules (typically gas molecules) in the pores of MOFs using experimental monitoring techniques and ab initio simulations.12–16 Nevertheless, there are still very few studies about the diffusion process of guest liquid-solvent molecules in these materials.17–21
In this work, we show the potential of the non-destructive dielectric and impedance spectroscopy (IS) techniques for the detection of the self-diffusion of polar species within porous materials as this gives rise to extrinsic interfacial polarization effects that result in an apparent “colossal” dielectric constant at room temperature. For this purpose, we present the study we have made, combining dielectric and impedance spectroscopy together with molecular dynamics (MD) simulations on a porous MOF containing several small guest molecules. To avoid non reproducible effects, and to ensure that the compound is stable toward the loss of the included molecules, we have chosen a compound that displays “medium” size nanopores (that is, cavities that are sufficiently large to allow the presence of several guest species with a considerable degree of freedom, but small enough to prevent their easy loss at room temperature).
The selected compound has been a co-member of the well-known family of MOF-74 compounds (also known as CPO-27) of general formula M2(dobdc)·[G] (M = Zn2+, Mg2+, Co2+, Ni2+, etc., dobdc = 2,5-dioxo-1,4-benzenedicarboxylate, G = DMF, H2O, EtOH, etc.).22 As it has been described, the structure of these porous compounds consists of 1D inorganic rods linked by dobdc ligands to form hexagonal channels,22 where several guest molecules are located inside the resulting cavities. Due to such a hexagonal porous structure with 1D channels, whose aperture is around 14 Å,23 several studies have been published in recent years reporting not only the gas adsorption24–26 but also the selectivity27,28 and molecular separation of gas species.29
In the particular case of the here studied Co-MOF-74 compound of formula Co2(dobdc)·[G] (G = DMF and H2O), this crystalline compound displays a hexagonal symmetry, space group R![[3 with combining macron]](https://www.rsc.org/images/entities/char_0033_0304.gif) , and it exhibits “medium” size nanopores of 15.2 Å aperture.30 Its cell parameters are: a = b = 25.885(3) Å, c = 6.8058(17) Å, α = β = 90° and γ = 120°, V = 3949.0(12) Å3, Z = 18, for G = 0. It should be noted that the cell parameters in the MOF-74 change very little as a function of number of guest species (ΔV < 0.7% for G = 2DMF·2H2O or for G = 10H2O).17,26,30
, and it exhibits “medium” size nanopores of 15.2 Å aperture.30 Its cell parameters are: a = b = 25.885(3) Å, c = 6.8058(17) Å, α = β = 90° and γ = 120°, V = 3949.0(12) Å3, Z = 18, for G = 0. It should be noted that the cell parameters in the MOF-74 change very little as a function of number of guest species (ΔV < 0.7% for G = 2DMF·2H2O or for G = 10H2O).17,26,30
2. Experimental and computational methods
2.1. Molecular dynamics simulations
Molecular dynamics simulations in the NVT ensemble have been carried out to calculate the diffusivity of DMF and H2O molecules inside the pores of Co-MOF-74 for different temperatures, using the Nose–Hoover thermostat31,32 to control the temperature. NVT calculations are known to provide reliable results for transport properties in these types of systems.33 van der Waals interactions were evaluated for a cutoff of 1.2 nm, whereas Coulombic forces were dealt with using the particle–mesh Ewald method.34 The cross terms for Lennard-Jones potential were calculated using Lorentz–Berthelot mixing rules. All simulations were carried out using RASPA simulation software.35 For each simulation, we executed 108 steps of production run with an integration step of 5 fs, giving a total simulation time of 50 ns.Co-MOF-74 was modelled as a rigid structure with an effective potential in each atom. The simulation box was chosen to have dimensions a × b × 4c, with the aim of having unit cell lengths of at least 24 Å. The cell volume was kept fixed during the simulations, in view of the negligible variation of the volume as the loading changes, as indicated in the previous section. The structure contains 72 DMF molecules and 36 H2O molecules randomly placed inside its pores. The simulation box was replicated by applying periodic boundary conditions in all directions.
Lennard-Jones parameters for the framework were taken from the DREIDING36 forcefield, except for Co atoms, which were taken from the UFF37 forcefield. These non-polarisable forcefields have been extensively used in the literature to study MOFs with open metal sites, and they provide good agreement for the temperatures and pressures in the range we are studying.38 We used the Generalized Amber force field (GAFF)39 for DMF and the Tip5pEw40 model for water. This model is parameterized for use with the Ewald summation method. Point charges for the framework atoms were calculated with first principles calculations and they are shown in Fig. S1 of ESI.† To do that, we firstly minimized the experimental structure, using the Vienna Ab-initio Simulation Package (VASP),41–44 with the generalized gradient approximation (GGA) and the Perdew–Burke–Ernzerhof functional revised for solids, PBEsol.45 The cutoff was set to 420 eV. During relaxation, forces on each atom were minimized until they were all less than 0.01 eV Å−1. Spin-polarized calculations were performed, with a spin moment of the Co atoms of 1. The most stable spin configuration was obtained when the simulation cell of 18 Co atoms has an antiferromagnetic distribution, with a total spin moment of 0. The charges were then obtained using the Repeating Electrostatic Potential Extracted Atomic method (REPEAT), developed by Campañá et al.46
Self-diffusion coefficients of adsorbate molecules were obtained from the MD trajectories, through the slope of the mean-squared displacement (MSD) in the diffusive regime (see Fig. S2 of ESI†) using Einstein's relation:
 | (1) |
2.2. Synthesis of the samples
The Co-MOF-74 sample was synthesized as polycrystalline powder according to the procedure described in the literature.47 In a typical experiment, 3.12 mmol cobalt(II) acetate tetrahydrate Co(C2H3O2)2·4H2O (Aldrich, 98%) was dissolved in 20 mL of N,N-dimethylformamide (DMF) and 1.2 mmol of 2,5-dihydroxyterephthalic acid (Aldrich, 98%) was dissolved in 20 mL of DMF. The resulting solutions were mixed and stirred for three days. The obtained precipitate was isolated by centrifugation at 5000 rpm for 15 minutes, and the mother liquor was discarded. The remaining product was washed thoroughly five times with 20 mL of DMF, isolated by centrifugation and dried at room temperature.In addition, a portion of this material was evacuated under vacuum for 8 hours to intentionally eliminate the guest molecules obtaining another sample, hereafter labelled as Co-MOF-74(ev).
Both samples were finally stored in a desiccator to ensure the removal of any solvent molecules that could have remained adsorbed on the surface of the corresponding powders.
2.3. Characterization of the samples
According to the XRPD pattern, the obtained Co-MOF-74 sample is single phase, and the structural data obtained from the Le Bail refinement are in good agreement with those reported in the literature (see Fig. S3 of ESI†).30
The IR spectra of the as obtained Co-MOF-74 and Co-MOF-74(ev) samples are similar, and they are in agreement with those reported in the literature for Co-MOF-74,22 see Fig. S5 of ESI.† The vibrations of the carboxylate groups give rise to bands at 1497 and 1357 cm−1. The bands at 1648, 878, 809, and 636 cm−1 can be attributed to the vibrations of the benzene rings. The presence of water in Co-MOF-74 is clearly detected by the presence of a broad band at around 3500 cm−1 (which is almost negligible for the Co-MOF-74(ev) compound).
Combining the obtained TGA results with the elemental analysis data, the amount of guest molecules (DMF and H2O) allocated inside the pores of the here prepared samples was calculated, resulting in the following molecular chemical formula: sample Co-MOF-74 = Co2(dobdc)·[2DMF·1H2O], and sample Co-MOF74(ev) = Co2(dobdc)·[0.5DMF]. This last result implies that in Co-MOF-74(ev) most of the guest molecules have been eliminated from the pores. Nevertheless, some DMF remains present, as is also detected by IR spectroscopy.
Dielectric measurements were carried out in a nitrogen atmosphere, where several cycles of vacuum and nitrogen gas were performed to ensure that the sample environment was free of water.
The impedance analysis software SMART (Solartron Analytical) was used for data acquisition and processing. Impedance complex plane plots were analysed using the LEVM program, a particular program for complex nonlinear least-squares fitting.49
3. Results
3.1. Molecular dynamics simulations
Fig. 1 shows the self-diffusion coefficients of H2O (A) and DMF (B) molecules in the entire range of temperature studied, from 100 K to 400 K. Both guest molecules exhibit similar behaviour: their self-diffusion coefficient increases exponentially with temperature, even if H2O shows a diffusion coefficient one order of magnitude higher than DMF. This could be attributed to the smaller size of H2O, in addition to the smaller amount of H2O molecules considered. At the lowest temperature under study, the diffusion of the two molecules is almost negligible, while above 200 K the mobility of DMF and H2O is already noticeable. | ||
| Fig. 1 Self-diffusion coefficients of H2O (A) and DMF (B) in Co-MOF-74 (Co2(dobdc)·[2DMF·1H2O]) as a function of temperature. Inset figures show the same data, but with the logarithmic scale in the y axis. | ||
The inset of Fig. 1 evidences the difference between the diffusion magnitude at the lowest (T = 100 K) and the highest (T = 400 K) temperature, which is 3 orders of magnitude for the DMF and 4 orders of magnitude for H2O.
The exponential behaviour of diffusion shown in Fig. 1 could be fitted using the Arrhenius law (eqn (2)), which relates the diffusion coefficients to the temperature and the activation energy of the process:
 | (2) |
 | ||
| Fig. 2 Arrhenius plot for the diffusion of H2O and DMF molecules in Co-MOF-74. | ||
In addition to transport phenomena, we analysed the spatial distribution of the guest molecules inside the MOF cavities. In this context, we found that DMF fills most of the available space and is homogenously distributed inside the channels of Co-MOF-74. This is probably due to the size and amount of DMF molecules present. On the other hand, water molecules show two preferred sites to locate. A few molecules are located surrounding the Co atoms of the MOF with different probabilities, depending on temperature, while the rest of them are dissolved inside the DMF network. To shed light on this effect, we computed the distance between the oxygen atoms of water and the cobalt atoms of Co-MOF-74 (distance CoMOF–OH2O). The minimum distances obtained are close to 2.63 Å. This is in agreement with the DFT calculations reported by Li et al.17 for Zn-MOF-74, which gives us further confidence on the validity of our forcefield to model these systems.
Fig. S6A of ESI† shows the probability to have water molecules surrounding Co atoms at distances lower than 4 Å. We observe that the increase of temperature leads to lower probability of finding water molecules surrounding the open metal sites of Co-MOF-74. Fig. S6B of ESI† shows the percentage of water molecules with probability >70% that are located near the Co atoms as a function of temperature. At low temperatures, about 40% of the molecules of water exhibit high probability to be located close to the metal atoms of Co-MOF-74. This percentage decreases up to an almost negligible value above 200 K, since the diffusion coefficient of guest molecules becomes noticeable at these temperatures.
3.2. Dielectric behaviour
Fig. 3 shows the temperature dependence of the real part of the complex dielectric permittivity, εr′, (the so-called dielectric constant) of the pressed pellets of the polycrystalline sample of Co-MOF-74.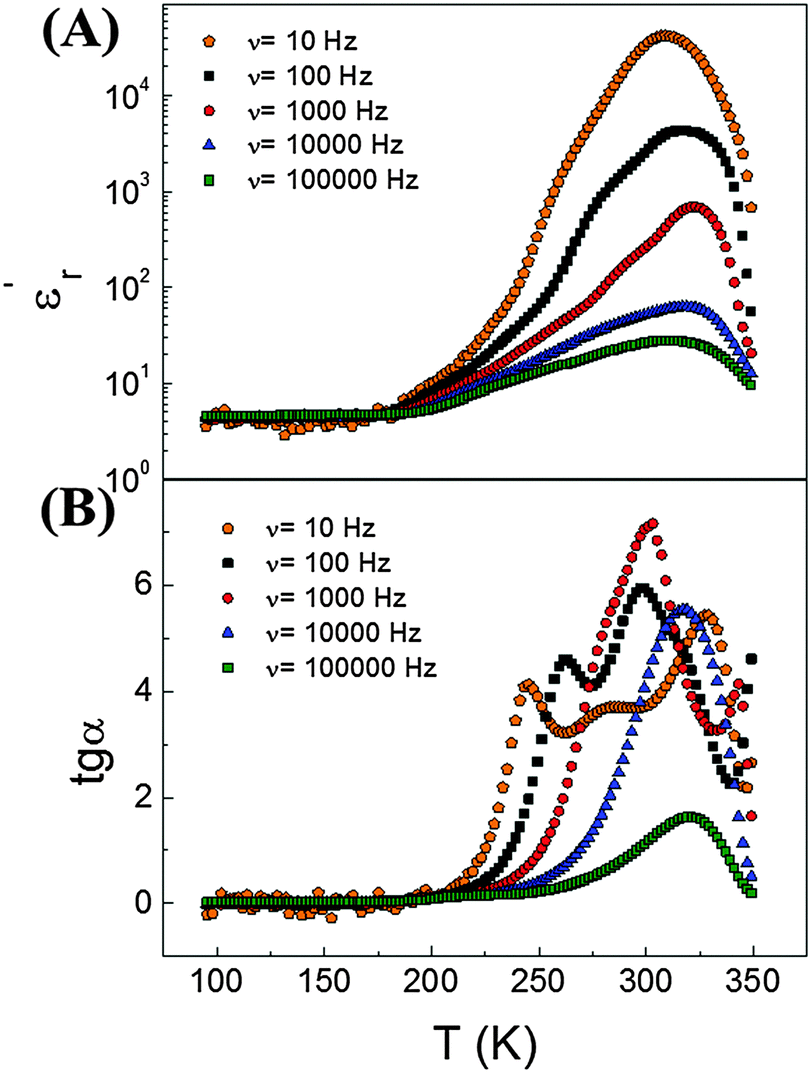 | ||
| Fig. 3 (A) Dielectric constant and (B) loss tangent of Co-MOF-74 measured in the temperature interval 100 ≤ T (K) ≤ 350 at several frequencies. | ||
As it can be seen, at low temperature the value of the dielectric constant is about 4 and does not depend on frequency. Meanwhile, close to room temperature the dielectric constant goes through a broad and pronounced maximum, reaching values that can be considered “colossal” (εr′ > 1000):50 for example εr′ ∼ 42000 at T = 300 K and ν = 10 Hz. At the same temperature, the loss tangent curves also go through a maximum, see Fig. 3.
It should also be noted that for T > 200 K the dielectric constant displays strong frequency dependence.
Finally, for T > 300 K, temperature at which according to TGA solvent molecules start to be released, the dielectric constant decreases to small values (εr′ ∼ 680 at T = 350 K and ν = 10 Hz).
If we now compare the behaviour of Co-MOF-74 with that of Co-MOF-74(ev), from which the number of guest molecules has been drastically reduced, we can see that the broad peak observed close to room temperature has disappeared in Co-MOF-74(ev), see Fig. 4. In fact, the dielectric constant of the latter sample is very low at room temperature (εr′ ∼7 for ν = 100 Hz) and almost temperature and frequency independent. To deepen further in the dielectric behaviour displayed by these two samples, we have carried out impedance spectroscopy studies as a function of frequency and temperature.
 | ||
| Fig. 4 Comparison of the dielectric constant as a function of the temperature measured at 100 Hz for the samples Co-MOF-74, Co2(dobdc)·[2DMF·1H2O], and Co-MOF-74(ev), Co2(dobdc)·[0.5DMF]. | ||
As is well-known, this technique is a very powerful tool to unravel the dielectric response of materials51 and to avoid misinterpreting results such as apparent hysteresis loops displayed by electrically inhomogeneous samples.52,53
Fig. 5 shows typical impedance complex plane plots for Co-MOF-74 in the temperature range 100 ≤ T (K) ≤ 200 (Fig. 5A) and 200 < T (K) ≤ 350 (Fig. 5B). As it can be seen, in the lower temperature interval the corresponding impedance complex plane plot shows a single large arc (Fig. 5A). Meanwhile, in the higher temperature interval an additional second small arc appears in the low frequency range (Fig. 5B).
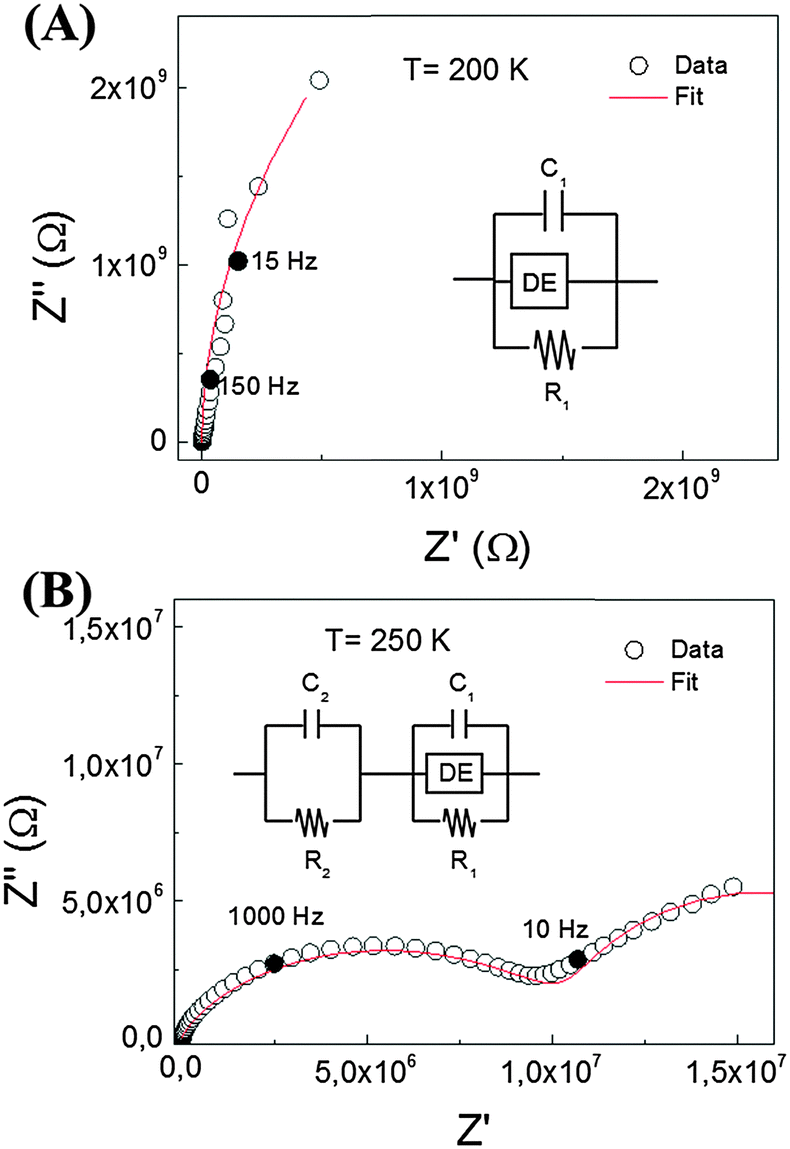 | ||
| Fig. 5 Typical impedance complex plane plots for Co-MOF-74 in the temperature ranges (A) 100 ≤ T (K) ≤ 200 and (B) 200 ≤ T (K) ≤ 350. | ||
The large arc can be modelled by an equivalent circuit containing three elements connected in parallel: a resistance (R) and a capacitance that are frequency independent, together with a frequency-dependent distributed element (DE). As this large arc intercepts zero for T ≤ 200 K and the order of magnitude of its capacitance is pF cm−1, it seems to be associated with the material bulk-response.54 The intrinsic dielectric constant, calculated from the obtained capacitance value, is around 4. Taking into account that this is the only contribution present for T ≤ 200 K, the observed dielectric response is purely intrinsic in this low temperature interval.
The second arc observed for T > 200 K can be modelled as a single RC connected in series with the circuit that describes the bulk arc. The capacitance of such a low frequency arc is about μF cm−1, typical of extrinsic contributions such as electrode effects, blocking electrodes, etc. This means that in the higher temperature interval, including room temperature, the dielectric response of Co-MOF-74 contains both intrinsic and extrinsic contributions.
Another interesting remark is that the Co-MOF-74 sample is insulating at low temperatures (T ≤ 200 K, σ ∼ 10−8 Ω−1 m−1), while for T > 200 K this material shows a certain conductivity (σ ∼ 10−5 Ω−1 m−1).
These results, together with the very large values of the dielectric constant measured for Co-MOF-74 at T > 200 K, reveal the activation of interfacial polarization effects in this compound close to room temperature.51
On the other hand, in the case of Co-MOF-74(ev), the impedance complex plane plots show a single large arc that intercepts zero in the whole temperature range studied (from 100 K to 350 K), see Fig. S7 of ESI,† and the sample remains insulating up to 350 K. These results indicate that, differently from Co-MOF-74, the dielectric response of the Co-MOF-74(ev) sample is purely intrinsic.
4. Discussion
We have theoretically studied the diffusion process of liquid–solvent guest molecules (DMF and H2O) inside the channels of Co-MOF-74 using MD simulations. This material displays 1D hexagonal “medium” size pores with an aperture of 15.2 Å, where the solvent molecules are located. The MD simulations of Co-MOF-74 reveal that the self-diffusion coefficient of guest molecules increases exponentially with temperature, as shown in Fig. 1. This diffusion is almost negligible for both molecules at the lowest temperature, while above 200 K the mobility of the molecules begins to be noticeable. Above 120 K, the diffusion of water starts to be higher than the diffusion of DMF, although the increase with temperature of water diffusion is faster than that of DMF, due to the higher activation energy of the former (see Fig. 2). For temperatures below 200 K, the molecules of water exhibit high probability to be located close to the metal atoms of Co-MOF-74, meanwhile above 200 K the interaction between water molecules and the metal sites of the framework starts to decrease significantly (see Fig. S6 of ESI†).Additionally, we have studied the dielectric properties of this material. Out of the obtained results, we highlight three aspects: (a) the fact that the dielectric constant achieves “colossal” values above T > 200 K, showing a maximum at around 300 K (εr′ ∼ 42000 at T = 300 K and ν = 10 Hz), contrary to the situation encountered at lower temperatures. (b) The relationship between such dielectric features and the presence of the polar guest molecules inside the pores, as the broad peak and the very high dielectric values disappear upon elimination of the DMF and H2O molecules from the compound. (c) The fact that impedance spectroscopy (IS) reveals that above 200 K the dielectric response is greatly enhanced by the activation of extrinsic contributions, while at lower temperatures its dielectric response is purely intrinsic.
With all this information, we attribute the intrinsic dielectric response of this Co-MOF-74 to the presence of dipolar guest molecules inside the pores and their concomitant orientational polarizability. The latter will be small at low temperatures, when the guest molecules are frozen in specific positions with very low thermal motion, as shown by the MD simulations. Nevertheless, their degree of freedom will markedly increase with temperature, as revealed by MD, resulting in a higher polarizability close to room temperature.
As for the origin of the extrinsic effects, which magnify the intrinsic response and give rise to a ”colossal“ dielectric constant, our explanation is the following: we relate it to the fact that the porous structure allows the self-diffusion of the guest molecules located in the channels, processes that, as indicated by MD, start to be noticeable above 200 K. We suggest that the diffusion of such guest molecules leads to the presence of an electrical double layer (EDL) between the bulk material and the electrodes responsible for the dielectric extrinsic contribution, which is the one dominating the observed dielectric response. This behaviour is similar to that observed in biological materials,55 ionic conductors56 or the liquid state. In fact, the guest molecules display a behaviour typical of liquids, even if they are inside a solid framework.
In that regard, it is very interesting to note the high correlation between the thermal evolution of the diffusion coefficients of H2O and DMF in Co-MOF-74 and the measured dielectric constant up to 300 K (temperature above which the guest molecules start to be released according to TGA). As shown in Fig. 6, both show an exponential increase with temperature.
 | ||
| Fig. 6 Comparison of DMF/H2O diffusion coefficients in Co-MOF-74 obtained from MD simulations (red/blue) and the dielectric constant (green) of this sample as a function of temperature. All values have been normalized for a better view. | ||
Once the guest molecules, DMF and H2O, are eliminated (for example in the evacuated sample, Co-MOF-74(ev), or when they are released above room temperature), the EDL disappears, the dielectric constant drastically decreases and the dielectric response becomes purely intrinsic. Thus, these latter findings reinforce that the origin of the “colossal” dielectric response for the Co-MOF-74 compound is due to the diffusion of the polar guest molecules through the channels of the porous structure and the presence of an almost liquid-like state throughout the framework pores, which can be readily polarized in the presence of an electric field.
As for the strong dependence displayed by the dielectric response of Co-MOF-74 on the frequency of the applied voltage (dielectric relaxation), it is due to the response of the guest molecules to the oscillating applied ac voltage. At low frequencies, these molecules can follow these oscillating voltage and the dielectric constant values are large. Meanwhile, at high frequencies the guest molecules cannot follow the oscillating voltage and the value of the dielectric constant decreases.
Finally, it is interesting to note that the dielectric response observed for Co-MOF-74 is similar to that shown by the related family of porous compounds M2(bdc)2dabco·[G] (M = Co2+ and Ni2+, G = DMF and H2O). These compounds also show “colossal” dielectric constants at room temperature (εr ∼ 5000 at 300 K and ν = 100 Hz),8 that have been attributed to the activation of extrinsic effects above T > 260 K related to the long-range migration of the guest species inside the channels.
5. Conclusions
In conclusion, the here shown results highlight the great utility of the fast and non-destructive dielectric and impedance spectroscopy techniques for the study of molecular transport of small polar molecules within porous metal–organic frameworks and related materials.Moreover, they show that MOF materials with “medium” size nanopores containing small guest molecules are unique and peculiar solid materials, where two different components coexist: a framework, with the characteristics of a solid, and the guest molecules located inside cavities of this framework, which display a liquid-like state behaviour close to room temperature.
Furthermore, these results evince the huge potential of MOFs containing “medium” size nanopores for molecular transport applications, for example for drug delivery, where the drugs can be solvated by the liquid component and can also diffuse beyond framework limits within the physiological temperature range.
Acknowledgements
The authors are grateful for financial support from Ministerio de Economía y Competitividad (MINECO) ENE2014-56237-C4-4-R, Xunta de Galicia under the project GRC2014/042, and by the European Research Council through an ERC Starting Grant (ERC2011-StG-279520-RASPA). The authors are indebted to Centro de Supercomputación de Galicia (CESGA) for providing the computer facilities. S. Y.-V. acknowledges Xunta de Galicia for a Postdoctoral fellowship.Notes and references
- O. M. Yaghi, M. O'Keeffe, N. W. Ockwig, H. K. Chae, M. Eddaoudi and J. Kim, Nature, 2003, 423, 705–714 CrossRef CAS PubMed.
- A. J. Fletcher, K. M. Thomas and M. J. Rosseinsky, J. Solid State Chem., 2005, 178, 2491–2510 CrossRef CAS.
- S. K. Henninger, F. Jeremias, H. Kummer and C. Janiak, Eur. J. Inorg. Chem., 2012, 2625–2634 CrossRef CAS.
- N. Ahmad, H. A. Younus, A. H. Chughtaiabd and F. Verpoort, Chem. Soc. Rev., 2015, 44, 9–25 RSC , and references therein.
- A. K. Cheetham and C. N. R. Rao, Science, 2007, 318, 58–59 CrossRef CAS PubMed.
- G. Ferey, Chem. Soc. Rev., 2008, 37, 191–214 RSC.
- M. Guo, H.-L. Cai and R.-G. Xiong, Inorg. Chem. Commun., 2010, 13, 1590–1598 CrossRef CAS , and ref. therein.
- M. Sánchez-Andújar, S. Yáñez-Vilar, B. Pato-Doldán, C. Gómez-Aguirre, S. Castro-García and M. A. Señarís-Rodríguez, J. Phys. Chem. C, 2012, 116, 13026–13032 CrossRef.
- G. Rogez, N. Viart and M. Drillon, Angew. Chem., Int. Ed., 2010, 49, 1921–1923 CrossRef CAS PubMed.
- G. C. Xu, W. Zhang, X. M. Ma, Y. H. Chen, L. Zhang, H. L. Cai, Z. M. Wang, R. X. Xiong and S. Gao, J. Am. Chem. Soc., 2011, 133, 14948–14951 CrossRef CAS PubMed.
- (a) P. Jain, N. S. Dalal, B. H. Toby, H. W. Kroto and A. K. Cheetham, J. Am. Chem. Soc., 2008, 130, 10450–10451 CrossRef CAS PubMed; (b) P. Jain, V. Ramachandran, R. J. Clark, H. D. Zhou, B. H. Toby, N. S. Dalal, H. W. Kroto and A. K. Cheetham, J. Am. Chem. Soc., 2009, 131, 13625–13627 CrossRef CAS PubMed; (c) M. Sánchez-Andújar, S. Presedo, S. Yáñez-Vilar, S. Castro-García, J. Shamir and M. A. Señarís-Rodríguez, Inorg. Chem., 2010, 49, 1510–1516 CrossRef PubMed.
- J. Kärger, T. Binder, C. Chmelik, F. Hibbe, H. Krautscheid, R. Krishna and J. Weitkamp, Nat. Mater., 2014, 13, 333–343 CrossRef PubMed.
- C. Chmelik, L. Heinke, P. Kortunov, J. Li, D. Olson, D. Tzoulaki, J. Weitkamp and J. Kärger, ChemPhysChem, 2009, 10, 2623–2627 CrossRef CAS PubMed.
- S. N. Nobar and S. Farooq, Chem. Eng. Sci., 2012, 84, 801–813 CrossRef.
- J. R. Li, R. J. Kuppler and H. C. Zhou, Chem. Soc. Rev., 2009, 38, 1477–1504 RSC.
- A. I. Skoulidas and D. S. Sholl, J. Phys. Chem. B, 2005, 109, 15760–15768 CrossRef CAS PubMed.
- Y. Li, X. Wang, D. Xu, J. D. Chung, M. Kaviany and B. Huang, J. Phys. Chem. C, 2015, 119, 13021–13031 CrossRef CAS.
- F. Stallmach, S. Groger, V. Kunzel, J. Kärger, O. M. Yaghi, M. Hesse and U. Müller, Angew. Chem., Int. Ed., 2006, 45, 2123–2126 CrossRef CAS PubMed.
- C. Wang and W. Lin, J. Am. Chem. Soc., 2011, 133, 4232–4235 CrossRef CAS PubMed.
- (a) E. R. Garcia, R. L. Medina, M. M. Lozano, I. H. Perez, M. J. Valero and A. M. M. Franco, Materials, 2014, 7, 8037–8057 CrossRef PubMed; (b) W. Zhou, C. Wöll and L. Heinke, Materials, 2015, 8, 3767–3775 CrossRef CAS.
- B. Zheng, L. L. Wang, L. Du, Y. Pan, Z. Lai, K.-W. Huang and H. L. Du, Mater. Horiz., 2016 10.1039/C6MH00047A.
- N. L. Rosi, J. Kim, M. Eddaoudi, B. Chen, M. O'Keeffe and O. M. Yaghi, J. Am. Chem. Soc., 2005, 127, 1504–1518 CrossRef CAS PubMed.
- H. Deng, S. Grunder, K. E. Cordova, C. Valente, H. Furukawa, M. Hmadeh, F. Gándara, A. C. Whalley, Z. Liu, S. Asahina, H. Kazumori, M. O'Keeffe, O. Terasaki, J. F. Stoddart and O. M. Yaghi, Science, 2012, 336, 1018–1023 CrossRef CAS PubMed.
- L. Valenzano, B. Civalleri, S. Chavan, G. T. Palomino, C. O. Areán and S. Bordiga, J. Phys. Chem. C, 2010, 114, 11185–11191 CrossRef CAS.
- N. Nijem, J. F. Veyan, L. Kong, H. Wu, Y. Zhao, J. Li, D. C. Langreth and Y. J. Chabal, J. Am. Chem. Soc., 2010, 132, 14834–14848 CrossRef CAS PubMed.
- W. L. Queen, M. R. Hudson, E. D. Bloch, J. A. Mason, M. I. Gonzalez, J. S. Lee, D. Gygi, J. D. Howe, K. Lee, T. A. Darwish, M. James, V. K. Peterson, S. J. Teat, B. Smit, J. B. Neaton, J. R. Long and C. M. Brown, Chem. Sci., 2014, 5, 4569–4581 RSC.
- J. Liu, J. Tian, P. K. Thallapally and B. P. McGrail, J. Phys. Chem. C, 2012, 116, 9575–9581 CrossRef CAS.
- K. Tan, S. Zuluaga, Q. Gong, Y. Gao, N. Nijem, J. Li, T. Thonhauser and Y. J. Chabal, Chem. Mater., 2015, 27, 2203–2217 CrossRef CAS.
- D.-L. Chen, H. Shang, W. Zhu and R. Krishna, Chem. Eng. Sci., 2015, 124, 109–117 CrossRef CAS.
- P. D. C. Dietzel, Y. Morita, R. Blom and H. Fjellvag, Angew. Chem., Int. Ed., 2005, 44, 6354–6358 CrossRef CAS PubMed.
- S. A. Nose, Mol. Phys., 2002, 100, 191–198 CrossRef.
- W. G. Hoover, Phys. Rev. A: At., Mol., Opt. Phys., 1985, 31, 1695–1697 CrossRef.
- (a) G. Pranami and M. H. Lamm, J. Chem. Theory Comput., 2015, 11, 4586–4592 CrossRef CAS PubMed; (b) D. C. Ford, D. Dubbeldam, R. Q. Snurr, V. Künzel, M. Wehring, F. Stallmach, J. Kärger and U. Müller, J. Phys. Chem. Lett., 2012, 3, 930–933 CrossRef CAS PubMed; (c) F. Salles, H. Jobic, A. Ghoufi, P. L. Llewellyn, C. Serre, S. Bourrelly, G. Férey and G. Maurin, Angew. Chem., 2009, 121, 8485–8489 CrossRef; (d) A. I. Skoulidas, D. M. Ackerman, J. K. Johnson and D. S. Sholl, Phys. Rev. Lett., 2002, 89, 185901 CrossRef PubMed; (e) D. Frenkel and B. Smit, Understanding Molecular Simulation: from Algorithms to Applications, Academic Press, San Diego, USA, 2002 Search PubMed.
- (a) T. Darden, D. York and L. Pedersen, J. Chem. Phys., 1993, 98, 10089–10092 CrossRef CAS; (b) U. Essmann, L. Perera, M. L. Berkowitz, T. Darden, H. Lee and L. G. Pedersen, J. Chem. Phys., 1995, 103, 8577–8593 CrossRef CAS.
- D. Dubbeldam, S. Calero, D. E. Ellis and R. Q. Snurr, Mol. Simul., 2016, 42, 81–101 CrossRef CAS.
- S. L. Mayo, B. D. Olafson and W. A. Goddard, J. Phys. Chem., 1990, 94, 8897–8909 CrossRef CAS.
- A. K. Rappe, C. J. Casewit, K. S. Colwell, W. A. Goddard and W. M. Skiff, J. Am. Chem. Soc., 1992, 114, 10024–10035 CrossRef CAS.
- (a) A. O. Yazaydin, A. I. Benin, S. A. Faheem, P. Jakubczak, J. J. Low, R. R Willis and R. Q. Snurr, Chem. Mater., 2009, 21, 1425–1430 CrossRef CAS; (b) J. A. Greathouse and M. D. Allendorf, J. Am. Chem. Soc., 2006, 128, 10678–10679 CrossRef CAS PubMed; (c) J. R. Karra and K. S. Walton, Langmuir, 2008, 24, 8620–8626 CrossRef CAS PubMed; (d) Y.-S. Bae, C. Y. Lee, K. C. Kim, O. K. Farha, P. Nickias, J. T. Hupp, S. T. Nguyen and R. Q. Snurr, Angew. Chem., Int. Ed., 2012, 51, 1857–1860 CrossRef CAS PubMed; (e) S. Calero and P. Gómez-Álvarez, J. Phys. Chem. C, 2015, 119, 467–472 CrossRef CAS.
- J. Wang, R. M. Wolf, J. W. Caldwell, P. A. Kollman and D. A. Case, J. Comput. Chem., 2004, 25, 1157–1174 CrossRef CAS PubMed.
- S. Rick, J. Chem. Phys., 2004, 120, 6085–6093 CrossRef CAS PubMed.
- G. Kresse and J. Furthmüller, Phys. Rev. B: Condens. Matter Mater. Phys., 1996, 54, 11169–11186 CrossRef CAS.
- G. Kresse and J. Furthmüller, Comput. Mater. Sci., 1996, 6, 15–50 CrossRef CAS.
- G. Kresse and J. Hafner, Phys. Rev. B: Condens. Matter Mater. Phys., 1994, 49, 14251–14269 CrossRef CAS.
- G. Kresse and J. Hafner, Phys. Rev. B: Condens. Matter Mater. Phys., 1993, 47, 558–561 CrossRef CAS.
- J. P. Perdew, A. Ruzsinszky, G. I. Csonka, O. A. Vydrov, G. E. Scuseria, L. A. Constantin, X. Zhou and K. Burke, Phys. Rev. Lett., 2008, 100, 136406 CrossRef PubMed.
- C. Campañá, B. Mussard and T. K. Woo, J. Chem. Theory Comput., 2009, 5, 2866–2878 CrossRef PubMed.
- D. J. Tranchemontagne, J. R. Hunt and O. M. Yaghi, Tetrahedron, 2008, 64, 8553–8557 CrossRef CAS.
- C. J. Howard, B. A. Hunter and B. A. Rietica, A computer program for Rietveld analysis of X-ray and neutron powder diffraction patterns, Australian Nuclear Science and Technology Organization Lucas Heights Research Laboratories, 1998, pp. 1–27 Search PubMed.
- J. R. Macdonald, LEVM version 8.0 Complex Nonlinear Squares Fitting Program, University of North Carolina, North Carolina, 2003 Search PubMed.
- P. Lunkenheimer, S. Krohns, S. Riegg, S. G. Ebbinghaus, A. Reller and A. Loidl, Eur. Phys. J., 2009, 180, 61–89 Search PubMed.
- A. Von Hippel, Dielectrics and Waves, Artech House, Boston, 1995 Search PubMed.
- A. Loidl, S. Krohns, J. Hemberger and P. Lunkenheimer, J. Phys.: Condens. Matter, 2008, 20, 191001 CrossRef.
- J. F. Scott, J. Phys.: Condens. Matter, 2008, 20, 021001 CrossRef.
- D. C. Sinclair, T. B. Adams, F. D. Morrison and A. R. West, Appl. Phys. Lett., 2002, 80, 2153–2155 CrossRef CAS.
- H. P. Schwan, Interaction Mechanisms of Low-Level Electromagnetic Fields in Living Systems, Oxford University Press, Oxford, 1992 Search PubMed.
- E. Barsoukov and J. R. Macdonald, Impedance Spectroscopy Theory, Experiment, and Applications, John Wiley & Sons, Inc., Hoboken, New Jersey, 2005 Search PubMed.
Footnote |
| † Electronic supplementary information (ESI) available: Partial charges, MSD versus time graphics, XRPD Le Bail refinement at room temperature, TGA curves, IR spectra, probability and percentage of finding H2O molecules surrounding the open Co sites, the typical impedance complex plane plot at 350 K. See DOI: 10.1039/c6cp02477g |
| This journal is © the Owner Societies 2016 |