 Open Access Article
Molecular dynamics simulations and CD spectroscopy reveal hydration-induced unfolding of the intrinsically disordered LEA proteins COR15A and COR15B from Arabidopsis thaliana†
Carlos
Navarro-Retamal‡
a,
Anne
Bremer‡
b,
Jans
Alzate-Morales
a,
Julio
Caballero
a,
Dirk K.
Hincha
b,
Wendy
González
*a and
Anja
Thalhammer§
 *b
*b
aCenter for Bioinformatics and Molecular Simulations, Universidad de Talca, 2 Norte 685, Casilla 721, Talca, Chile. E-mail: wgonzalez@utalca.cl (Wendy González, for correspondence relating to protein modelling)
bMax-Planck-Institut für Molekulare Pflanzenphysiologie, Am Mühlenberg 1, D-14476 Potsdam, Germany
First published on 25th May 2016
Abstract
The LEA (late embryogenesis abundant) proteins COR15A and COR15B from Arabidopsis thaliana are intrinsically disordered under fully hydrated conditions, but obtain α-helical structure during dehydration, which is reversible upon rehydration. To understand this unusual structural transition, both proteins were investigated by circular dichroism (CD) and molecular dynamics (MD) approaches. MD simulations showed unfolding of the proteins in water, in agreement with CD data obtained with both HIS-tagged and untagged recombinant proteins. Mainly intramolecular hydrogen bonds (H-bonds) formed by the protein backbone were replaced by H-bonds with water molecules. As COR15 proteins function in vivo as protectants in leaves partially dehydrated by freezing, unfolding was further assessed under crowded conditions. Glycerol reduced (40%) or prevented (100%) unfolding during MD simulations, in agreement with CD spectroscopy results. H-bonding analysis indicated that preferential exclusion of glycerol from the protein backbone increased stability of the folded state.
Introduction
Intrinsically disordered proteins (IDPs) are defined by their lack of secondary structure in dilute aqueous solutions.1 They are highly abundant in nature. In fact, predictions suggest that more than 30% of all eukaryotic proteins are IDPs. They are not only involved in many biochemical networks, but many IDPs constitute central hubs in a multitude of signaling and regulatory cascades.2 IDPs exist as dynamic ensembles of a wide range of conformations. Although they are unstructured in isolation, many can adopt distinct secondary structure, e.g. upon interaction with specific binding partners or under crowded conditions.3 Due to their conformational flexibility it is difficult to experimentally assess the secondary structure and structural transitions of IDPs. Although major progress has been made in recent years using various spectroscopic approaches,3 it is still challenging to gather information on e.g. coupled folding and binding events at atomistic resolution.4 Moreover, NMR spectroscopy as the most widely used method for studying IDP structure has clear limitations in terms of experimental timescales. As IDPs are quickly and constantly swapping conformations, NMR (and all other spectroscopic) data display an average over the complete ensemble of conformations the protein adopted during sampling.5 Evidently, in silico approaches have the potential to provide additional knowledge at higher resolution on these rapid folding and unfolding events.4,6 In recent years, along with a swift increase in computational resources, molecular dynamics (MD) simulations have emerged as promising tools to characterize IDP structure–function relationships, as they are able to reach biologically relevant timescales. In this context, MD simulations are mostly used to complement experimental findings, as they are for example able to detect transient conformations occurring in an IDP during induced folding.7 However, next to structural information MD simulation can also provide access to the dynamic properties of a protein.8 Therefore, it is a powerful tool to provide novel, high-resolution information on rapid IDP folding and unfolding transitions.Two of the physiologically, functionally and structurally best characterized plant IDPs are Cold Regulated (COR) 15A and COR15B from the model plant Arabidopsis thaliana. Both belong to the group of late embryogenesis abundant (LEA) proteins that were first described over 30 years ago as a group of proteins that accumulate late in plant seed development.9 However, they are also abundant in vegetative plant tissues following environmental stresses such as drought, cold or high salinity.10 LEA proteins are not restricted to plants; multiple forms are expressed in desiccation-tolerant animals from at least four phyla.11 In the fully hydrated state, most LEA proteins are predominantly unstructured with a preponderance for random coil. While some LEA proteins seem to function as unstructured proteins,12 others can be induced to fold in the presence of artificial membranes13 or during dehydration.14 In the dry state, many LEA proteins fold into mainly α-helical structures (see ref. 15 for a review). This gain of structure is fully reversible upon rehydration.11
COR15A and COR15B are both cold induced nuclear encoded LEA proteins that are targeted to the chloroplast stroma via signal peptides.16–18 The respective genes share a sequence identity of 82%,19 while the amino acid sequence identity of the proteins is 77%. The mature proteins have a molecular mass of approximately 9 kDa.17,18,20 Overexpression of either COR15A or COR15B in A. thaliana significantly increases leaf freezing tolerance, while simultaneous RNAi silencing of both genes reduces freezing tolerance after cold acclimation.20,21 The physiological function of the COR15 proteins is the stabilization of chloroplast membranes, but not of soluble enzymes during freezing20 and the available data strongly suggest functional redundancy of the proteins.20
Both COR15 proteins are highly hydrophilic and predominantly unstructured in solution, but fold into amphipathic α-helices during drying or in the presence of high concentrations of low-molecular-mass crowding agents such as sucrose or glycerol.20,22 Due to their high conformational flexibility, no crystal structures are available for any LEA proteins and there are also no reported NMR spectra of COR15A or COR15B. Here, we investigated the hydration-dependent structural transitions of fully folded COR15A and COR15B using MD simulations. Quantitatively, the folded and unstructured fractions of the proteins in the dry and fully hydrated states, and in the presence of 40% and 100% glycerol were compared between the predictions from simulation and experimental data obtained by circular dichroism (CD) spectroscopy.22 In general, we found good agreement between the predicted and measured secondary structure content of the proteins.
Results
Determination of appropriate modeling conditions
Determination of the appropriate force field is a crucial step to obtain reliable MD simulation data. Therefore, four different force fields were analyzed. The analysis consisted of MD simulations of 20 ns of the COR15A protein in a water box in 10 replicates each, with either AmberGS,23 OPLS-AA,24–26 Charmm2727 or Gromos54a728 force fields. The Charmm27 force field tends to overestimate the importance of α-helical structures even when simulating the folding of β-sheet structures.29,30 The unfolding of COR15A could be observed during MD simulations using either the OPLS-AA or AmberGS force fields (Fig. S1, ESI†). Previously, helix descriptions obtained with these two force fields were found similar to those resulting from a more accurate quantum chemistry method.31 As the OPLS-AA force field was initially described for the analysis of interactions of proteins with different solvents,25 we used this force field for further MD simulations. This decision was further driven by the agreement of the simulations with the experimental data (see below).COR15A and COR15B form amphipathic helix–loop–helix structures in vacuum
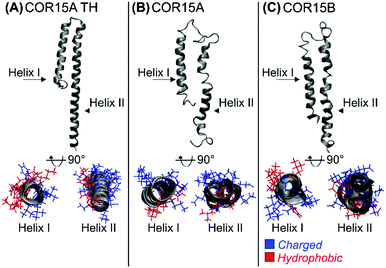
We built comparative homology models of COR15A and COR15B. To ensure sufficient quality of our models, we additionally produced a threading model of COR15A (COR15A-TH) that does not only rely on amino acid sequence similarity but rather on the structural information contained in the sequence. All models under vacuum are shown in Fig. 1.The stereo-chemical quality of all three models was analyzed with PROCHECK. Based on Ramachandran plots, 76.2% of COR15A, 74.7% of COR15B and 87.5% of COR15A-TH model structures were situated in preferential regions, while only 2.5%, 0% and 0% were placed in disallowed regions, respectively. The 3D models were also positively evaluated by ANOLEA analysis (Fig. S2, ESI†). The models indicate that both COR15 proteins form two α-helices with an amphipathic character in the dry state with the opposing polar and non-polar faces oriented along the longitudinal protein axes facing in different directions. In the homology models, the two helices are connected by a loop consisting of 22 and 17 residues in COR15A and COR15B, respectively, while in COR15-TH both helices are connected by a shorter loop of only three residues.
In the COR15A model, the fraction of hydrophobic and hydrophilic amino acids was 33% and 67% (helix I) and 49% and 51% (helix II), respectively. In the threading model COR15A-TH the fraction of hydrophobic and hydrophilic residues were 33% and 67% (helix I), identical to helix I of the homology model, and 36% and 64% (helix II), slightly more hydrophilic than helix II of the homology model. In the COR15B model, helix I had the same distribution as in the COR15A model, while helix II was more hydrophilic, with 29% hydrophobic and 71% hydrophilic residues.
COR15 proteins unfold in water
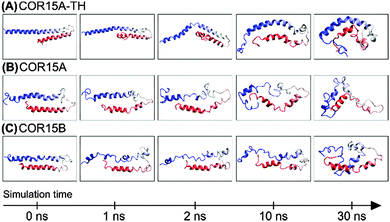
MD simulations, adding solvation, were carried out using the folded structures of COR15A-TH, COR15A and COR15B obtained in vacuo as starting points. These were equilibrated for 2 ns in water, keeping the protein models constrained to avoid untimely unfolding. Subsequently, protein unfolding in water was modeled for 30 ns by releasing the constraints (Fig. 2). Each simulation was done in 10 trajectories to ensure convergence of the system.Of the 89 amino acids comprising COR15A 45 were in α-helical conformation at the beginning of the production simulation. This number was reduced to 24 ± 2.2 after 30 ns of simulation. Similarly, of the 90 amino acids of COR15B, 44 were in α-helical conformation at the beginning of the production simulation, while after 30 ns, this number was reduced to 31 ± 2.9. In the case of COR15A-TH, the number of residues in α-helical conformation decreased from 73 to 37 ± 2.4 after the 30 ns simulation.
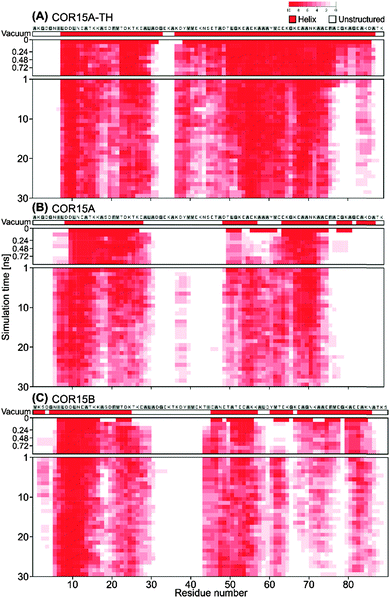
Fig. 2 shows the unfolding of COR15 proteins in water by means of configuration snapshots at selected time frames. Fig. 3 shows the same process at single-residue resolution, representing the results of 10 replicate simulations for each protein model. Notably, the unfolding process showed a rapid phase over the first 1–2 ns of MD simulation in COR15A and COR15B that can be clearly seen in both representations. The number of unstructured amino acid residues increased more slowly with proceeding simulation time in all three models.
This is in agreement with previous MD simulations reporting that protein unfolding can occur on a picosecond timescale.5,32,33 In all models, unfolding was more pronounced in helix II than in helix I.
In general, globular proteins are stabilized by a hydrophobic core.34–36 Our models imply that such a core is not a distinct feature of COR15A and COR15B as hydrophobic and hydrophilic amino acids are involved in unfolding in a similar ratio (Fig. S3, ESI†). This indicates a tendency of disorder of non-polar residues in the presence of a polar solvent. Therefore we suggest that the lack of a hydrophobic core in the COR15 proteins reduces the stability of the proteins and thus promotes their unfolding in water.
Structural alterations of the COR15 proteins during unfolding in water were further characterized by the calculated changes in the root-mean-square deviation (RMSD) of all atoms in the polypeptide backbone during the MD simulations. Representing the temporal fluctuation of the protein backbone, RMSD is a measure of protein structural flexibility.37
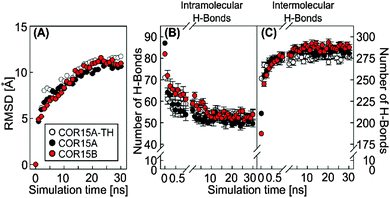
During simulation of COR15A-TH, COR15A and COR15B after release of the constraints in water, RMSD continuously increased until approximately 20 ns. After that the RMSD remained stable, indicating a convergence of all replicates (Fig. 4A). In parallel the potential energy was stable (Fig. S4, ESI†) showing that the system was in an energy minimum. These findings indicate increasing fluctuations of the peptide backbone during unfolding.
Breaking of intramolecular protein backbone H-bonds is a driving force for COR15 unfolding
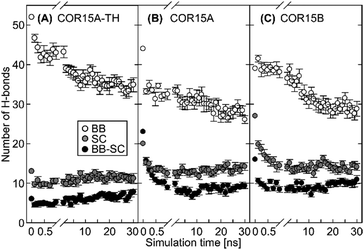
A key element in the formation and stabilization of protein secondary structure are H-bonds that typically form between the carbonyl oxygens and amide hydrogens of the protein backbone.38 MD simulations of COR15A-TH, COR15A and COR15B during unfolding in water showed alterations in the H-bonding patterns, namely a fast decrease of intramolecular (Fig. 4B) and a concomitant increase of intermolecular (i.e. protein–water) H-bonds (Fig. 4C). By the end of the 30 ns simulation, the number of intermolecular H-bonds had increased by 10% in COR15A-TH, 33% in COR15A and 53% in COR15B, while intramolecular H-bonds had decreased by 24%, 43% and 34% in COR15A-TH, COR15A and COR15B, respectively. The contribution of H-bonds established among backbone atoms was considerably larger than that among sidechain atoms and between sidechain and backbone atoms after solvent equilibration. These latter interactions were decreased by 32%, 40% and 26% in COR15A-TH, COR15A and COR15B during the simulation. H-bonds established between different amino acid sidechains and between sidechain and backbone atoms showed considerable fluctuation among the models during the MD simulations (Fig. 5).MD simulations show agreement with experimentally determined protein folding states
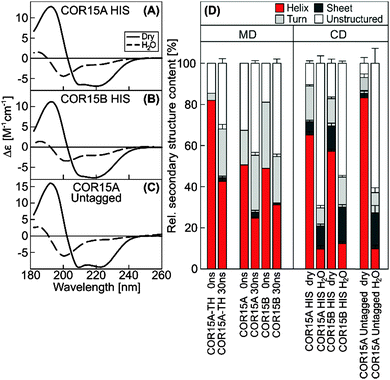
Secondary structure content of COR15A and COR15B was quantified in the fully hydrated and in the dry state using circular dichroism (CD) spectroscopy and compared to results from MD simulations (Fig. 6). During the simulations, the α-helix content of COR15A-TH decreased from 84% after solvent equilibration to 43% after 30 ns of simulation in water. The α-helix content of COR15A and COR15B similarly decreased from 46% to 25% and from 56% to 32%, respectively (Fig. 6D, left panel). Similarly, CD spectroscopy showed an α-helix content of the dry COR15 proteins of 65% and 55%, while in the fully hydrated state, the α-helix content was decreased to about 10%22 (Fig. 6D, right panel). These data were collected using recombinant COR15A and COR15B carrying a 6x N-terminal histidine (HIS) tag, while MD simulations were carried out on untagged proteins. It was therefore possible that the HIS-tag influenced the folding behavior of the recombinant proteins. To test this, we produced untagged recombinant COR15A protein in E. coli (Fig. S5, ESI†) and assessed the secondary structure of the purified protein by CD spectroscopy (Fig. 6C). This analysis showed that the α-helix content of COR15A was not significantly influenced by the presence of the HIS-tag and that the MD simulations were in qualitative agreement with the secondary structure of both tagged and untagged proteins, although the simulations slightly underestimated the degree of unfolding of the proteins in water.The folding state of COR15 proteins is strongly influenced by crowding
Reversible folding of LEA proteins during complete drying could have biological relevance in anhydrobiotic organisms and plant seeds that survive almost complete dehydration. However, COR15 proteins have no role in anhydrobiosis, but rather need to function under partially dehydrated conditions, brought about by freezing of leaves in a physiological temperature range.Under these conditions water is partially removed from the cells due to ice formation in the intercellular spaces leading to increased intracellular solute concentrations. Accordingly, both proteins show partial folding into α-helices in 50% (v/v) glycerol or 2 M sucrose.20
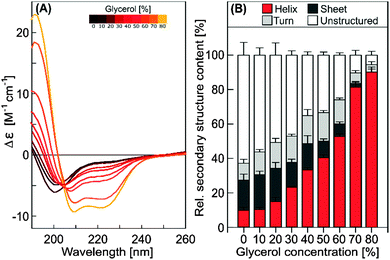
To characterize this crowding-induced folding further, the dependence on glycerol concentration was experimentally assessed by CD spectroscopy for untagged COR15A (Fig. 7).
The data indicate that the α-helix content of COR15A increased linearly with increasing glycerol concentration (r = 0.959, p < 0.0001). With almost 90% α-helicity, it reached a putative folding maximum also obtained in 50% (v/v) trifluorethanol20 at about 80% (v/v) glycerol, which was the highest experimentally accessible concentration.
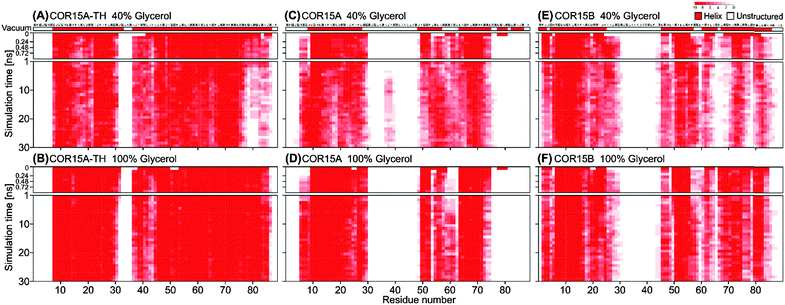
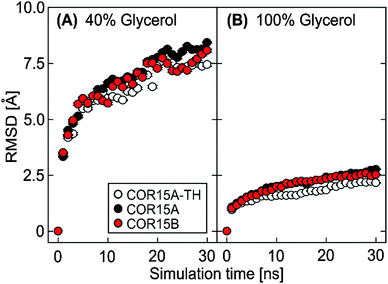
MD simulations of both folded COR15 proteins in 40% and 100% glycerol were carried out to monitor the influence of the hydration state on protein unfolding (Fig. 8). In the presence of 40% glycerol, unfolding of COR15A-TH, COR15A and COR15B still proceeded over time (Fig. 8A, C and E), although it was strongly decreased compared to unfolding in water (Fig. 3).
Similar to the simulations in water, RMSD continuously increased in both solvent conditions until approximately 20 ns. After that the RMSD remained stable, again indicating a convergence of all replicates (Fig. 9). Notably, the overall RMSD magnitude decreased from the simulations in water, reaching a minimum in 100% glycerol. This indicates reduced fluctuations of the peptide backbone during unfolding with increasing glycerol concentration.
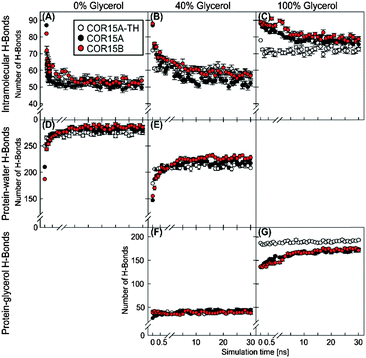
To clarify whether the increased protein stability in glycerol was due to direct interaction of the solute with the protein, we analyzed the H-bonding patterns derived from MD simulations (Fig. 10).
In pure water (0% glycerol), unfolding was accompanied by an increase of protein–water (Fig. 10D) and a concomitant decrease in intra-protein H-bonds (Fig. 10A, compare also Fig. 4). Intra-protein H-bonds decreased slightly less over time in 40% glycerol (Fig. 10B) but were hardly affected in 100% glycerol (Fig. 10C) in agreement with the experimentally observed folding of COR15 proteins in increasing glycerol concentrations (Fig. 7).
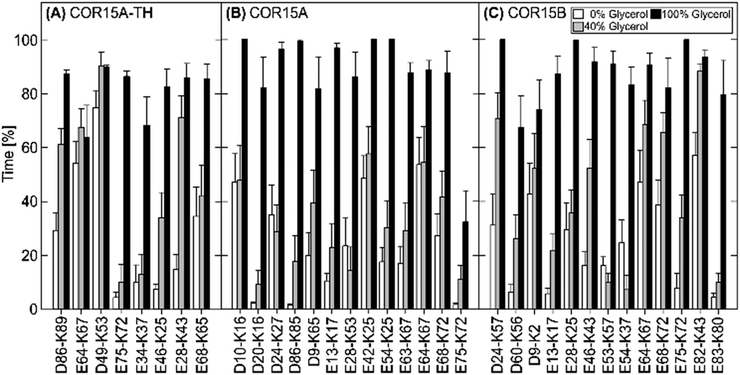
The number of protein–water H-bonds, on the other hand, was much lower in 40% glycerol than in pure water (Fig. 10E). However, this was not accompanied by an increase in protein–glycerol H-bonds (Fig. 10F), indicating exclusion of the osmolyte from the protein. Only in pure glycerol, a relevant number of H-bonds between glycerol and the proteins were formed (Fig. 10G), mostly by amino acid sidechains (Fig. S6, ESI†). However, almost all protein intramolecular H-bonds were preserved during the simulation in 100% glycerol, in agreement with a maximum α-helix formation under this condition. Several publications have demonstrated the importance of salt bridges (SB) for the stability of protein secondary and tertiary structure.39–42Fig. 11 shows the stability of the 8, 13 and 13 SBs that were identified in COR15A-TH/COR15A/COR15B models in vacuum during the MD simulations. Under fully hydrated conditions, COR15A-TH retained only two SBs (GLU64-LYS67, ASP49-LYS53) with a lifetime longer than 50% of the 30 ns MD simulation. Only one of these two SBs was also retained in the COR15A model (GLU64-LYS67), and also one SB (GLU82-LYS43) showed this degree of stability in COR15B, indicating that water strongly competes with the interactions between charged amino acids. Increasing the concentration of glycerol to 40% lead to an increase in the number of SBs with a lifetime longer than 50% of the 30 ns MD simulation in COR15A-TH to four, in COR15A to two, while the number of stable SBs increased to six in COR15B. In 100% glycerol, all eight SBs of COR15A-TH, 12 out of the 13 SBs of COR15A and all 13 SBs of COR15B remained stable during the simulation, indicating that the increased stability of both proteins is accompanied by an increase in the number of stable SBs.
Discussion
Most LEA proteins are predicted to be IDPs in the fully hydrated state and show reversible folding, mainly into α-helices, during drying.15 However, partial dehydration, e.g. during slow environmental drying or during extracellular freezing, may be physiologically more relevant than a completely anhydrous state often used experimentally. Partial dehydration will lead to an increased concentration of all cellular constituents, i.e. increased molecular crowding. Only very little information is available on the mechanisms and driving forces that determine structural equilibria in LEA proteins under physiologically relevant conditions of partial dehydration.Only one study has previously investigated the hydration-dependent unfolding of a LEA protein using MD simulations.43 However, a 66 amino acid fragment of a 143 amino acid LEA protein from an anhydrobiotic nematode was used for modeling instead of a full-length protein. Further, unfolding was simulated in the presence of different amounts of water, but no crowding agent was present. In addition, no experimental data on the folding state of this fragment were reported, preventing an independent verification of the computational results. In the present study, we have used the full-length sequences of two LEA proteins for the simulation of unfolding kinetics both in the presence of pure water and of two concentrations of glycerol as a model crowding agent. Structural predictions from these simulations were directly compared to experimental data.
Simulation studies with IDPs are faced with unique problems. The unfolded state of an IDP can not be used as the starting point to model its folding, because ab initio modeling of the unfolded state is not possible, as it consists of a fluctuating ensemble of a large number of alternative conformations.44 The only solution is therefore to start from the folded state and model its unfolding under different conditions. However, since IDPs do not crystallize, no X-ray structures are available for LEA proteins that could be used as a template to simulate the structure of the dry proteins. Therefore, we used a comparative modeling approach, based on previous in silico predictions of the secondary structure of COR15A and B,22 indicating that both proteins form two amphipathic α-helices in a helix–loop–helix configuration. Similar to the previous MD simulation study,43 we used human apolipoprotein A–I25 as template to model the structure of the COR15 proteins in vacuo, thereby mimicking the dry state. Additionally, a threading model was built on the crystal structure of a computationally designed helix bundle as template. The results of our MD simulations were in agreement with the experimentally determined secondary structure content of the proteins in the dry state, confirming the appropriateness of both types of models. It should be pointed out that we observed quantitative differences in helix content both experimentally between the tagged and untagged COR15A and computationally between COR15A and COR15A-TH.
A 30 ns MD simulation was used to analyze the unfolding of COR15A-TH, COR15A and COR15B in water. The changes in helicity of COR15A and COR15B during these simulations were in agreement with the experimental data for both proteins, confirming the choice of the proper force field. However, these comparisons between spectroscopic and simulation data were potentially confounded by the use of an N-terminal 6xHIS-tag on the recombinant proteins.45 Therefore, we also analyzed recombinant COR15A expressed without a tag. Secondary structure content was essentially the same for the tagged and untagged protein in the fully hydrated state and slightly higher in the dry state for the untagged protein, confirming the validity of both our earlier spectroscopic data and the present MD simulation results. Reports of an impact of tags on recombinant proteins have been mainly related to an influence on disulfide-bonding patterns,46 conformational changes of DNA-binding sites47 or changes in enzyme function, which are all not relevant for the analysis of COR15 proteins. Moreover, there are also studies reporting a lack of a strong influence of HIS-tags on protein structure.48,49
A previous MD simulation study identified H-bonding interactions as the major factor for the structural stability of a LEA protein in vacuo, with binding energies of protein–water interactions between 20 and 100 kJ mol−1.43 LEA protein unfolding in water might be easily attributed to the high fraction of polar and charged amino acids, which could H-bond more readily to water molecules than to the sidechains of other amino acids. However, the unfolding of COR15A-TH, COR15A and COR15B in water was mediated by H-bonding interactions between water molecules and the protein backbone as well as with protein sidechains (Fig. S7, ESI†). The breaking of intramolecular peptide H-bonds has previously been identified as a key step in protein unfolding.50,51 Unfolding of the COR15 proteins was accompanied by a break of intramolecular H-bonds. Interestingly, the contribution of backbone H-bonds to that process was much higher than the contribution of sidechain and sidechain–backbone H-bonds.
Moreover, a vast majority of SBs was lost during the MD simulations in water, indicating that unfolding of the COR15 proteins is accompanied by a decreased lifespan of SBs between amino acids, suggesting successful competition of water molecules for binding to charged amino acid sidechains. However, with 2–20 kJ mol−1,52 the contribution of SBs to protein stability is much smaller than that of backbone H-bonding interactions. Therefore we consider them as an excellent indicator for protein flexibility52 rather than a major contributor to protein stability.
COR15A and COR15B are highly similar and therefore only small differences were observed during unfolding in water. While the sequences of helix I are identical between the two proteins,22 helix II of COR15B is more hydrophilic than helix II of COR15A. This may account for the larger decompaction of helix II in COR15B than in COR15A during the simulation. However, these differences were not reflected in the spectroscopic data making an impact on protein function unlikely. This is in agreement with the presumed functional redundancy of both proteins.20 Considering that COR15A-TH was built with a different method, it is important to note that the degree of unfolding in water was very similar to the comparative models.
Crowding conditions may impact the folding behavior of IDPs, as the folding free energy landscape of proteins is changed in a crowded environment.53 In general, macromolecular crowding due to the presence of high concentrations of other, globular proteins has only little effect on IDP structure.54,55 In addition, in some plant LEA proteins osmolyte-induced crowding was also ineffective to induce folding.12 For COR15A and COR15B, however, partial folding was observed by CD and FTIR spectroscopy in the presence of 2 M sucrose or 50% glycerol,20 indicating the propensity of these proteins to fold under mild dehydration conditions. Such osmolytes have been shown to model cellular crowding conditions reasonably well.56
Here, we have extended these earlier observations to a wide range of glycerol concentrations (up to 80% v/v) for untagged COR15A. Folding was linearly dependent on the glycerol concentration, in agreement with published observations for other proteins and osmolytes.57 The MD simulations are in agreement with these spectroscopic data. Unfolding of both COR15 proteins was strongly reduced in 40% glycerol compared to unfolding in pure water, while the folded state was completely stable in pure glycerol.
This stability was not only reflected in the increased lifetime of intra-protein salt bridges but also in the stability of intra-molecular H-bonds in pure glycerol. Interestingly, after transfer from vacuum to 40% glycerol, new protein H-bonds were predominantly established with the available water molecules, while the number of protein–glycerol H-bonds remained small throughout the simulation. This indicates that water is preferred over glycerol due to its higher polarity.58 Protein H-bonds to glycerol were more numerous in the absence of water (100% glycerol), but they were restricted to surface-exposed amino acid sidechains of the folded protein, as the number of intramolecular H-bonds was stable during the 30 ns simulation. These findings point to an exclusion of the osmolyte from the protein backbone, either due to a solvophobic effect51,59 or to steric exclusion.60 Vagenende et al.61 proposed that although glycerol molecules possess three hydroxyl groups that could interact with the protein, the molecule is too bulky to interact directly with the backbone of proteins explaining why in the presence of glycerol no unfolding occurred. Instead, in 40% glycerol, the co-solvent molecules are depleted near the protein surface (Fig. S8, ESI†) and enriched in a region about 5 to 7 Å from the proteins. This unequal distribution of water and glycerol leads to a more compact conformation and a higher stability of the COR15 proteins.
The molecular function of COR15 proteins is the stabilization of cellular membranes during freezing.20 The amphipathic helices formed by the proteins are expected to enable protein–membrane interactions through the hydrophobic face of the helices. In general, IDPs function either as entropic chains in the unstructured state, or follow a molecular recognition mechanism, where folding is triggered upon binding to a partner molecule. In the latter case, IDPs undergo either binding-induced folding, i.e. target binding is a necessary requirement for folding, or folding precedes binding, a mechanism known as conformational selection.62 However, folding of the COR15 proteins does not strictly follow either of these routes, but rather an “initial crowding-induced folding > membrane binding > enhanced folding” pathway.63 The COR15 proteins partially fold into amphipathic α-helices during freezing. Only in this partially-folded conformation that can be induced by freezing in vivo or by osmolytes in vitro (referred to in the term “crowding-induced folding”), are they able to interact with membranes. Membrane binding will then enhance protein folding further. Future efforts will be directed towards a further experimental and computational characterization of this crowding-induced folding and binding mechanism and its effect on membrane structure and stability under stress conditions.
Experimental
Molecular modeling
Using the comparative modeling method,64 the structures of the mature COR15A and COR15B proteins in vacuum were obtained with the Internal Coordinate Mechanics (ICM) software65 using the amino acid sequences from the TAIR (http://www.arabidopsis.org) database (Gene IDS: At2g42450 and At2g42530, respectively). The X-ray structure of human apolipoprotein A–I (PDB ID 2A01; http://www.pdb.org)43 served as template. A moving window containing previously predicted COR15 α-helical domains22 was fitted to the template sequence, screening for the highest sequence identity between COR15A/COR15B and 2A01. With 12% identity for COR15A and 9% identity for COR15B this was obtained for the helix1–turn–helix2 region of 2A01.The webserver RaptorX (http://raptorx.uchicago.edu/) was used to build the threading model of COR15A (COR15A-TH). Relative and absolute global model quality was confirmed with a p-value of 1.11 × 10−02![[thin space (1/6-em)]](https://www.rsc.org/images/entities/char_2009.gif) 66 and a GDT (Global Distance Test) of 39, stating a good relationship between the modeling of a residue and its associated error (in Å).67 As template we used the crystal structure of a computationally designed three-helix bundle.66 All models were optimized in vacuum with the Gromacs software version 4.6.368 using 65
66 and a GDT (Global Distance Test) of 39, stating a good relationship between the modeling of a residue and its associated error (in Å).67 As template we used the crystal structure of a computationally designed three-helix bundle.66 All models were optimized in vacuum with the Gromacs software version 4.6.368 using 65![[thin space (1/6-em)]](https://www.rsc.org/images/entities/char_2009.gif) 000 steps of energy minimization with the Conjugated Gradient algorithm and the OPLS-AA force field.24–26 The accuracy of the models was evaluated with ANOLEA69,70 and PROCHECK.71
000 steps of energy minimization with the Conjugated Gradient algorithm and the OPLS-AA force field.24–26 The accuracy of the models was evaluated with ANOLEA69,70 and PROCHECK.71
Molecular dynamics simulation
To model the effects of cellular hydration level on COR15 protein unfolding, MD simulations were performed on glycerol–water mixtures. Solvent cubic boxes (15 Å from the protein to the respective axis) containing different fractions of glycerol and water were built (100% water–0% glycerol, 60% water–40% glycerol and 0% water–100% glycerol (all % v/v)) following Egorov et al.72 using TIP4P73 as water model. For the glycerol–water mixtures without protein, 100 ns MD simulations were performed to equilibrate the solvent boxes, followed by another 100 ns MD simulation of production. During the production step the density of glycerol–water mixtures was evaluated as a measure of compatibility with previous theoretical and experimental data (Table S1, ESI†). Subsequently, COR15A/COR15B models were solvated by replicating the solvent boxes around a protein molecule using the genbox tool implemented in Gromacs 4.6.3.68 To equilibrate the protein–solvent system, two equilibration steps were performed, 1 ns of energy equilibration in an ensemble keeping the number of particles, volume and temperature (NVT) constant and a second ns of energy equilibration in an ensemble keeping the number of particles, pressure and temperature (NPT) constant. During the equilibration steps, protein models were kept constrained to avoid untimely unfolding. 10 MD production simulation replicates of 30 ns were performed in the NPT ensemble. Periodic boundary conditions and a time step of 2 fs with a 10 Å spherical cut-off for non-bonding interactions and a switching function of 10 Å for van der Waals terms were used in all simulations. To approximate the experimental conditions where measurements were done in pure water or water/glycerol mixtures, only six sodium ions were added to the aqueous phase to obtain a neutral net charge in the system. The MD simulations were performed using Gromacs version 4.6.368 and the OPLS-AA force field.24–26The secondary structure content was calculated using the DSSP algorithm74 implemented in Gromacs. Root mean square deviation (RMSD) was calculated as described previously.75 The criteria for H-bond formation were a distance between the donor and acceptor atoms shorter than 3.5 Å and a bond angle higher than 120°.43 The salt bridges module of VMD version 1.9.176 was used to determine the number of salt bridges (SB) with an oxygen–nitrogen distance cut-off of 3.2 Å.
Cloning, expression and purification of recombinant COR15A and COR1B
Full-length cDNA clones were obtained from the RIKEN (Tokyo, Japan) RAFL collection77,78 for the Arabidopsis thaliana genes COR15A (At2g42540; clone RAFL09-47-C04) and COR15B (At2g42530; clone RAFL05-20-N18). The cDNA sequences encoding the mature proteins lacking the N-terminal signal peptides were amplified by PCR.To obtain untagged COR15A, the respective cDNA was cloned into the pETite N-HIS Kan SUMO vector (Lucigen; http://www.lucigen.com). The identity of the inserts was checked by sequencing. The vector containing the COR15A gene was expressed in the Escherichia coli strain Rosetta (DE3) pLys S (Novagen, Madison, WI). As COR15A, like most other LEA proteins, remains soluble upon boiling,17 bacterial cell lysates were incubated in a water bath at 100 °C for 10 min. Precipitated proteins were removed by centrifugation (4500g, 45 min, 4 °C). The supernatant was filtered through a 0.2 μm filter and applied to a 5 ml HIS Trap HP column (GE Healthcare; http://www3.gehealthcare.com). The column was equilibrated with 20 mM sodium phosphate, 0.5 M NaCl and 20 mM imidazole (pH 7.4) and washed with increasing concentrations of imidazole. COR15A was eluted with 250 mM imidazole and subsequently dialyzed twice against cleavage buffer (20 mM Tris/HCl (pH 8.0), 150 mM NaCl, 10% glycerol) overnight at 4 °C. The SUMO-6xHIS-tag was removed by proteolytic cleavage according to manufacturer’s instructions. Protein solution was applied to a 5 ml HISTrap HP column to remove the free SUMO-6xHIS-tag and the protease from the untagged COR15A. Column washing and elution of bound protein was done as described above. Fractions were analyzed by SDS-PAGE and those containing pure COR15A protein were pooled and dialyzed against ddH2O (molecular mass cut-off of dialysis membranes 3500 Da; Spectrumlabs; http://de.spectrumlabs.com). Purified COR15A was lyophilized and stored at −20 °C.
Mature 6xHIS-tagged COR15A and COR15B were cloned, expressed and purified as described earlier.22
SDS-PAGE and western blotting
SDS-PAGE was performed according to the method of Schägger and von Jagow.79 After electrophoresis proteins were stained with colloidal Coomassie blue. Western blotting was performed as described recently20 using an antibody raised against recombinant COR15A,17 kindly provided by Prof. Michael F. Thomashow, Michigan State University, USA.CD spectroscopy
CD spectra were recorded with a Jasco-815 spectropolarimeter (http://www.jascoinc.com/) as described in detail previously.18,22 CD spectra were analyzed with the CDPro software80 using the three algorithms CDSSTR, CONTINLL and SELCON3 containing sets of reference spectra including those of denatured proteins. Three replicates were averaged for each experimental condition.Conclusion
This work provides computational analyses of the unfolding process of full-length COR15A and COR15B in differentially hydrated environments, supported by experimental data. It provides and validates homology and threading models of the folded COR15 proteins in vacuo and shows their unfolding process in water by molecular dynamics simulations at atomistic resolution. It further shows how the COR15 proteins are stabilized in the presence of different concentrations of the osmolyte glycerol, modeling conditions of intracellular crowding. These simulations are validated by CD spectroscopy monitoring the COR15A folding state in different glycerol concentrations. MD analysis of H-bonding interactions between protein and solvent molecules determines interactions of the protein backbone with surrounding water molecules as a major driving force for protein unfolding. The osmolyte competing for these interactions is preferentially excluded from the protein surface, explaining the increased protein stability in a crowded system. This study provides a model system which will help to deepen the understanding of LEA protein structural properties and will additionally be useful for structural studies of so far uncharacterized LEA proteins.Acknowledgements
This project was financially supported by the grant REDES 120019 of the Chilean National Commission for Scientific and Technological Research (CONICYT), the Fondecyt Grant 1140624 and the Max-Planck Society. AB gratefully acknowledges a PhD fellowship from the University of Potsdam. CNR thanks the Government of Chile for a PhD fellowship awarded through CONICYT.References
- M. M. Babu, R. van der Lee, N. S. Sanchez de Groot and J. Gsponer, Curr. Opin. Struct. Biol., 2011, 21, 432 CrossRef CAS PubMed.
- J. Gsponer and M. M. Babu, Prog. Biophys. Mol. Biol., 2009, 99, 94 CrossRef CAS PubMed.
- J. Habchi, P. Tompa, S. Longhi and V. N. Uversky, Chem. Rev., 2014, 114, 6561 CrossRef CAS PubMed.
- C. M. Baker and R. B. Best, Wiley Interdiscip. Rev.: Comput. Mol. Sci., 2014, 4, 182 CrossRef CAS.
- E. A. Cino, J. Wong-ekkabut, M. Karttunen and W.-Y. Choy, PLoS One, 2011, 6, e27371 CAS.
- X. Chu, L. Gan, E. Wang and J. Wang, Proc. Natl. Acad. Sci. U. S. A., 2013, 110, E2342 CrossRef CAS PubMed.
- J. Higo and K. Umezawa, in Protein Conformational Dynamics, ed. K.-I. Han, X. Zhang and M.-J. Yang, Springer International Publishing, 2014, vol. 805, p. 331 Search PubMed.
- K. Lindorff-Larsen, N. Trbovic, P. Maragakis, S. Piana and D. E. Shaw, J. Am. Chem. Soc., 2012, 134, 3787 CrossRef CAS PubMed.
- L. Dure, S. C. Greenway and G. A. Galau, Biochemistry, 1981, 20, 4162 CrossRef CAS PubMed.
- M. Hundertmark and D. K. Hincha, BMC Genomics, 2008, 9, 118 CrossRef PubMed.
- S. C. Hand, M. A. Menze, M. Toner, L. Boswell and D. Moore, Annu. Rev. Physiol., 2011, 73, 115 CrossRef CAS PubMed.
- J.-M. Mouillon, S. K. Eriksson and P. Harryson, Plant Physiol., 2008, 148, 1925 CrossRef CAS PubMed.
- M. C. Koag, R. D. Fenton, S. Wilkens and T. J. Close, Plant Physiol., 2003, 131, 309 CrossRef CAS PubMed.
- M.-D. Shih, T.-Y. Hsieh, T.-P. Lin, Y.-I. C. Hsing and F. A. Hoekstra, Plant Cell Physiol., 2010, 51, 395 CrossRef CAS PubMed.
- D. K. Hincha and A. Thalhammer, Biochem. Soc. Trans., 2012, 40, 1000 CrossRef CAS PubMed.
- A. Candat, P. Poupart, J.-P. Andrieu, A. Chevrollier, P. Reynier, H. Rogniaux, M.-H. Avelange-Macherel and D. Macherel, Anal. Biochem., 2013, 434, 44 CrossRef CAS PubMed.
- C. Lin and M. F. Thomashow, Plant Physiol., 1992, 99, 519 CrossRef CAS PubMed.
- K. Nakayama, K. Okawa, T. Kakizaki, T. Honma, H. Itoh and T. Inaba, Plant Physiol., 2007, 144, 513 CrossRef CAS PubMed.
- K. S. Wilhelm and M. F. Thomashow, Plant Mol. Biol., 1993, 23, 1073 CrossRef CAS PubMed.
- A. Thalhammer, G. Bryant, R. Sulpice and D. K. Hincha, Plant Physiol., 2014, 166, 190 CrossRef PubMed.
- N. N. Artus, M. Uemura, P. L. Steponkus, S. J. Gilmour, C. Lin and M. F. Thomashow, Proc. Natl. Acad. Sci. U. S. A., 1996, 93, 13404 CrossRef CAS.
- A. Thalhammer, M. Hundertmark, A. V. Popova, R. Seckler and D. K. Hincha, Biochim. Biophys. Acta, 2010, 1798, 1812 CrossRef CAS PubMed.
- A. E. Garcia and K. Y. Sanbonmatsu, Proc. Natl. Acad. Sci. U. S. A., 2002, 99, 2782 CrossRef CAS PubMed.
- W. L. Jorgensen, D. S. Maxwell and J. Tirado-Rives, J. Am. Chem. Soc., 1996, 118, 11225 CrossRef CAS.
- W. L. Jorgensen and J. Tirado-Rives, J. Am. Chem. Soc., 1988, 110, 1657 CrossRef CAS.
- G. A. Kaminski, R. A. Friesner, J. Tirado-Rives and W. L. Jorgensen, J. Phys. Chem. B, 2001, 105, 6474 CrossRef CAS.
- A. D. Mackerell, M. Feig and C. L. Brooks, J. Comput. Chem., 2004, 25, 1400 CrossRef CAS PubMed.
- N. Schmid, A. P. Eichenberger, A. Choutko, S. Riniker, M. Winger, A. E. Mark and W. F. van Gunsteren, Eur. Biophys. J., 2011, 40, 843 CrossRef CAS PubMed.
- E. A. Cino, W.-Y. Choy and M. Karttunen, J. Chem. Theory Comput., 2012, 8, 2725 CrossRef CAS PubMed.
- M. D. Smith, S. R. Jampani, E. Segelken and L. R. C. Cruz, J. Chem. Inf. Model., 2015, 55, 12 CrossRef PubMed.
- E. Penev, J. Ireta and J.-E. Shea, J. Phys. Chem. B, 2008, 112, 6872 CrossRef CAS PubMed.
- D. P. Tieleman, M. S. P. Sansom and H. J. C. Berendsen, Biophys. J., 1999, 76, 40 CrossRef CAS PubMed.
- J. Tirado-Rives and W. L. Jorgensen, Biochemistry, 1991, 30, 3864 CrossRef CAS PubMed.
- M. Munson, S. Balasubramanian, K. G. Fleming, A. D. Nagi, R. O’Brien, J. M. Sturtevant and L. Regan, Protein Sci., 1996, 5, 1584 CrossRef CAS PubMed.
- A. Nicholls, K. A. Sharp and B. Honig, Proteins: Struct., Funct., Bioinf., 1991, 11, 281 CrossRef CAS PubMed.
- N. E. Zhou, C. M. Kay and R. S. Hodges, Biochemistry, 1993, 32, 3178 CrossRef CAS PubMed.
- V. Daggett and M. Levitt, J. Mol. Biol., 1992, 223, 1121 CrossRef CAS PubMed.
- P. Tompa, Structure and function of intrinsically disordered proteins, Taylor & Francis, Boca Raton, 2010 Search PubMed.
- A. Bierzynski, P. S. Kim and R. L. Baldwin, Proc. Natl. Acad. Sci. U. S. A., 1982, 79, 2470 CrossRef CAS.
- Z. S. Hendsch and B. Tidor, Protein Sci., 1994, 3, 211 CrossRef CAS PubMed.
- G. I. Makhatadze, V. V. Loladze, D. N. Ermolenko, X. Chen and S. T. Thomas, J. Mol. Biol., 2003, 327, 1135 CrossRef CAS PubMed.
- S. Marqusee and R. T. Sauer, Protein Sci., 1994, 3, 2217 CrossRef CAS PubMed.
- D. Li and X. He, Biomacromolecules, 2009, 10, 1469 CrossRef CAS PubMed.
- A. Battisti and A. Tenenbaum, Mol. Simul., 2012, 38, 139 CrossRef CAS.
- F. Khan, P. M. Legler, R. M. Mease, E. H. Duncan, E. S. Bergmann-Leitner and E. Angov, Biotechnol. J., 2012, 7, 133 CrossRef CAS PubMed.
- J. Klose, N. Wendt, S. Kubald, E. Krause, K. Fechner, M. Beyermann, M. Bienert, R. Rudolph and S. Rothemund, Protein Sci., 2004, 13, 2470 CrossRef CAS PubMed.
- A. Chant, C. M. Kraemer-Pecore, R. Watkin and G. G. Kneale, Protein Expression Purif., 2005, 39, 152 CrossRef CAS PubMed.
- M. Carson, D. H. Johnson, H. McDonald, C. Brouillette and L. J. DeLucas, Acta Crystallogr., Sect. D: Biol. Crystallogr., 2007, 63, 295 CrossRef CAS PubMed.
- G. Widakowich, C. Zhang, S. Harris, K. Mitri, G. Powers, K.-S. Troung and M. T. W. Hearn, Biotechnol. Prog., 2011, 27, 1048 CrossRef CAS PubMed.
- P. Csermely, Cell. Mol. Biol., 2001, 47, 791 CAS.
- D. W. Bolen and G. D. Rose, Annu. Rev. Biochem., 2008, 77, 339 CrossRef CAS PubMed.
- I. Jelesarov and A. Karshikoff, in Protein Structure, Stability, and Interactions; ed. J. W. Shriver, Humana Press, 2009, vol. 490, p. 227 Search PubMed.
- H.-X. Zhou, FEBS Lett., 2013, 587, 1053 CrossRef CAS PubMed.
- D. P. Goldenberg and B. Argyle, Biophys. J., 2014, 106, 905 CrossRef CAS PubMed.
- C. Szasz, A. Alexa, K. Toth, M. Rakacs, J. Langowski and P. Tompa, Biochemistry, 2011, 50, 5834 CrossRef CAS PubMed.
- P. Selenko, Z. Serber, B. Gadea, J. Ruderman and G. Wagner, Proc. Natl. Acad. Sci. U. S. A., 2006, 103, 11904 CrossRef CAS PubMed.
- I. V. Baskakov and D. W. Bolen, J. Biol. Chem., 1998, 273, 4831 CrossRef CAS PubMed.
- T. O. Street, D. W. Bolen and G. D. Rose, Proc. Natl. Acad. Sci. U. S. A., 2006, 103, 17064 CrossRef CAS PubMed.
- D. W. Bolen and I. V. Baskakov, J. Mol. Biol., 2001, 310, 955 CrossRef CAS PubMed.
- P. R. Davis-Searles, A. J. Saunders, D. A. Erie, D. J. Winzor and G. J. Pielak, Annu. Rev. Biophys. Biomol. Struct., 2001, 30, 271 CrossRef CAS PubMed.
- V. Vagenende, M. G. S. Yap and B. L. Trout, Biochemistry, 2009, 48, 11084 CrossRef CAS PubMed.
- P. Tompa, Trends Biochem. Sci., 2012, 37, 509 CrossRef CAS PubMed.
- A. Thalhammer and D. K. Hincha, Plant Signaling Behav., 2014, 9, e977722 CrossRef PubMed.
- F. Eisenmenger, P. Argos and R. Abagyan, J. Mol. Biol., 1993, 231, 849 CrossRef CAS PubMed.
- R. Abagyan, M. Totrov and D. Kuznetsov, J. Comput. Chem., 1994, 15, 488 CrossRef CAS.
- P.-S. Huang, G. Oberdorfer, C. Xu, X. Y. Pei, B. L. Nannenga, J. M. Rogers, F. DiMaio, T. Gonen, B. Luisi and D. Baker, Science, 2014, 346, 481 CrossRef CAS PubMed.
- M. Källberg, H. Wang, S. Wang, J. Peng, Z. Wang, H. Lu and J. Xu, Nat. Protoc., 2012, 7, 1511 CrossRef PubMed.
- S. Pronk, S. Páll, R. Schulz, P. Larsson, P. Bjelkmar, R. Apostolov, M. R. Shirts, J. C. Smith, P. M. Kasson, D. van der Spoel, B. Hess and E. Lindahl, Bioinformatics, 2013, 29, 845 CrossRef CAS PubMed.
- F. Melo and E. Feytmans, J. Mol. Biol., 1997, 267, 207 CrossRef CAS PubMed.
- F. Melo and E. Feytmans, J. Mol. Biol., 1998, 277, 1141 CrossRef CAS PubMed.
- R. A. Laskowski, J. A. C. Rullmann, M. W. MacArthur, R. Kaptein and J. M. Thornton, J. Biomol. NMR, 1996, 8, 477 CrossRef CAS PubMed.
- A. V. Egorov, A. P. Lyubartsev and A. Laaksonen, J. Phys. Chem. B, 2011, 115, 14572 CrossRef CAS PubMed.
- W. Jorgensen, J. Chandrasekhar, J. Madura, R. Impey and M. Klein, J. Chem. Phys., 1983, 79, 926 CrossRef CAS.
- W. Kabsch and C. Sander, Biopolymers, 1983, 22, 2577 CrossRef CAS PubMed.
- C. H. Suresh, A. M. Vargheese, K. P. Vijayalakshmi, N. Mohan and N. Koga, J. Comput. Chem., 2008, 29, 1840 CrossRef CAS PubMed.
- W. Humphrey, A. Dalke and K. Schulten, Annu. Rev. Biochem., 1996, 14, 33 CAS.
- T. Sakurai, M. Satou, K. Akiyama, K. Lida, M. Seki, T. Kuromori, T. Ito, A. Konagaya, T. Toyoda and K. Shinozaki, Nucleic Acids Res., 2005, 33, D647 CrossRef PubMed.
- M. Seki, M. Narusaka, A. Kamiya, J. Ishida, M. Satou, T. Sakurai, M. Nakajima, A. Enju, K. Akiyama, Y. Oono, M. Muramatsu, Y. Hayashizaki, J. Kawai, P. Carninci, M. Itoh, Y. Ishii, T. Arakawa, K. Shibata, A. Shinagawa and K. Shinozaki, Science, 2002, 296, 141 CrossRef PubMed.
- H. Schägger and G. von Jagow, Anal. Biochem., 1987, 166, 368 CrossRef.
- N. Sreerama and R. W. Woody, Anal. Biochem., 2000, 287, 252 CrossRef CAS PubMed.
Footnotes |
| † Electronic supplementary information (ESI) available: Table S1. Evaluation of system density with different glycerol concentrations. Fig. S1. Comparison of MD simulations of COR15A unfolding with four different force fields. Fig. S2. Evaluation of 3D models with ANOLEA tool. Fig. S3. Contribution of hydrophobic and hydrophilic amino acids to total amount of amino acids in an α-helical conformation. Fig. S4. Analysis of potential energy during 30 ns MD simulations. Fig. S5. SDS-PAGE and western blot analysis of untagged recombinant COR15A. Fig. S6. Analysis of intermolecular protein backbone–glycerol and sidechain–glycerol H-bonds during 30 ns MD simulations. Fig. S7. Analysis of intermolecular protein backbone–water and sidechain–water H-bonds during 30 ns MD simulations. Fig. S8. RDF analysis of water and glycerol molecules around COR15 models during 30 ns MD simulation. See DOI: 10.1039/c6cp02272c |
| ‡ These authors contributed equally. |
| § Present address: Physikalische Biochemie, Universität Potsdam, Karl-Liebknecht-Str. 24-25, D-14476 Potsdam, Germany. E-mail: anja.thalhammer@uni-potsdam.de; Tel: +49 0331-9775267 (Anja Thalhammer). |
| This journal is © the Owner Societies 2016 |

