 Open Access Article
Creative Commons Attribution 3.0 Unported Licence
SANS study on the solvated structure and molecular interactions of a thermo-responsive polymer in a room temperature ionic liquid†
Kazu
Hirosawa
a,
Kenta
Fujii
*b,
Takeshi
Ueki
c,
Yuzo
Kitazawa
d,
Kenneth C.
Littrell
e,
Masayoshi
Watanabe
d and
Mitsuhiro
Shibayama
*a
aInstitute for Solid State Physics, The University of Tokyo, 5-1-5 Kashiwanoha, Kashiwa, Chiba 277-8581, Japan. E-mail: sibayama@issp.u-tokyo.ac.jp
bGraduate School of Science and Engineering, Yamaguchi University, 2-16-1 Tokiwadai, Ube, Yamaguchi 755-8611, Japan. E-mail: k-fujii@yamaguchi-u.ac.jp
cPolymer Materials Unit, National Institute for Materials Science, 1-1 Namiki, Tsukuba, Ibaraki 305-0044, Japan
dDepartment of Chemistry and Biotechnology, Yokohama National University, 79-5 Tokiwadai, Hodogaya-ku, Yokohama 240-8501, Japan
eOak Ridge National Laboratory, 1 Bethel Valley Road, Oak Ridge, Tennessee, 37831 USA
First published on 17th June 2016
Abstract
We have utilized small-angle neutron scattering (SANS) to quantitatively characterize the LCST-type phase behavior of the poly(benzyl methacrylate) (PBnMA) derivative poly(2-phenylethyl methacrylate) (PPhEtMA) in the deuterated ionic liquid (IL) d8-1-ethyl-3-methylimidazolium bis(trifluoromethanesulfonyl)amide (d8-[C2mIm+][TFSA−]). The SANS curves showed a discontinuous change from those characteristics of dispersed polymer chains to those of large aggregates of PPhEtMA chains suspended in the IL solution, indicating that phase separation occurs discontinuously at Tc. Furthermore, we evaluated the enthalpic and entropic contributions to the effective interaction parameter χeff of PPhEtMA in [C2mIm+][TFSA−] and compared them with those of PBnMA. The absolute value of the enthalpic contribution observed for PPhEtMA was smaller than that for PBnMA. This difference in the enthalpic term can be attributed to the unfavorable interaction between the IL and the alkyl group in the side chain of PPhEtMA. In addition, the temperature dependence of χeff was smaller than the previously reported value for a thermo-responsive polymer in an aqueous system. It was found out that the strong dependence of Tc on the chemical structure in IL systems originated from the relatively smaller temperature dependence of χeff.
Introduction
Ionic liquids (ILs) consist of only ion species. Thus, they exhibit unique solvent properties such as high ion conductivity, electrochemical stability, negligible volatility and nonflammability.3 More importantly, the solvent properties of ILs can be tuned by selecting appropriate combinations of ions, and they can dissolve various solutes including metal ions,4,5 organic molecules6,7 and biopolymers.8–11 In polymer science, the combination of polymer materials with appropriate ILs permits the fabrication of functional soft materials by exploiting the unique properties of ILs.12–17 Recently, various systems of different types of stimuli-responsive polymers in ILs have been developed for applications to sensors, actuators and switching devices possessing the intrinsic properties of the ILs.1,18–27 As it is well-known, poly(N-isopropylacrylamide) (PNIPAm) shows a lower critical solution temperature (LCST)-type phase separation in aqueous solutions. In contrast, PNIPAm exhibits an upper critical solution temperature (UCST)-type phase separation in a typical hydrophobic IL, 1-ethyl-3-methylimidazolium bis(trifluoromethanesulfonyl)amide ([C2mIm+][TFSA−], as shown in Scheme 1).18 Interestingly, it was found for the first time that poly(benzyl methacrylate) (PBnMA, shown in Scheme 1) and its derivatives show an LCST-type phase separation in [C2mIm+][TFSA−].1,19 Furthermore, a cross-linked PBnMA gel in [C2mIm+][TFSA−] shows discontinuous LCST-type volume phase transition in response to the temperature change.19 One of the characteristics of stimuli-responsive polymers in IL systems is that their phase transition temperature (Tc) strongly depends on both the polymer chemical structures and the structures of the ILs. For example, the LCST-type phase transition temperature of poly(2-phenylethyl methacrylate) (PPhEtMA, shown in Scheme 1) is 63 K lower than that of PBnMA although the chemical structures of PPhEtMA and PBnMA differ only by one methylene spacer inserted in the side chains.1 This strong dependence of Tc on the chemical structure provides a mechanism by which one can control the phase behavior of polymers in IL systems by designing the chemical structure of polymers or ILs appropriately.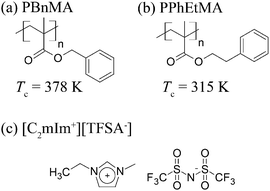 | ||
| Scheme 1 Schematic illustration for the chemical structure of (a) PPhEtMA, (b) PBnMA and (c) [C2mIm+][TFSA−], together with the reported phase separation temperature, Tc's of PPhEtMA and PBnMA in [C2mIm+][TFSA−].1 | ||
In a previous study, we studied PBnMA in the [C2mIm+][TFSA−] system using small-angle neutron scattering (SANS). In this system, it was found that the PBnMA chains exist as independent Gaussian chains in [C2mIm+][TFSA−] below Tc but suddenly form aggregates at Tc.2 Furthermore, our investigations of the microscopic solvation structure of PBnMA in [C2mIm+][TFSA−] by high-energy X-ray total scattering (HEXTS) modeled with the aid of MD simulations demonstrated that the C2mIm+ cations are localized above and below the benzyl groups of PBnMA.28 This partially ordered microscopic solvation structure of PBnMA in [C2mIm+][TFSA−] solution decreases the mixing entropy, resulting in the observed LCST-type phase behavior. From a thermodynamic aspect, it was reported that the mixing enthalpy and entropy values of PBnMA in [C2mIm+][TFSA−] are significantly smaller than those of PNIPAm in H2O, indicating that Tc of the system can be easily modified by a slight change in the free energy of mixing.29 Although several research groups have studied the structural aspects of thermo-responsive polymers in IL systems using infrared spectroscopy,30 SANS,31–33 and theoretical investigations of the phase diagram,34 the correlation between the microscopic or the mesoscopic solvation structure and macroscopic phase behavior is still unclear. For example, the physical origin of the above-mentioned differences in the Tc's of PBnMA and PPhEtMA is completely unknown.
In this study, we chose PPhEtMA in [C2mIm+][TFSA−] solution as a model system for investigating the key factors that determine the phase behavior of polymers in IL systems. We performed SANS measurements on this system and carried out quantitative data analysis to determine the thermodynamic parameters such as the second virial coefficient, A2, the effective interaction parameter, χeff, and the Θ temperature. The enthalpic and entropic contributions to χeff were estimated from temperature dependence of χeff and compared with those obtained for PBnMA.
This study is an attempt to understand the phase behavior of polymers in IL systems from a viewpoint of microscopic molecular interactions. Such physicochemical characterization of the phase behavior will contribute enormously to facilitating a systematic design of novel systems of polymers in ILs.
Experimental
Materials
PPhEtMA was prepared by atom transfer radical polymerization (ATRP) following a previously-reported procedure.35 CuBr 5.8 mg and CuBr2 0.9 mg were dried at 60 °C in a 50 mL Schlenk flask under vacuum and then stored in a nitrogen atmosphere. Anisole 10 mL and N,N,N′,N′′,N′′-pentamethyldiethylenetriamine (PMDETA) 10.3 μL were added to the flask and stirred until the mixture became transparent. 2-Phenylethyl methacrylate (PhEtMA) 10 mL and the initiator (2-bromoisobutyric acid ethyl ester) 23.9 μL were added and the system was degassed twice using freeze–pump–thaw cycles. The polymerization reaction of PhEtMA was conducted under a nitrogen atmosphere at 40 °C for 6 h, before termination by quenching with dry ice and methanol. The resulting product was purified by reprecipitation three times using ethyl acetate as the good solvent and methanol as the poor solvent and dried for 24 h at room temperature under vacuum. The structure of the polymer was characterized using 1H-NMR spectroscopy and size exclusion chromatography (SEC). SEC was conducted using N,N-dimethylformamide (DMF) containing 0.01 mol L−1 LiBr as the eluent. The number average molecular weight, Mn, was determined to be Mn = 31.5 k by 1H-NMR and the polydispersity index (Mw/Mn) was measured to be Mw/Mn = 1.30 using Tosoh columns calibrated with PMMA standards, where Mw is the weight average molecular weight.The ionic liquid [C2mIm+][TFSA−] and the partially deuterated ionic liquid d8-[C2mIm+][TFSA−] whose H atoms are substituted by D for the ethyl group and the imidazolium-ring of the C2mIm cation but not for the methyl group were synthesized according to the procedures reported before.36,37 The deuteration ratio of d8-[C2mim+][TFSA−] was estimated to be higher than 93% based on 1H-NMR spectroscopy measurements. All of the sample solutions were prepared using the cosolvent evaporation method with THF as the good solvent.38,39
Viscosity measurements
Viscosity measurements were carried out on PPhEtMA in [C2mIm+][TFSA−] solutions using a rheometer (MCR501, Anton Paar, Austria) at 298 K with a cone-plate geometry and a shear rate of 100 s−1.Dynamic light scattering (DLS) measurements
DLS measurements were carried out using a SLS/DLS 5022F-PCC-MS compact goniometer (ALV, Langen) coupled with an ALV photon correlator. A 22 mW He–Ne laser (wavelength, λ = 632.8 nm) was used as the incident beam and the scattering angle θ was 90°. Each measurement required 30 s. The solvent IL [C2mIm+][TFSA−] was passed through a PTFE filter (pore size: 0.5 μm) prior to use. The temperature was changed at a rate of approximately 0.5 K min−1, and DLS measurements were performed at each temperature after allowing the system to stabilize for at least 5 min.The distribution function of the hydrodynamic radius Rh was obtained by applying the inverse Laplace transformation to the time correlation function of scattering intensity using the well-established CONTIN program.40 The temperature dependence of the viscosity of [C2mIm+][TFSA−] was determined using the Vogel–Tammann–Fulcher (VTF) equation as previously reported.41 The refractive index of [C2mIm+][TFSA−] at each temperature was obtained from a previous report.42
Cloud point observation
PPhEtMA in [C2mIm+][TFSA−] and d8-[C2mIm+][TFSA−] solutions was poured into test tubes immersed in a water bath. Temperature was elevated at a rate slower than 0.2 K min−1, and the cloud point was determined by visual observation. We measured the highest temperature at which sample solution looked completely transparent (T1) and the lowest one at which it looked completely opaque (T2). We defined the cloud point (Tc) as the middle between T1 and T2, i.e., Tc = (T1 + T2)/2, and defined the uncertainty of Tc (ΔTc) as ΔTc = (T2 − T1)/2.SANS measurements
PPhEtMA in d8-[C2mIm+][TFSA−] solutions of polymer concentration, c = 8–29 mg mL−1 were injected into 2 mm thick spectroscopic grade quartz “banjo” cells, each containing 700 μl of the sample. The temperature was changed from 288 K to 310 K at a rate of 0.5 K min−1; the SANS measurements were performed at each temperature after the solution had stabilized for at least 20 min. The SANS measurements were performed at the CG-2 General Purpose SANS instrument in the High Flux Isotope Reactor (HFIR) facility in Oak Ridge National Laboratory (ORNL, USA). Two instrument configurations were used to yield a q-range from 0.0028 Å−1–0.46 Å−1 where q is the magnitude of the scattering vector defined as q = (4π/λ)sinθ and 2θ is the scattering angle. The configurations were (i) source-to-sample distance (SSD) = 17.3 m, sample-to-detector distance (SDD) = 19.3 m and (ii) SSD = 5.1 m and SDD = 2.8 m. Both configurations used a wavelength of λ = 4.72 Å.The measured data were corrected for background scattering (empty sample holder), transmission and detector efficiency according to the standard protocol using the Igor Pro based software provided by ORNL. The corrected scattering profiles were scaled to absolute units using a calibrated attenuated direct-beam measurement. The coherent scattering intensity from the sample solutions was obtained by the subtraction of the incoherent scattering calculated from chemical composition. We subtracted the coherent scattering intensity of the neat d8-[C2mIm+][TFSA−] from those of sample solutions to obtain the coherent scattering intensity of PPhEtMA in d8-[C2mIm+][TFSA−], referred to hereafter as I(q).
The mass densities of [C2mIm+][TFSA−], d8-[C2mIm+][TFSA−] and PhEtMA (monomer) were measured at 298 K using a digital density meter (DMA 4500, Anton Paar, Austria) to provide the values used for analysis; the results of density measurements are summarized in Table S1 (ESI†).
Results and discussion
Cloud points of PPhEtMA in [C2mIm+][TFSA−] and d8-[C2mIm+][TFSA−]
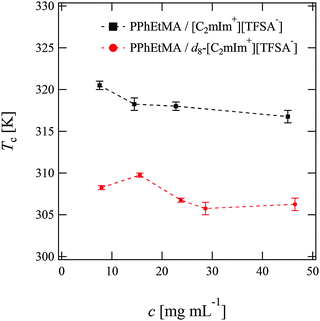
We first determined the cloud points Tc of PPhEtMA in [C2mIm+][TFSA−] and d8-[C2mIm+][TFSA−] solutions by visual observation. Fig. 1 shows the concentration dependence of Tc. As Fig. 1 indicates, the Tc of PPhEtMA was in the range of 306 K–310 K in d8-[C2mIm+][TFSA−] which is significantly lower than in protonated [C2mIm+][TFSA−] (315–320 K). Such a difference of Tc in deuterated and protonated solvents has been previously reported for PNIPAm in aqueous solutions,43–45 poly(styrene) in cyclohexane solutions,46 polymers in IL solutions,31 and for polymer blends.47,48 For example, the Tc of PNIPAm in D2O was reported to be 0.6–0.8 K higher than in H2O, due to the more stable hydrogen-bonding interactions in D2O.The effect of deuteration on Tc originates mainly from differences in molecular interactions in deuterated and protonated solvents.31,44,45 It is thus expected that the observed differences in Tc of PPhEtMA in protonated and deuterated ILs similarly originate from the isotope effect on the strength of molecular interactions. The molar volume of neat d8-[C2mIm+][TFSA−] (2.5730 × 10⁻⁴ m3 mol−1) calculated from its mass density (see Table S1, ESI†) was slightly smaller than that of the protonated [C2mIm+][TFSA−] (2.5777 × 10⁻⁴ m3 mol−1). This result indicates that cohesive interactions between IL ions are slightly enhanced by deuterium substitution. As mentioned in the Introduction, it has been reported previously that the enthalpy and entropy of mixing of PBnMA in [C2mIm+][TFSA−] are quite small compared to those of PNIPAm in the H2O system.29 Hence, even a slight difference in the interactions can affect the Tc of PPhEtMA, one of the PBnMA derivatives in the IL. We conclude that the lower Tc of PPhEtMA in d8-[C2mIm+][TFSA−] and the larger difference in Tc's (≈10 K) can be ascribed to the slightly stronger cohesive interactions between deuterated IL ions compared to those between protonated ones.
However, it should be noted that Tc decreases for PPhEtMA in an IL system while it increases for PNIPAm in water by deuterium substitution on solvents. This opposite tendency suggests that the solvation mechanism is different between ILs and aqueous systems. Here, the former is ascribed to the side-chain “philic” interaction between the phenyl group of PPhEtMA and the C2mIm cation,28 while the latter in the side-chain “phobic” interaction is stabilized by the solvent-solvent interaction.44,45,49 When the cohesive interaction between solvent molecules is enhanced by deuterium substitution,46 the side-chain “philic” interaction should become unfavorable whereas the side-chain “phobic” interaction favorable. We thus conjecture that the opposite deuteration effects on Tc of polymers in ILs and in water solutions reflect the difference in their solvation, i.e., the side-chain “philic” interaction of PPhEtMA in the [C2mIm+][TFSA−] system and the side-chain “phobic” interaction of PNIPAm in the water system.
Viscosity measurements
Fig. 2 shows the reduced viscosity ηred of PPhEtMA in [C2mIm+][TFSA−] solutions as a function of PPhEtMA concentration c, where ηred is defined by the following equation: | (1) |
 | (2) |
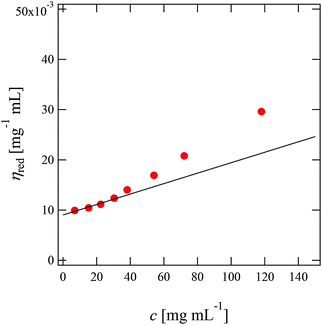 | ||
| Fig. 2 Concentration dependence of the reduced viscosities (ηred) of PPhEtMA in [C2mIm+][TFSA−] solutions. The intrinsic viscosities ([η]) were obtained by extrapolating ηred to c = 0 (solid line). | ||
DLS measurements
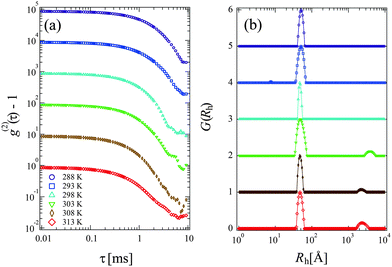
Fig. 3(a) and (b) show the time-correlation function g(2)(τ) − 1 and the corresponding Rh distribution functions G(Rh) observed for 15 mg mL−1 PPhEtMA solution at various temperatures, respectively. The DLS measurements were carried out below the phase-separating temperature as the solution became opaque and strong multiple scattering prevented DLS measurements above the phase-separating temperature. The G(Rh)s data at T < 303 K showed a single intense peak at around Rh ∼ 45–50 Å with the peak positions independent of temperature. Above 303 K, a small peak (slow-mode peak) appeared at Rh > 1000 Å while the peak at Rh ∼ 45–50 Å remained intense. This slow-mode peak was also observed in the previous study of PBnMA in the [C2mIm+][TFSA−] system; it indicates the appearance of local micro-phase separation below the bulk phase separation temperature.2 This result suggests that the majority of the PPhEtMA chains are homogeneously dispersed but that a small amount of aggregates coexists at the temperature near the critical temperature.Fig. 4 shows the temperature dependence of Rh of PPhEtMA chains corresponding to the fast mode. It is clear that Rh was almost independent of temperature, indicating that molecular conformation of solvated PPhEtMA chains remained essentially unchanged across the examined temperature range.
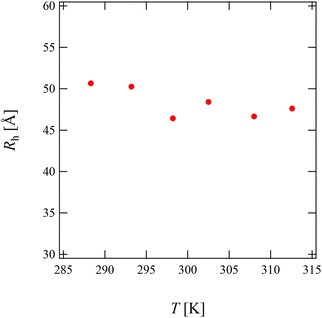 | ||
| Fig. 4 The temperature dependence of the Rh values obtained for the PPhEtMA in [C2mIm+][TFSA−] solution at c = 15 mg mL−1. | ||
SANS measurements
We performed SANS measurements for the present system using deuterated IL, d8-[C2mIm+][TFSA−], as the solvent to investigate the chain conformation and evaluate thermodynamic parameters for PPhEtMA in the [C2mIm+][TFSA−] system. The SANS curves observed for PPhEtMA in d8-[C2mIm+][TFSA−] solution (c = 16 mg mL−1) at various temperatures are shown in Fig. 5. Here, c of the examined sample solution was substantially lower than c* (∼130 mg mL−1) and the system was in the dilute region. As Fig. 5 indicates, the scattering intensity slightly increased with increasing temperature, but then showed a steep upturn in the data at temperatures higher than Tc (∼309 K, see Fig. 1). Here, the upturn at the low-q region (q < 0.006 Å−1) and the slope in the middle-q region (0.03 Å−1 < q < 0.13 Å−1) are described by I(q) ∼ q−4 and I(q) ∼ q−2, respectively. We modeled the data by fitting to the following scattering function based on Zimm-approximation;52–54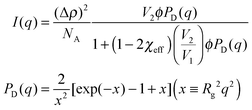 | (3) |
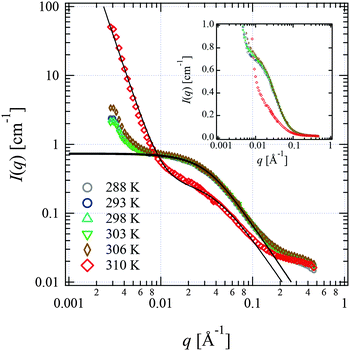 | ||
| Fig. 5 SANS profiles observed for the PPhEtMA in d8-[C2mIm+][TFSA−] solution (c = 16 mg mL−1) at various temperatures shown in the form of the log–log plot. The solid lines are the fits with eqn (3) or eqn (3) + Aq−4 functions. The SANS profiles are also shown in the form of the semi-log plot in the inset. | ||
For the scattering profiles at T > 309 K, we performed curve fitting by using a sum of eqn (3) and Debye–Bueche functions,
 | (4) |
Most previous studies in the literature were performed using semi-dilute solution of phase-separating polymers in water,43,60 organic solvents55,61 and in ILs.2,31–33 The small-angle scattering profiles of these showed behavior typical of spinodal decomposition: the divergence of scattering intensity correlation length as the critical point is approached. In contrast, in a recent study of PNIPAm in dilute aqueous solution, it was reported that the SANS profiles show a discontinuous change at the critical point where the steepness of the change decreased with the increasing fraction of the meso-diad in the PNIPAm chain, i.e., decreasing cooperativity of hydration.62–64 Here, cooperative solvation means that the desorption of a solvent molecule from a site induces the desorption of another solvent molecule from its neighboring site. From this, we concluded that the sharpness of the phase separation results from the cooperative dehydration of PNIPAm at the critical point.
It should be noted that the present study shows a discontinuous change in the scattering from that of dispersed polymer chains to that of large aggregates in dilute solution. Based on the previous study on the PNIPAm dilute aqueous solution, we conjecture that the discontinuous change in SANS profiles observed for PPhEtMA in d8-[C2mIm+][TFSA−] also originates from the cooperative dissociation of IL ions at Tc.
Earlier in this section, we demonstrated that the phase separation behavior of PPhEtMA in the [C2mIm+][TFSA−] system in SANS was well described by the typical functions for the Gaussian chains in dilute solution with a phase separated structure. To investigate the system more quantitatively, we evaluated the thermodynamic parameters as determined from the Zimm plot. At the limit of low-c and low-q, a scattering intensity from a polymer solution I(q) can be approximated as follows:
 | (5) |
Fig. 6 shows the Zimm plot at various temperatures (288, 293, 298, and 303 K) below Tc. We successfully obtained reasonable values of Mw for PPhEtMA (the obtained Mw values are in the range of 32–34 kDa) by fitting the data to the function described in eqn (5), confirming the validity of the experiment and the analysis. Fig. 7 shows the temperature dependence of (a) A2 and (b) Rg,0 obtained from the Zimm plot. As Fig. 7(a) illustrates, A2 decreased with increasing temperature and then changed its sign at T = 301 K, i.e., the Θ temperature. This result indicates that the compatibility of PPhEtMA decreases gradually with increasing temperature. As Fig. 7(b) demonstrates, Rg,0 was independent of temperature within its error, similar to the results of the DLS experiments (see Fig. 4). The stability of Rh and Rg,0 even near the critical point indicates that the desolvation of IL ions from the solvated PPhEtMA occurs suddenly at the critical temperature. This interpretation is supported by the sudden and discontinuous changes observed in SANS profiles at Tc (see Fig. 5).
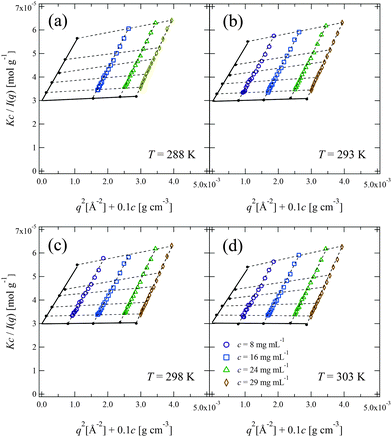 | ||
| Fig. 6 Zimm plots for the PPhEtMA in d8-[C2mIm+][TFSA−] solutions at (a) T = 288 K, (b) T = 293 K, (c) T = 298 K and (d) T = 303 K. | ||
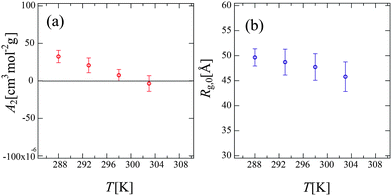 | ||
| Fig. 7 The temperature dependence of (a) the second virial coefficient, A2 and (b) the radius of gyration at c → 0, Rg,0 obtained from the Zimm plots shown in Fig. 6. | ||
Comparison between PPhEtMA and PBnMA in [C2mIm+][TFSA−] solutions
In the former sections, we evaluated the structural parameters for PPhEtMA in the [C2mIm+][TFSA−] system. Here, we compare the structural parameters of PPhEtMA with those of PBnMA in [C2mIm+][TFSA−] to probe the physical origin of the difference between the measured Tc 's (Tc of PPhEtMA in [C2mIm+][TFSA−] is approximately 60 K lower than that of PBnMA).1 We have previously reported a SANS study on PBnMA in the [C2mIm+][TFSA−] system in which we estimated the effective interaction parameter χeff in the dilute region where the chain overlapping concentration was also determined by viscosity measurements (Fig. S1, ESI†).2Fig. 8 shows the comparison of the temperature dependence of χeff obtained for PPhEtMA and PBnMA using the same analytical procedure of fitting the curve using the function given in eqn (3). The value of χeff thus obtained for PPhEtMA solution at c = 16 mg mL−1 was very close to the value converted from A2 obtained using the Zimm plot shown in Fig. S2 (ESI†), confirming the validity of the curve fitting.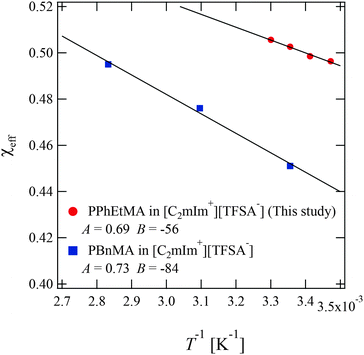 | ||
| Fig. 8 The temperature dependence of the effective interaction parameter χeff of the PPhEtMA in [C2mIm+][TFSA−] solution obtained from the curve fitting shown in Fig. 5, together with the corresponding values for PBnMA in the [C2mIm+][TFSA−] solution system.2 The solid lines are linear fits to χeff = A + B/T; the fitted values for A and B are shown in the graph. | ||
In the vicinity of the critical point, χeff can be approximated as a function of temperature as follows:
 | (6) |
The observed differences between the obtained |A| and |B| for PPhEtMA and PBnMA imply that the chemical modification of PBnMA by the insertion of a methylene group into the side chains lowers the absolute value of the enthalpy of mixing, resulting in the decrease of Tc. In our previous study, we pointed out that the dominant microscopic interaction between PBnMA and [C2mIm+][TFSA−] is the cation-π interaction between C2mIm and PBnMA whereby C2mIm cations preferentially solvate above and below the benzyl groups in the PBnMA side chains.28 Considering this fact, alkyl groups in side chains of PBnMA or PPhEtMA do not contribute to the interactions between C2mIm cations and the side chains. Hence, we conclude that the lower |B| value of PPhEtMA than PBnMA originates from an increase of unfavorable interactions between PPhEtMA and the IL caused by the insertion of the methylene group.
Furthermore, we compared the values of A and B between the polymer in IL systems and PNIPAm in aqueous solution systems. The obtained values of |A| and |B| for PPhEtMA and PBnMA in [C2mIm+][TFSA−] were smaller than those estimated for PNIPAm in aqueous solution using previously reported data (|A| = 1.15, |B| = 203 K−1).64 This reduced temperature dependence of χeff in IL systems indicates that the phase equilibrium of the IL system can be sensitively affected by a slight change in A or B, i.e., chemical modification to the polymer or IL. Hence, it was determined that the strong dependence of Tc on the chemical structure in IL systems originates from the relatively smaller temperature dependence of χeff in these systems.
Conclusions
The solvated structure and phase behavior of the thermo-responsive polymer PPhEtMA in the [C2mIm+][TFSA−] solution system were investigated quantitatively by SANS experiments. The following facts were disclosed: (1) the obtained SANS profiles showed a discontinuous change from that of dispersed polymer chains to that of large aggregates for PPhEtMA in the IL solution, indicating that the phase separation occurs discontinuously at Tc. The scattering profiles were analyzed by curve fitting with a single-contact Debye function and by the Zimm plot. The second virial coefficient A2 was successfully evaluated, and the results showed that the compatibility of PPhEtMA with the IL gradually decreases with increasing temperature. (2) The absolute value of the enthalpic term |B| in the effective interaction parameter χeff obtained for PPhEtMA was smaller than that for poly(benzyl methacrylate) (PBnMA). This difference in the enthalpic term can be attributed to an increase of the unfavorable interaction between IL and PPhEtMA caused by the insertion of the methylene group. (3) The obtained |A| and |B| values of the polymer in IL systems were significantly smaller than those of the PNIPAm in aqueous solution systems. It was determined that the strong dependence of Tc on the chemical structure in IL systems originated from the relatively-smaller temperature dependence of χeff.Acknowledgements
This work has been financially supported by Grants-in-Aid for Scientific Research from the Ministry of Education, Culture, Sports, Science, and Technology (No. 22245018 to M. S.). The experiment (IPTS12408.1) using the General-Purpose SANS (CG-2) at Oak Ridge National Laboratory was supported by the US-Japan Cooperative Program on Neutron Scattering. Travel expenses for the experiment were also supported by General User Program for Neutron Scattering Experiments, Institute for Solid State Physics, The University of Tokyo (proposal no. 14906), at JRR-3, Japan Atomic Energy Agency, Tokai, Japan. The High Flux Isotope Reactor and beamline CG2 of ORNL was sponsored by the Scientific User Facilities Division, Office of Basic Energy Sciences, U.S. Department of Energy. K. H. was supported by Japan Society for the Promotion of Science through Program for Leading Graduate Schools (MERIT).Notes and references
- K. Kodama, H. Nanashima, T. Ueki, H. Kokubo and M. Watanabe, Langmuir, 2009, 25, 3820 CrossRef CAS PubMed.
- K. Fujii, T. Ueki, K. Niitsuma, T. Matsunaga, M. Watanabe and M. Shibayama, Polymer, 2011, 52, 1589–1595 CrossRef CAS.
- T. Welton, Chem. Rev., 1999, 99, 2071–2083 CrossRef CAS PubMed.
- S. Seki, Y. Kobayashi, H. Miyashiro, Y. Ohno, A. Usami, Y. Mita, N. Kihira, M. Watanabe and S. Terada, J. Phys. Chem. B, 2006, 110, 10228–10230 CrossRef CAS PubMed.
- K. Fujii, H. Hamano, H. Doi, X. Song, S. Tsuzuki, H. Hayamizu, S. Seki, Y. Kameda, K. Dokko, M. Watanabe and Y. Umebayashi, J. Phys. Chem. C, 2013, 117, 19314–19324 CrossRef CAS.
- J. G. Huddleston, H. D. Willauer, R. P. Swatloski, A. E. Visser and R. D. Rogers, Chem. Commun., 1998, 1765–1766 RSC.
- C. Chiappe and D. Pieraccini, J. Phys. Org. Chem., 2005, 18, 275–297 CrossRef CAS.
- R. Madeira Lau, F. Van Rantwijk, K. R. Seddon and R. A. Sheldon, Org. Lett., 2000, 2, 4189–4191 CrossRef CAS PubMed.
- R. P. Swatloski, S. K. Spear, J. D. Holbrey and R. D. Rogers, J. Am. Chem. Soc., 2002, 124, 4974–4975 CrossRef CAS PubMed.
- F. Rantwijk and R. A. Sheldon, Chem. Rev., 2007, 107, 2757–2785 CrossRef PubMed.
- M. Moniruzzaman, N. Kamiya, K. Nakashima and M. Goto, Green Chem., 2008, 10, 497–500 RSC.
- R. T. Carlin and J. Fuller, Chem. Commun., 1997, 1345 RSC.
- P. Scovazzo, J. Kieft, D. A. Finan, C. Koval, D. DuBois and R. Noble, J. Membr. Sci., 2004, 238, 57–63 CrossRef CAS.
- M. Galinski, A. Lewandowski and I. Stepniak, Electrochim. Acta, 2006, 51, 5567–5580 CrossRef CAS.
- N. Winterton, J. Mater. Chem., 2006, 16, 4281 RSC.
- J. M. Lu, F. Yan and J. Texter, Prog. Polym. Sci., 2009, 34, 431–448 CrossRef CAS.
- T. Ueki and M. Watanabe, Bull. Chem. Soc. Jpn., 2012, 85, 35–50 CrossRef.
- T. Ueki and M. Watanabe, Chem. Lett., 2006, 35, 964–965 CrossRef CAS.
- T. Ueki and M. Watanabe, Langmuir, 2007, 23, 988–990 CrossRef CAS PubMed.
- R. Tsuda, K. Kodama, T. Ueki, H. Kokubo, S. Imabayashi and M. Watanabe, Chem. Commun., 2008, 4939 RSC.
- S. Tamura, T. Ueki, K. Ueno, K. Kodama and M. Watanabe, Macromolecules, 2009, 42, 1315 CrossRef.
- T. Ueki, A. Yamaguchi, N. Ito, K. Kodama, J. Sakamoto, K. Ueno, H. Kokubo and M. Watanabe, Langmuir, 2009, 25, 8845 CrossRef CAS PubMed.
- T. Ueki, M. Watanabe and T. P. Lodge, Macromolecules, 2009, 42, 1315–1320 CrossRef CAS.
- H.-N. Lee and T. P. Lodge, J. Phys. Chem. Lett., 2010, 1, 1962–1966 CrossRef CAS.
- H. N. Lee and T. P. Lodge, J. Phys. Chem. B, 2011, 115, 1971–1977 CrossRef CAS PubMed.
- S. Imaizumi, H. Kokubo and M. Watanabe, Macromolecules, 2012, 45, 401–409 CrossRef CAS.
- Y. Kitazawa, T. Ueki, K. Niitsuma, S. Imaizumi, T. P. Lodge and M. Watanabe, Soft Matter, 2012, 8, 8067–8074 RSC.
- M. Matsugami, K. Fujii, T. Ueki, Y. Kitazawa, Y. Umebayashi, M. Watanabe and M. Shibayama, Anal. Sci., 2013, 29, 311–314 CrossRef CAS PubMed.
- T. Ueki, A. A. Arai, K. Kodama, S. Kaino, N. Takada, T. Morita, K. Nishikawa and M. Watanabe, Pure Appl. Chem., 2009, 81, 1829–1841 CrossRef CAS.
- W. Li and P. Wu, Soft Matter, 2013, 9, 11585–11597 RSC.
- H. N. Lee, N. Newell, Z. Bai and T. P. Lodge, Macromolecules, 2012, 45, 3627–3633 CrossRef CAS.
- H. Asai, K. Fujii, T. Ueki, S. Sawamura, Y. Nakamura, Y. Kitazawa, M. Watanabe, Y.-S. Han, T.-H. Kim and M. Shibayama, Macromolecules, 2013, 46, 1101–1106 CrossRef CAS.
- M. L. Hoarfrost, Y. He and T. P. Lodge, Macromolecules, 2013, 46, 9464–9472 CrossRef CAS.
- R. P. White and J. E. G. Lipson, Macromolecules, 2013, 46, 5714–5723 CrossRef CAS.
- Y. Kitazawa, T. Ueki, S. Imaizumi, T. P. Lodge and M. Watanabe, Chem. Lett., 2014, 43, 204–206 CrossRef CAS.
- K. Fujii, R. Kanzaki, T. Takamuku, Y. Kameda, S. Kohara, M. Kanakubo, M. Shibayama, S. Ishiguro and Y. Umebayashi, J. Chem. Phys., 2011, 135, 244502 CrossRef PubMed.
- K. Fujii, H. Asai, T. Ueki, T. Sakai, S. Imaizumi, U. Chung, M. Watanabe and M. Shibayama, Soft Matter, 2012, 8, 1756–1759 RSC.
- P. Snedden, A. I. Cooper, K. Scott and N. Winterton, Macromolecules, 2003, 36, 4549–4556 CrossRef CAS.
- Y. He, Z. Li, P. Simone and T. P. Lodge, J. Am. Chem. Soc., 2006, 128, 2745–2750 CrossRef CAS PubMed.
- S. W. Provencher, Comput. Phys. Commun., 1982, 27, 213–227 CrossRef.
- H. Tokuda, K. Hayamizu, K. Ishii, M. A. B. H. Susan and M. Watanabe, J. Phys. Chem. B, 2005, 109, 6103 CrossRef CAS PubMed.
- T. Ueki, T. Karino, Y. Kobayashi, M. Shibayama and M. Watanabe, J. Phys. Chem. B, 2007, 111, 4750–4754 CrossRef CAS PubMed.
- M. Shibayama, T. Tanaka and C. C. Han, J. Chem. Phys., 1992, 97, 6829–6841 CrossRef CAS.
- H. Shirota and K. Horie, Chem. Phys., 1999, 242, 115 CrossRef CAS.
- H. Shirota, N. Kuwabara, K. Ohkawa and K. Horie, J. Phys. Chem. B, 1999, 103, 10400 CrossRef CAS.
- C. Strazielle and H. Benoit, Macromolecules, 1975, 8, 203–205 CrossRef CAS.
- H. Yang, M. Shibayama, R. S. Stein, N. Shimizu and T. Hashimoto, Macromolecules, 1986, 19, 1667–1674 CrossRef CAS.
- E. L. Atkin, L. A. Kleintjens, R. Koningsveld and L. J. Fetters, Makromol. Chem., 1984, 185, 377–387 CrossRef CAS.
- M. Shibayama, S. Mizutani and S. Nomura, Macromolecules, 1996, 29, 2019–2024 CrossRef CAS.
- H. Fujita, Polymer Solution, Elsevier, Amsterdam, 1990 Search PubMed.
- H. Asai, K. Fujii, T. Ueki, T. Sakai, U. Chung, M. Watanabe, Y. S. Han, T. H. Kim and M. Shibayama, Macromolecules, 2012, 45, 3902–3909 CrossRef CAS.
- H. Benoit and M. Benmouna, Polymer, 1984, 25, 1059–1067 CrossRef CAS.
- H. Benoît, C. Picot and M. Benmouna, J. Polym. Sci., Part B: Polym. Phys., 1984, 22, 1545–1548 Search PubMed.
- J. S. Higgins and H. C. Benoit, Polymers and Neutron Scattering, Clarendon Press, Oxford, 1994 Search PubMed.
- Y. Xie, K. F. Ludwig Jr, R. Bansil, P. D. Gallagher, X. Cao and G. Morales, Physica A, 1996, 232, 94–108 CrossRef CAS.
- B. Hammouda, D. Ho and S. Kline, Macrmolecules, 2002, 35, 8578–8585 CrossRef.
- Q. Liao, A. V. Dobrynin and M. Rubinstein, Macromolecules, 2006, 39, 1920–1938 CrossRef CAS.
- M. N. Spiteri, C. E. Williams and F. Boué, Macromolecules, 2007, 40, 6679–6691 CrossRef CAS.
- A. K. Gupta, J. P. Cotton, E. Marchal, W. Burchard and H. Benoit, Polymer, 1976, 17, 363–366 CrossRef CAS.
- I. R. Nasimova, T. Karino, S. Okabe, M. Nagao and M. Shibayama, Macromolecules, 2004, 37, 8721–8729 CrossRef CAS.
- Y. B. Melnichenko, G. D. Wignall, A. W. Van Hook, J. Szydlowski, H. Wilczura and L. P. Rebelo, Macromolecules, 1998, 31, 8436–8438 CrossRef CAS.
- B. H. Zimm and J. K. Bragg, J. Chem. Phys., 1959, 31, 526–535 CrossRef CAS.
- Y. Okada and F. Tanaka, Macrmolecules, 2005, 38, 4465–4471 CrossRef CAS.
- K. Nishi, T. Hiroi, K. Hashimoto, K. Fujii, Y.-S. Hang, T.-H. Kim, Y. Katsumoto and M. Shibayama, Macromolecules, 2013, 46, 6225–6232 CrossRef CAS.
- A. R. Shultz and P. J. Flory, J. Am. Chem. Soc., 1952, 74, 4760–4767 CrossRef CAS.
Footnote |
| † Electronic supplementary information (ESI) available: Mass density of the material, viscosity of PBnMA in [C2mIm+][TFSA−] solutions and χeff calculated from A2. See DOI: 10.1039/c6cp02254e |
| This journal is © the Owner Societies 2016 |

