
 Open Access Article
 This Open Access Article is licensed under a
 Creative Commons Attribution 3.0 Unported Licence
Self-trapping and excited state absorption in fluorene homo-polymer and copolymers with benzothiadiazole and tri-phenylamine†
Jean-Christophe
Denis
 a,
Arvydas
Ruseckas
b,
Gordon J.
Hedley
b,
Andrew B.
Matheson
b,
Martin J.
Paterson
c,
Graham A.
Turnbull
b,
Ifor D. W.
Samuel
*b and
Ian
Galbraith
*a
a,
Arvydas
Ruseckas
b,
Gordon J.
Hedley
b,
Andrew B.
Matheson
b,
Martin J.
Paterson
c,
Graham A.
Turnbull
b,
Ifor D. W.
Samuel
*b and
Ian
Galbraith
*a
aInstitute of Photonics and Quantum Sciences, SUPA, School of Engineering and Physical Sciences, Heriot-Watt University, Edinburgh, UK. E-mail: I.Galbraith@hw.ac.uk
bOrganic Semiconductor Centre, SUPA, School of Physics & Astronomy, University of St. Andrews, St. Andrews, UK. E-mail: idws@st-andrews.ac.uk
cInstitute of Chemical Sciences, School of Engineering and Physical Sciences, Heriot-Watt University, Edinburgh, UK
First published on 21st June 2016
Abstract
Excited state absorption (ESA) is studied using time-dependent density functional theory and compared with experiments performed in dilute solutions. The molecules investigated are a fluorene pentamer, polyfluorene F8, the alternating F8 copolymer with benzothiadiazole F8BT, and two blue-emitting random copolymers F8PFB and F8TFB. Calculated and measured spectra show qualitatively comparable results. The ESA cross-section of co-polymers at its maximum is about three times lower than that of F8. The ESA spectra are found to change little upon structural relaxation of the excited state, or change in the order of sub-units in a co-polymer, for all studied molecules. In all these molecules, the strongest ESA transition is found to arise from the same electronic process, exhibiting a reversal of the charge parity. In addition, F8PFB and F8TFB are found to possess almost identical electronic behaviour.
Introduction
Semiconducting polymers, reported in 1963,1 have been widely studied since the late eighties, following the successful demonstrations of the functional organic transistor in 19862 and the organic light-emitting diode in 1987.3 Since then, organic semiconductors have been proposed as the next generation materials, which would provide cheaper, more tuneable, flexible and more environmentally-friendly electronics for displays, lighting and solar energy harvesting applications. Exciton–exciton annihilation (EEA) is one of the limiting factors in the operation of high-brightness organic light-emitting diodes and lasers which not only hampers their performance but can also lead to device degradation. The rate of EEA is determined by exciton diffusion and by the spectral overlap of fluorescence with excited state absorption (ESA). ESA can also be used for gain modulation in organic lasers and amplifiers,4–7 for ultrafast control of emission wavelength8 and for optical power limiting.9The soft nature of organic materials allows for substantial structural relaxation in the excited state during which the nuclei rearrange to minimise the energy of the molecule. This relaxation generally causes a red-shift of the photoluminescence spectrum10,11 but it can also affect the ESA spectra. It is important to develop theoretical tools to identify optical transitions responsible for ESA and to investigate how they change upon structural relaxation. Combined experimental – theoretical approaches show high potential to provide fundamental understanding of excited state dynamics in conjugated molecules.8,11
This work aims to characterise and understand ESA phenomena in conjugated polymers, using a unique combination of broadband transient absorption spectroscopy and advanced theoretical tools. The molecules we investigated are polyfluorenes (Fig. 1(a)), because they are prototypical conjugated polymers for organic light-emitting devices (OLEDs),12 and some fluorene copolymers with tri-phenylamine which have been developed to tune both their emission and functionality e.g. electron or hole transport. One class of such emitters are based on fluorene copolymers with tri-phenylamine. They will be denoted as F8PFB and F8TFB in this work, and are shown in Fig. 1(b) and (c). We also study F8BT, an efficient emitter and standard co-polymer for optical applications,13 shown in Fig. 1(d).
 | ||
| Fig. 1 Sketch of the monomer units of the polymers investigated experimentally: (a) polyfluorene (PFO), (b) F8PFB, (c) F8TFB and (d) F8BT. We have also investigated the fluorene pentamer (O5), which consists in a chain of 5 fluorene units (a), terminated by hydrogen atoms. | ||
Our experiments reveal strong ESA transitions in fluorene copolymers in the spectral region of 0.8–1.3 eV which has not been accessed in previous studies.14–16 First principles theoretical calculations of ESA spectra have been reported,17–21 but the approaches used so far scale very poorly with system size and are therefore not appropriate to use for realistic conjugated polymers. Developing methods that are capable of reliably calculating linear and non-linear optical properties of large molecules are extremely challenging.17,18 Widely used tools, such as time-dependent density-functional theory, which is used routinely to calculate photo-absorption and photo-emission properties in molecular compounds,22,23 require higher order methods than the linear response function to calculate the ESA spectra.24 As far as we are aware, there is only one report of the use of TD-DFT with the quadratic response function to calculate ESA spectra, in fluorene oligomers.25 A few more studies have used TD-DFT for the prediction of non-linear optical properties, including the investigation of (simultaneous) two-photon absorption properties and second harmonic generation in conjugated molecules, for instance using high-order response functions26–32 or the a posteriori Tamm–Dancoff approximation (ATDA).33 We use the ATDA approximation for TD-DFT calculations and observe reasonable qualitative agreement between the experimental and theoretical results. We compare the ESA spectra of the molecules with each other and relate the observed ESA spectral features to the relevant electronic transitions. We also find that while molecular relaxation upon photo-excitation causes substantial change between the ground-state absorption and photoluminescence energies, the shapes of the excited-state absorption spectra are in comparison rather insensitive to geometric relaxation. This is the first time such a joint theoretical and experimental work on ESA is reported, resulting in important fundamental understanding of this mechanism universal to organic electronics. The possession of this fundamental knowledge is an important step to develop better and more efficient organic opto-electronic device.
Experiment
The conjugated polymers were supplied by CDT (Cambridge Display Technology, a Sumitomo Chemical Group Company) and the fluorene pentamer (O5) was sourced from American Dye Source Inc. Transient absorption measurements were carried out on dilute solutions in toluene in rotating cuvettes using a chirped pulse regenerative amplifier PHAROS SP from Light Conversion Ltd operating at 5 kHz pulse repetition rate. The probe was a white-light continuum which was generated by focusing 1 μJ laser pulses at 1030 nm onto a YAG crystal and detected with a photodiode array. The excitation pulses were generated by a collinear optical parametric amplifier ORPHEUS from Light Conversion Ltd producing an output at 5 kHz with 200 fs full-width half-maximum pulses. This beam was modulated at 2.5 kHz by a mechanical chopper for transient absorption measurements. The absorbed energy density was about 10 μJ cm−2. A long-pass filter was used to absorb the transmitted excitation light. Linear polarisations of pump and probe light were oriented at the “magic” angle (54.7 degrees) to each other, at this condition kinetics are independent of dynamic depolarisation.Calculation methods
The theoretical quantum chemical calculations have all been conducted using density functional theory (DFT), with the long-range corrected, CAM-B3LYP functional.34 It is known that B3LYP gives very good quantitative agreement with experimental linear optical properties in fluorene-based materials;35,36 however it has been shown unreliable in predicting third order properties in general.37 In comparison, the use of CAM-B3LYP over B3LYP offers significant improvement in predicting accurately third order properties.26,33 In particular, a previous report emphasised excited-state absorption spectra calculations in fluorene oligomers.25For all ESA calculations reported we have used the a posteriori Tamm–Dancoff approximation (ATDA) as developed by Masunov and co-workers.33,38 The ATDA approach gives both usual ground to excited-state transition dipole moments and transition moments between excited-states using only the modified linear response Tamm–Dancoff equations, but renormalizes the excitation eigenvectors using the corresponding de-excitation eigenvectors as obtained from solution of full linear response TD-DFT equations. Within the ATDA excitation energies and ground to excited transition moments are equivalent to standard LR-TD-DFT, while excited-excited transition moments are approximated compared to the double residue of the quadratic response (QR) function. Previous work has calibrated the ATDA as a robust approach for non-linear optical properties of large molecules (in particular two-photon absorption33). For excited state absorption we have calibrated this approach to the full QR approach reported previously,25 and we note that the essential features of the ESA are well reproduced using the ATDA approach. We use a modified local version of Gaussian0939 for all calculations reported.
The side-chains on the fluorene units of the molecules studied have been replaced by methyl-groups, as this is an efficient way to speed up the calculations without compromising the accuracy of the results.36 We have checked this for the PFB dimer, we found a less than 1% change for both the transition moments and energies of the electronic states corresponding to ground-state absorption, emission and ESA, when the octyl and butyl groups were replaced by methyl groups.
The ground-state geometry was calculated by DFT, whereas the S1 excited-state geometry was calculated using time-dependent DFT (TD-DFT), from the optimised ground-state geometry. We have checked that the geometries obtained (in particular the dihedral angles) are consistent with previous work.40,41 The excited states and excited-to-excited-state transition dipole moments have been obtained by a single point TD-DFT calculation.
We ensure that the total excitation energies of the ESA spectra we present are below the ionisation threshold (standard TD-DFT being unable to describe such a bound to continuum transition33,42). Using CAM-B3LYP/6-31G*, we obtained the vertical ionisation energy by calculating the difference between the total energy of the optimised geometry (either S0 or S1) and the total energy of the corresponding cation in an unrestricted Kohn–Sham orbital set.43 The results are given in Table 1.
| Theory | |||||
|---|---|---|---|---|---|
| E trans (eV) | d trans (e Å) | E VertIoni (eV) | E VertIoni − Etrans (eV) | ||
| O5 | Absorption | 3.84 | 3.70 | 6.50 | 2.65 |
| Emission | 3.19 | 3.83 | 6.13 | 2.94 | |
| O8 | Absorption | 3.76 | 4.87 | 6.47 | 2.71 |
| Emission | 3.17 | 4.46 | 6.13 | 2.96 | |
| F8TFB | Absorption | 3.70 | 4.39 | 6.04 | 2.34 |
| Emission | 3.19 | 3.75 | 5.82 | 2.63 | |
| F8PFB | Absorption | 3.70 | 4.08 | 5.83 | 2.13 |
| Emission | 3.17 | 3.58 | 5.66 | 2.49 | |
| F8BT | Absorption | 3.10 | 4.13 | 6.62 | 3.52 |
| Emission | 2.42 | 3.03 | 6.25 | 3.84 | |
For all the molecules of this study, we chose the 6-31G* basis set. Such a basis set has been shown to provide accurate TD-DFT results in similar co-polymers.44 A larger basis set would have made the calculation intractable for the longer oligomers, for very limited improved accuracy.45 We have also conducted calculations on small oligomers of all polymers we studied, and found that results changed significantly between using the 6-31G and the 6-31G* basis set, but showed only negligible changes when the 6-31G* basis set was increased to 6-311G**. For instance, in an F8TFB-F8 molecule, we noticed a decrease of 1% (1.5%) in the absorption (emission) energy going from 6-31G to 6-31G*, but only a decrease of 0.2% (0.5%) going from 6-31G* to 6-311G**. For this molecule, moving from 6-31G to 6-31G* increased the absorption (emission) dipole moment by 5.3% (3.7%) and decreased it by 4.2% (1.6%) when using 6-311G** instead of 6-31G*. We also checked that dispersion correction (GD3BJ) could be neglected (see ESI†). Last, all calculations have been conducted in vacuum to reduce the computational effort. We have verified that the inclusion of solvent does not change the results significantly (see ESI†).
We have built a series of molecules with increasing length, to estimate the oligomer length necessary to reach a length representative of the polymer. We have chosen the fluorene octamer (O8) to represent polyfluorene.35 For the copolymers, we typically find the conjugation length to be between 3 and 4 units (see Results section). We have checked the convergence of both the ground-state and excited-state properties with oligomer length to make sure that no edge effects occur in the calculations (see Results section, Fig. 8) Unless specified otherwise, the oligomers are made alternately of the two co-polymer species, so that two units of the same species are not next to each other (see Fig. S1 of the ESI†). We have checked that even if this is not necessarily the case in the experiments (the co-polymers used are “random co-polymers”), the electronic transition energies and dipoles do not change significantly from this “ideal” case (see Results section). Additionally, the oligomers are in the “helix” conformation, or “α-phase”35,46 (the dihedral angles along the chains always have the same sign, see Fig. S1 of ESI†), as this corresponds to the geometry of overall energy minimum in fluorenes, and is consistent with previously published calculated geometries of (short) oligomers of F8TFB, F8PFB and F8BT.40,41 We have checked that other geometrical conformations do not change significantly the absorption, photo-luminescence and excited-state results (see Results).
The change in electron density plots have been obtained by subtracting the total electronic densities of the two relevant states (the first excited-state density minus the ground-state density for ground-state absorption or photoluminescence, or the excited-state density or the excited-states involved in the particular ESA transition) and generated using Gaussview5.47 To give a more quantitative description of the delocalisation of these change in electron density, we calculated their radii of gyration rg: 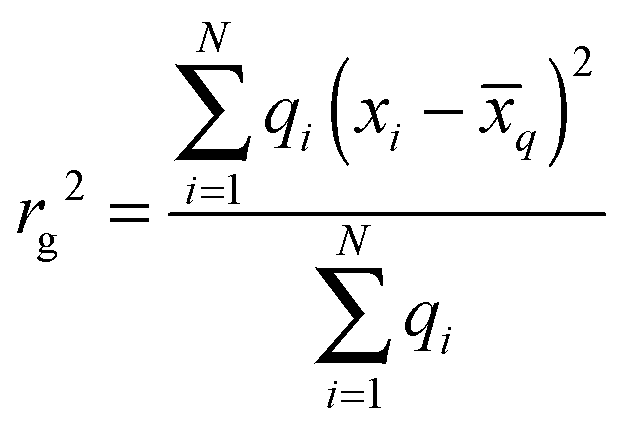 , where N is the number of atoms of the molecule, qi is the difference of the ESP48 charges of atom i between the electronic states involved in the corresponding transition (only positive qi are considered, otherwise rg ≈ 0). xi is the 3D coordinate of atom i, and
  , is the location of the centre of charge.
We present the theoretical results as spectra. Each spectrum is the sum of individual Lorentzians, each centered around the electronic transition energy, and with a magnitude of their oscillator strength. The width each of these Lorentzian is the homogeneous broadening γ. It is set to γ = 33 meV for the ground-state absorption and photoluminescence (a value obtained by a fit between the experimental and theoretical absorption and emission spectra49) for the results of Fig. 9, and γ = 150 meV for the ESA spectra – for the results of Fig. 4(a) and 10.
Results and discussion
Ground state-absorption and photoluminescence
The theoretical results are summarised in Table 1. For comparison, experimental results are presented in Fig. 2. The ground-state transition energies calculated by CAM-B3LYP are higher by ∼0.6 eV than the experimental peaks. Similar results have been obtained before.36,50 We however observe good qualitative agreement: the fluorene octamer (O8) has slightly higher transition energies than both F8TFB and F8PFB in the calculations (about 0.1 eV); in the experiments PFO possess spectra at slightly higher energies (around 0.1 eV) than for F8TFB and F8PFB. F8TFB and F8PFB exhibit extremely similar spectra, with the exception that the Stokes shift of F8TFB is slightly smaller than for F8PFB. These features are observed both experimentally and theoretically. The theory predicts F8BT to have ground-state transition energies lower by about 0.6 eV than all the other molecules; this is observed experimentally. | ||
| Fig. 2 Experimental ground-state absorption (black solid lines) and photoluminescence (red dotted lines) spectra of fluorene pentamer, polyfluorene, F8TFB copolymer, F8PFB copolymer and F8BT copolymer in dilute solutions in toluene. Photoluminescence spectra were measured with excitation at 3.4 eV. | ||
Therefore, if the quantitative agreement between the results obtained with the CAM-B3LYP functional and the experiments is rather limited, we still observe good qualitative agreement. This is important to establish before any further work to attempt at predicted excited-state absorption spectra is undertaken.
To understand the nature of these electronic transitions, we display the changes in electronic densities between the S0 and S1 states in Fig. 3. We observe that the non-relaxed excitation, in the S0 geometry (Franck–Condon state), is delocalised over significant parts of all molecules. More specifically, in fluorene, the excitation is delocalised over about 5 units in the Franck–Condon state, before molecular relaxation traps the excitation around about three monomer units (this is consistent with previous literature35). Therefore, the pentamer and octamer exhibit very similar behaviour; only the latter molecule is displayed in Fig. 3. In F8PFB and F8TFB, the excitation in the Franck–Condon state is delocalised over 3 fluorenes and 2 TFB units in F8TFB (Fig. 3(c)), whereas it is delocalised over 2 fluorene and 2 PFB units in F8PFB (Fig. 3(e)). The length of the exciton delocalisation is almost the same for these two molecules. Indeed, the “backbone” of the TFB unit is made of two benzene rings, while there are three in a PFB unit. A fluorene unit is made of two benzene rings, so that the excitation is delocalised over ten benzene rings in both the F8TFB and F8PFB molecules, very similarly to the polyfluorene molecule (Fig. 3(a)). Therefore, it appears that, surprisingly, the nitrogen atoms of the TFB and PFB units do not disturb the electronic conjugation along the polymer backbone. Indeed, except for the geometrical consequence of the presence of this atom in the molecule (the resulting “zig-zag” shape), it does not seem to provide much electronic change compared to a straight backbone made of carbon atoms. When these molecules relax, self-trapping is observed, with localisation of the exciton on the central fluorene unit and the benzene units belonging to the nearby PFB (Fig. 3(f)) or TFB units (Fig. 3(d)). This explains why F8PFB and F8TFB have almost the same emission energies; in the relaxed state, these two molecules seem to have extremely similar exciton delocalisation. In addition, the molecule becomes more planarised around the region where the exciton localises, as shown in Fig. S2 of ESI.† In F8BT, the Franck–Condon state excitation is delocalised over 3 fluorenes and 2 BT units in F8BT (Fig. 3(g)); upon geometry relaxation, we observe the excitation being localised around the BT units (Fig. 3(h)). Therefore, charges become more separated after relaxation in F8BT than in F8PFB and F8TFB. These last two polymers do not exhibit any characteristics that indicate a separation between the hole and electron, probably due to the fact that the exciton localises around a fluorene unit rather than a PFB or TFB unit.
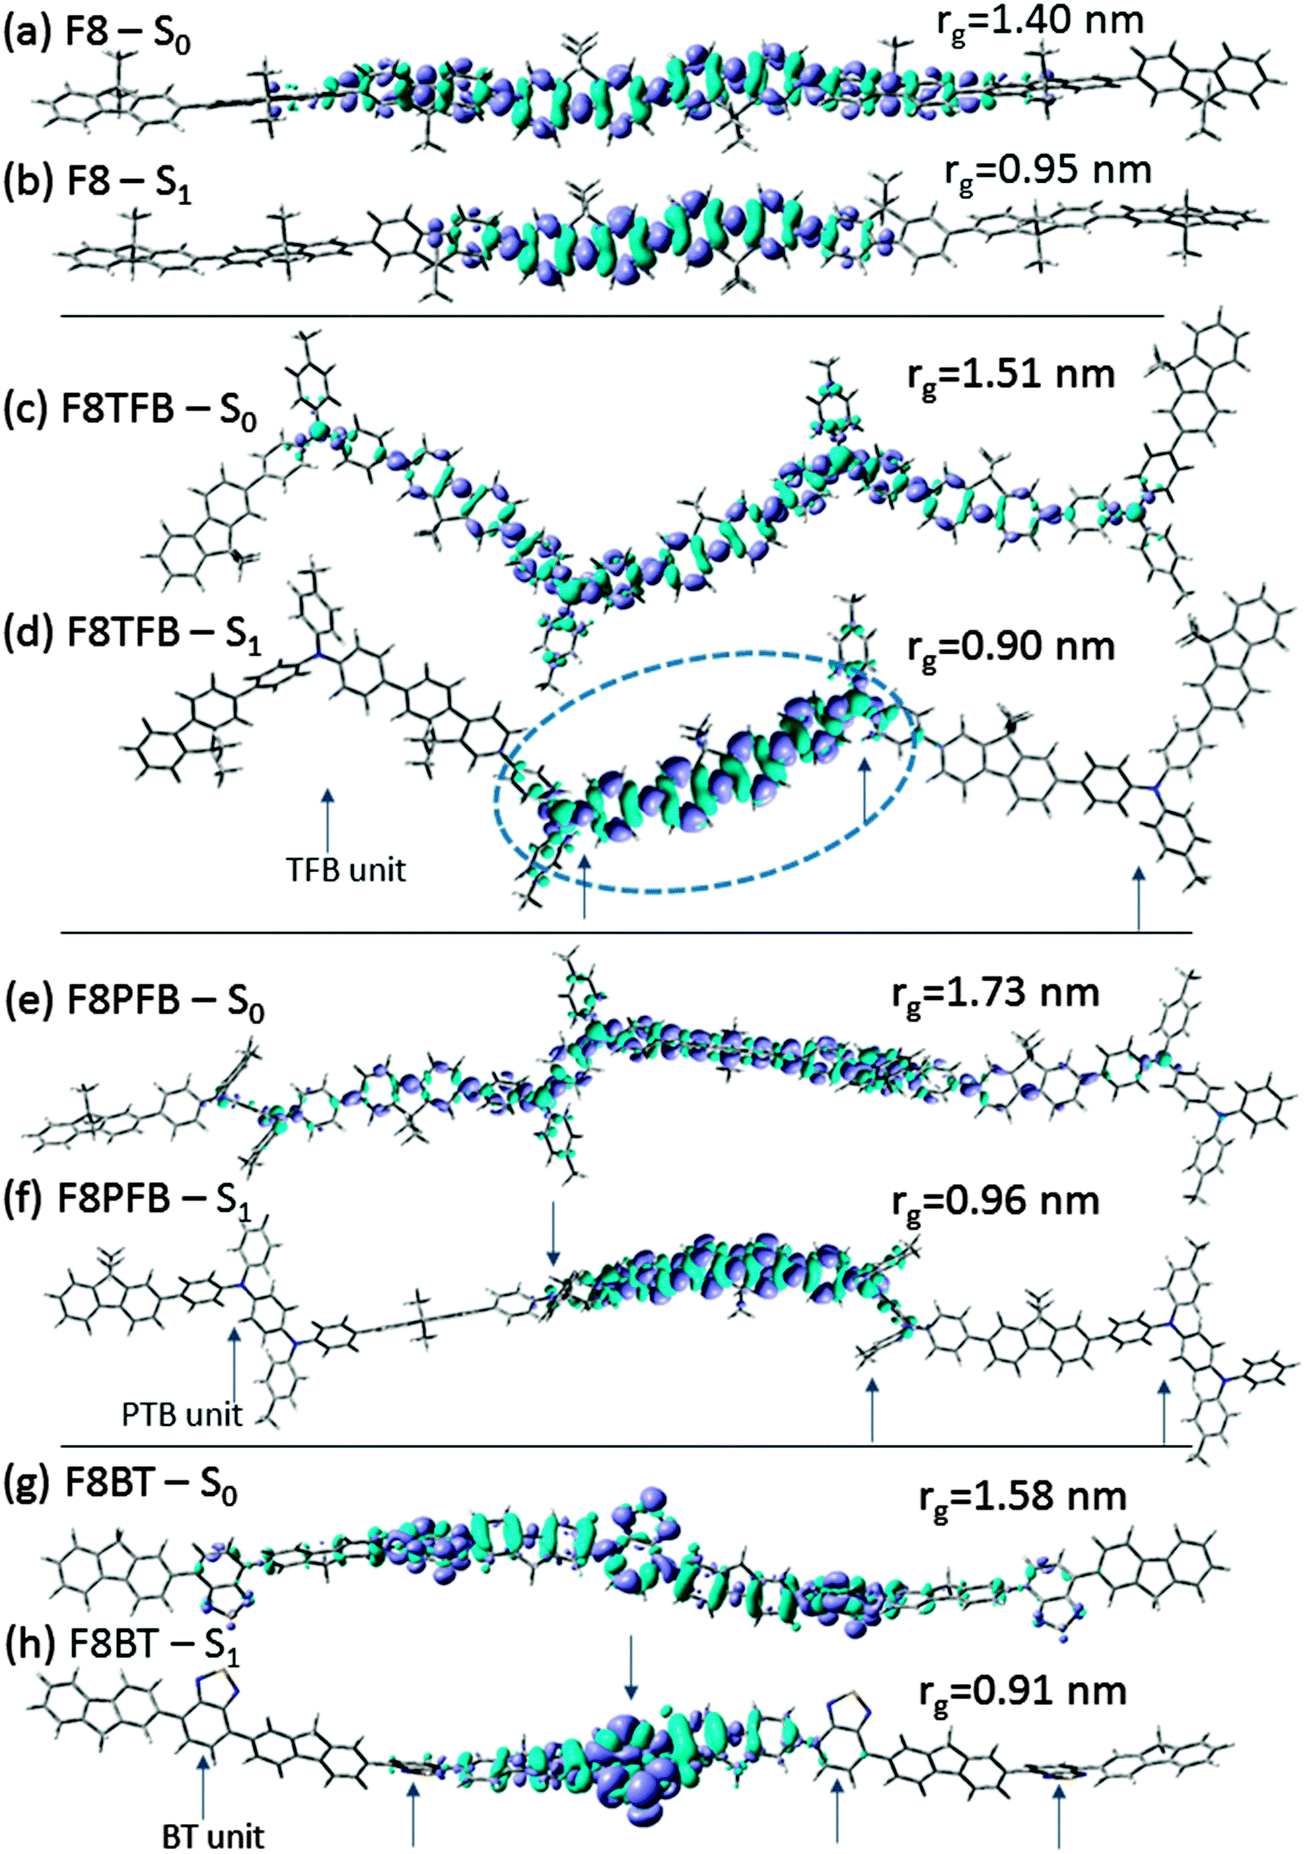 | ||
| Fig. 3 Plot of the electron density changes (a), (c), (e) and (g) between the n0 and n1 electronic states, on the geometry (absorption) and (b), (d), (f) and (h) between the n0 and n1 electronic states, on the S1 geometry (emission), for fluorene octamer (a) and (b), F8TFB (c) and (d), F8-PFB (e) and (f) and F8BT (g) and (h). The TFB, PFB and BT units are indicated by arrows. In (d) the region marked by a dotted blue line is expanded in Fig. 6. | ||
Excited-state absorption
The theoretical results for excited-state absorption of each homo- and co-polymer we studied are presented in Fig. 4(a). The actual molecules used in these calculations are presented in Fig. S1 of the ESI.† For these ESA calculations, the excited molecules are fully relaxed to the S1 geometry (we found no significant change for molecules in their Franck–Condon state, see further results and Fig. 7). The energy range for which we display these spectra is from 0 up to 2.2 eV, as we are confident the molecules are below the ionisation band at such energies (see ionisation energies provided in Table 1). | ||
| Fig. 4 (a) Calculated ESA spectra for the five molecules we studied. The results presented here correspond to ESA from the first-state, in the fully-relaxed S1 molecular geometry. We used a homogeneous broadening of 150 meV. (b) Experimental ESA spectra, recorded 1 ps after excitation at 3.1 eV for the five molecules we studied. | ||
We notice that according to the calculation, the ESA spectra of all molecules are dominated by a strong electronic peak located between 1 eV and 1.5 eV. The co-polymers possess either smaller peaks at low energy (F8TFB and F8PFB) or one smaller peak at higher energy (F8BT, around 1.55 eV). As expected, F8TFB and F8PFB ESA spectra look very similar.
Fig. 4(b) shows the corresponding experimental results, which are measured by transient absorption in toluene solution, 1 ps after a pump probe at 3.1 eV. We observe that the theoretical and experimental results are qualitatively similar. Indeed, the experimental results for the fluorenes show one clear electronic peak around 1.6 eV (in agreement with previously published results51), which is well predicted by the calculations, with one single electronic feature in the theoretical ESA spectra, around 1.4 eV (even though it could be made of transitions to two (octamer) or three (pentamer) higher electronic states). This theoretical prediction is in excellent agreement with results published previously for fluorene oligomers,25 which were obtained without using the ATDA approximation, but directly by quadratic response theory. These results are also in reasonable agreement with real-time TD-DFT (RT-TD-DFT) approaches developed very recently, where better agreement with QR-TD-DFT is seen for the longer of the two fluorene oligomers studied.52
Both in the calculations and in the experiment, F8TFB and F8PFB have very similar ESA spectral shapes. This is consistent with the ground to excited-state absorption and emission results, which indicate very similar electronic behaviours between the two molecules, as if the nitrogen atoms did not disturb the conjugation along the molecules. The predicted low energy (below 1 eV) transitions, of smaller oscillator strength than the main electronic transition at higher energy (around 1.5 eV), are also observed in the experiments, with the energy difference between these peaks being around 1 eV both experimentally and theoretically. It is however clear that the observed ratio of the strength of the peaks at low and high energies is not well reproduced by the theory. The detailed origin of this discrepancy remains to be uncovered. A possible explanation could come from the fact that only electronic states are calculated with DFT-TDA; as there are quite a few weakly allowed- electronic states on the low energy side, the associated vibrational states will be numerous at low energy and could add-up to create a strong low energy ESA peak, as seen in the experiments. Alternatively, we note the discrepancy is much larger for the triphenylamine containing polymers, which may indicate that the nitrogen atoms in the backbone are playing an important role.
The picture is different for F8BT; indeed its main electronic transition is predicted and measured at an energy smaller than for the other molecules (around 1.3 eV, both experimentally and theoretically), and it does not possess any other electronic peaks at lower energies (but does instead at higher energies), contrary to F8TFB and F8PFB. This feature is observable both from the calculations and from the experiments.
To explore further the fundamental mechanisms giving rise to ESA transitions and to differences in the ESA between these molecules, we have plotted the changes in electronic densities between the relevant states involved in the optically active electronic ESA transition. In the rest of this report, we call nx the electronic density corresponding to the xth excitation of the molecule, irrespective of its geometry (the S0 or S1-state). The change in electronic densities between the n1 and ny (y > 1) electronic excitation giving rise to strong ESA peaks are displayed in Fig. 5. For the fluorene octamer, Fig. 5(a) shows the density change corresponding to the main electronic ESA peak, around 1.4 eV. The weaker ESA peak at slightly higher energy corresponds to a very similar change of electronic density. We notice that the electronic density change is not significant, and corresponds roughly to the density change observed for the regular emission transition, except the sign of charges are opposite. In F8TFB (Fig. 5(b) and (c)), we find that the main electronic ESA transitions (the three around 1.45 eV; in the figure we plotted the strongest one, but the other two looks identical) result in “switching” the position of the electron and holes from where they originally rested on the fully relaxed excited molecule, very similarly to the fluorene oligomers. A close-up illustration of this is given in Fig. 6, where the circled parts of the F8TFB fully relaxed molecule of Fig. 3(d) and 5(c) have been magnified. The way the transition densities have been calculated being consistent (density of the state to where we excite minus the state from where we excite), we notice pretty much the same distribution on the molecule, except the colours have been swapped, denoting a change of sign in the charge. The low energy, weaker ESA transition around 0.9 eV gives rise to a similar phenomenon, but with a slightly more delocalised exciton on the end units of the molecules (Fig. 5(c)). Very similar mechanisms are observed in F8PFB, confirming that these two molecules, F8TFB and F8PFB, behave in extremely similar ways despite the presence of the nitrogen atoms in different numbers, and almost like the polyfluorene molecules, at least regarding the main electronic ESA peak. We observe that in F8BT, the main transition (to the n6 state, at 1.25 eV) originates from the excitation charges simply swapping places (Fig. 5(d)), similar to the observation for fluorene oligomers, F8TFB and F8PFB. However, the smaller electronic peak (transition from n1 to n8) at higher energy (1.5 eV) gives rise to a charge transfer from the BT unit where the exciton was initially localised to another BT unit (Fig. 5(e)), resulting in a charge-transfer state, with electron and holes separated on two distinct BT units.
 | ||
| Fig. 5 Change in electron densities between the (a) n1 and n7 electronic states (corresponding to the ESA transition at 1.4 eV) in fluorene octamer (b) n1 and n6 electronic states (corresponding to the ESA transition at 0.91 eV) in TFB, (c) n1 and n17 electronic states (corresponding to the ESA transition at 1.47 eV) in TFB (zoomed in), and (d) n1 and n6 electronic states (corresponding to the ESA transition at 1.21 eV), (e) n1 and n8 electronic states (corresponding to the ESA transition at 1.52 eV) in F8BT. The geometry is always the relaxed S1 geometry. The TFB and BT units are indicated by arrows. In (c) the region marked by a dotted blue line is expanded in Fig. 6. | ||
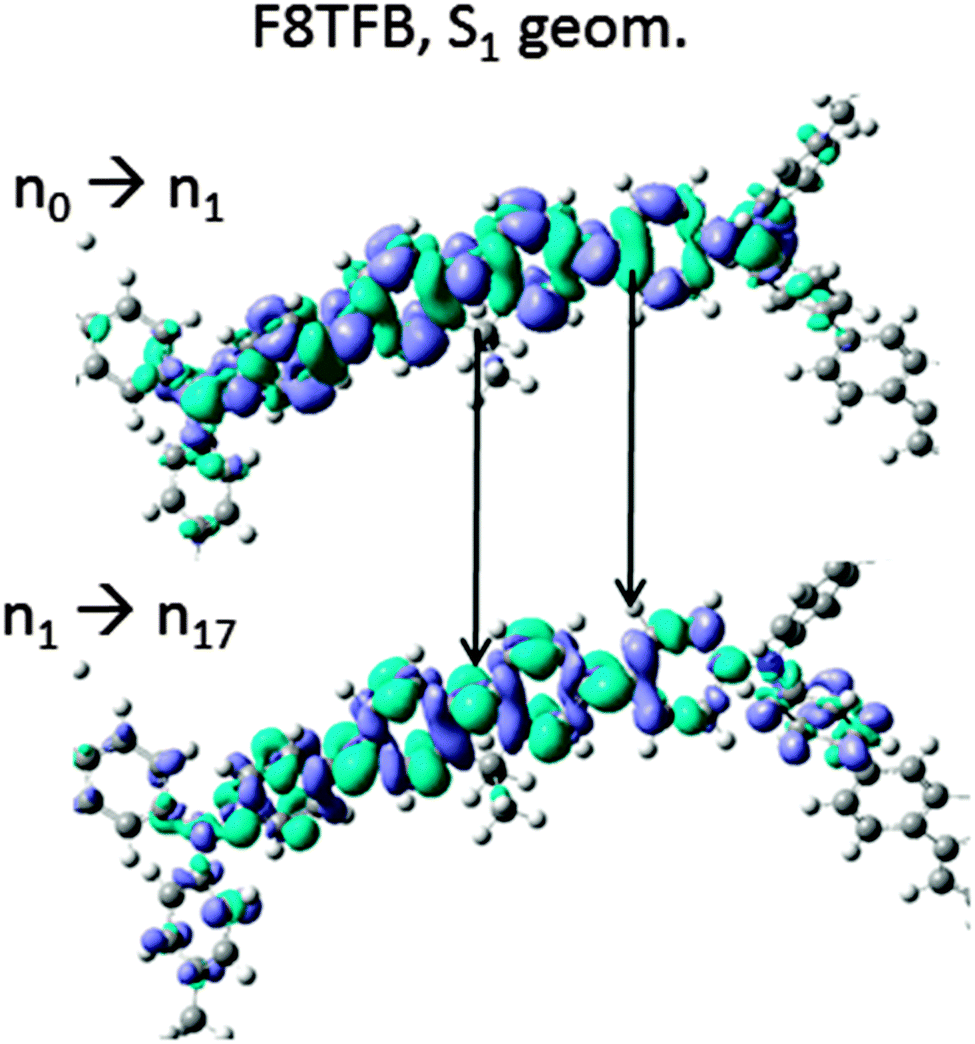 | ||
| Fig. 6 Zoomed in plot of the molecular portions of F8TFB circled in Fig. 3 and 5: the top plot is the change in electron density between the ground-state, non-excited molecule, and the first excited-state n1; the bottom plot is the change of electronic density between the electronic density of the first excited-state n1 and the excited-state n17, corresponding to the main electronic ESA peak. | ||
Therefore, in all the molecules studied, we can assign that the main electronic ESA peak comes from an inversion of the charge density of the relaxed excitation. The fluorene oligomers do not possess any other electronic transitions, but the co-polymers do. TFB and PFB see some charge being re-organised over a long distance, F8PFB one repeat unit away from where the original excitation was located, whereas in F8BT, the weaker, higher energy electronic peak arises from the transfer of charges from a BT unit to a neighbouring one.
We also observe that the ESA spectra are much less sensitive to the geometrical relaxation of the excited molecule from the S0 (Franck–Condon) geometry to the fully relaxed S1 geometry, than are the ground-to excited-state transitions. Indeed, in Fig. 7 we observe a shift in the electronic peaks of the ESA spectra of 0.2 eV at the most (in F8BT) whereas the ground-state absorption and emission shift is at least 0.5 eV (Table 1). A possible explanation for this is that the geometry relaxation in all these molecules induces self-trapping of the exciton and an associated planarization of the molecule. When a chromophore becomes more planar, its conjugation strengthens and consequently the excitation energies are all decreased. For the ESA (produced from transitions between excited states), this change of excitation energy due to molecular planarization is therefore much less drastic than the ground-to-excited state transition.
 | ||
| Fig. 7 Comparison of the ESA spectra (left panel) calculated for the Franck–Condon state (excited molecule in the ground state geometry), in dashed black lines, and the fully relaxed excited molecule (S1 geometry), in red solid lines, and the ground-state absorption and emission spectra (right panel), respectively in dashed black lines and red solid lines. | ||
We have also studied theoretically the convergence of the electronic transition properties with oligomer length, as displayed in Fig. 8, where we plotted the energies and dipole moments of the S0 to S1 transitions and the main peak of the ESA spectra for both the fully relaxed S0 and S1 geometries. We notice that the transition energies converge much quicker for a fully relaxed molecule in the S1 geometry, due the smaller size of the relaxed exciton, compared to the non-relaxed one. The ESA and ground-to-excited-state energies evolve similarly, except that we observe an increase of the ESA energy peak with oligomer length for molecules in their Franck–Condon states. Transition dipoles all follow a very similar trend, except for the ground-state absorption dipole, which converges much slower than the dipole moment of any other transition.
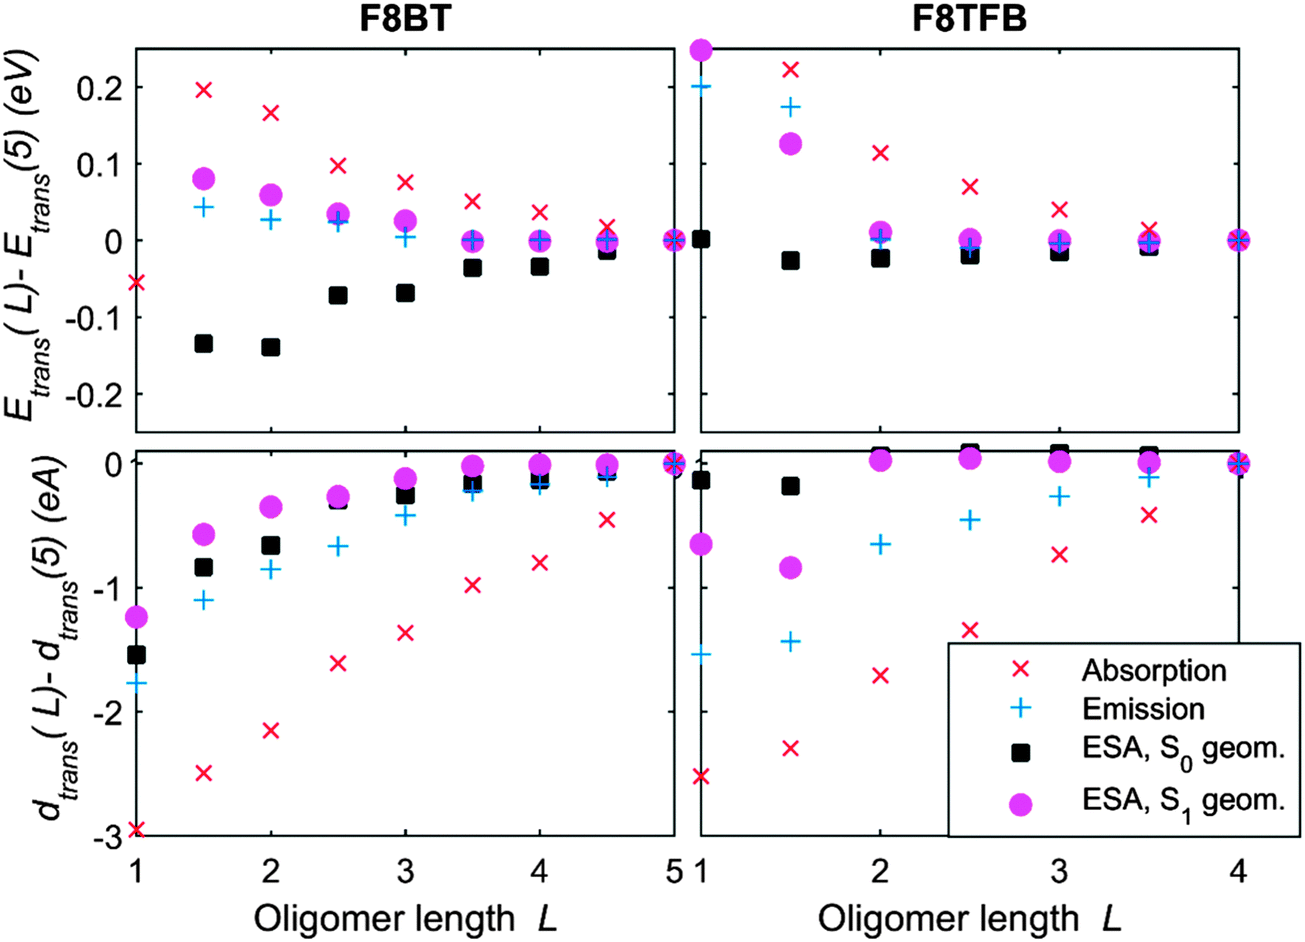 | ||
| Fig. 8 Plot of the relative change in transition energies (top graph) and transition dipoles (bottom graph), to the values for the longest oligomer we calculated, for F8BT 50/50 (left) and F8TFB (right). The blue and red crosses are respectively the ground state absorption and emission transitions, and the solid marks are the ESA transitions, in the Franck–Condon state (squares) or fully-relaxed S1 geometry (circles). | ||
Influence of the sub-unit order along the molecular chain
We have calculated the absorption/emission and ESA spectra for F8TFB molecules which do not follow the strict F8 and TFB ordering. As the co-polymers investigated are random co-polymers such orderings are very likely to exist. The two molecules studied in the calculations are presented in Fig. 9. The corresponding spectral results are presented in Fig. 10 and 11. We observe that the inclusion of an additional F8 unit between 2 TFB units (so that the chain is F8TFB-F8-F8TFB-F8) does not change the absorption/emission results in a significant way (it is very similar to F8TFB-F8TFB-F8), whereas the ESA spectra is shifted to lower energies, mimicking more closely the ESA spectra of the fluorenes. For the TFB-TFB-F8TFB-F8 molecule, we observe that the absorption spectra is different from the regular ⋯-TFB-F8TFB-F8-⋯ molecules; however the emission energy is pretty much the same, probably due to very similar exciton localisation, on the central fluorene units and the two benzene rings from the surrounding TFB units. For this reason, the ESA spectra of this TFB-TFB-F8TFB-F8 molecule is very similar to that of the regular molecule with alternating units.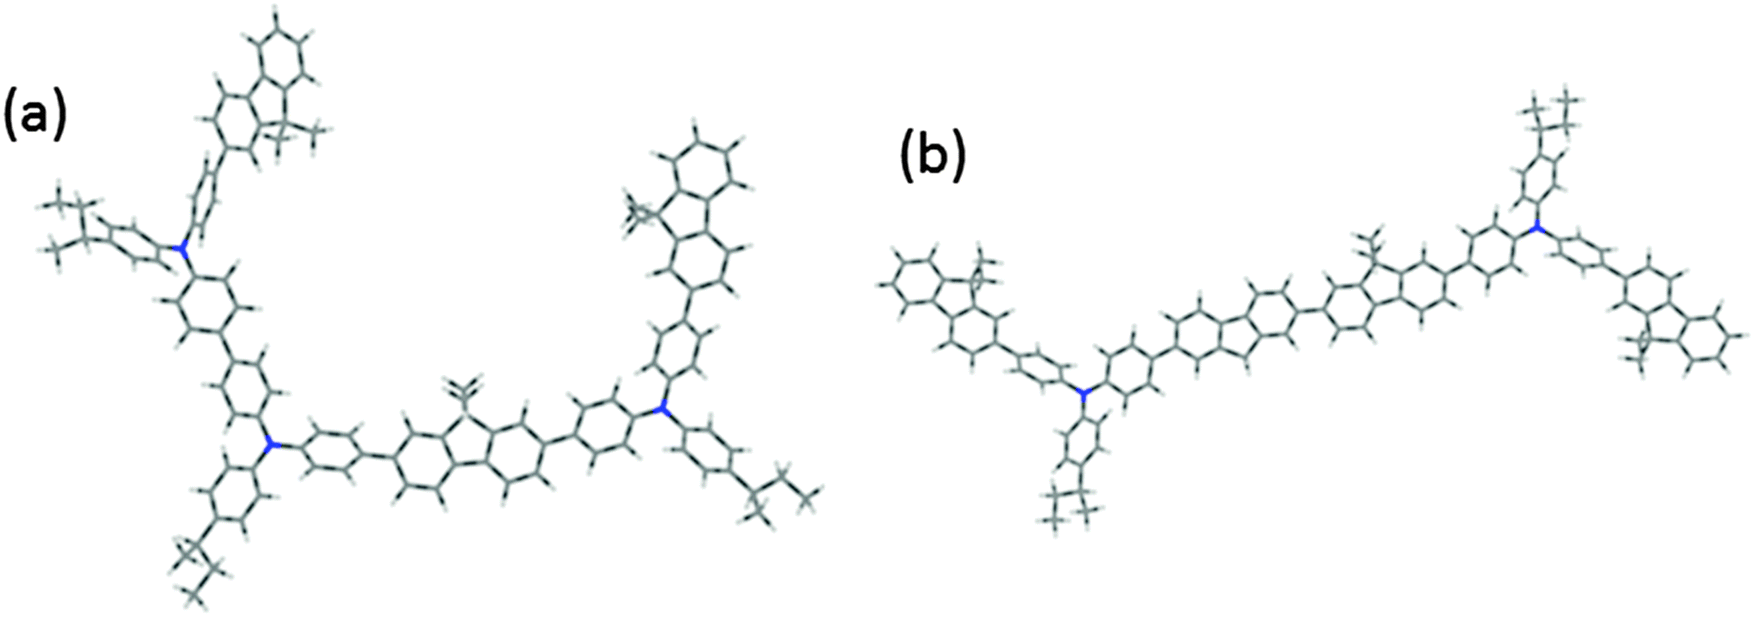 | ||
| Fig. 9 Sketch of a F8TFB molecule made of units as follow: (a) TFB-TFB-F8TFB-F8 (“Config. 1”) and (b) F8TFB-F8-F8TFB-F8 (“Config. 2”) rather than the regular ⋯-TFB-F8TFB-F8-⋯ used in the rest of this article. | ||
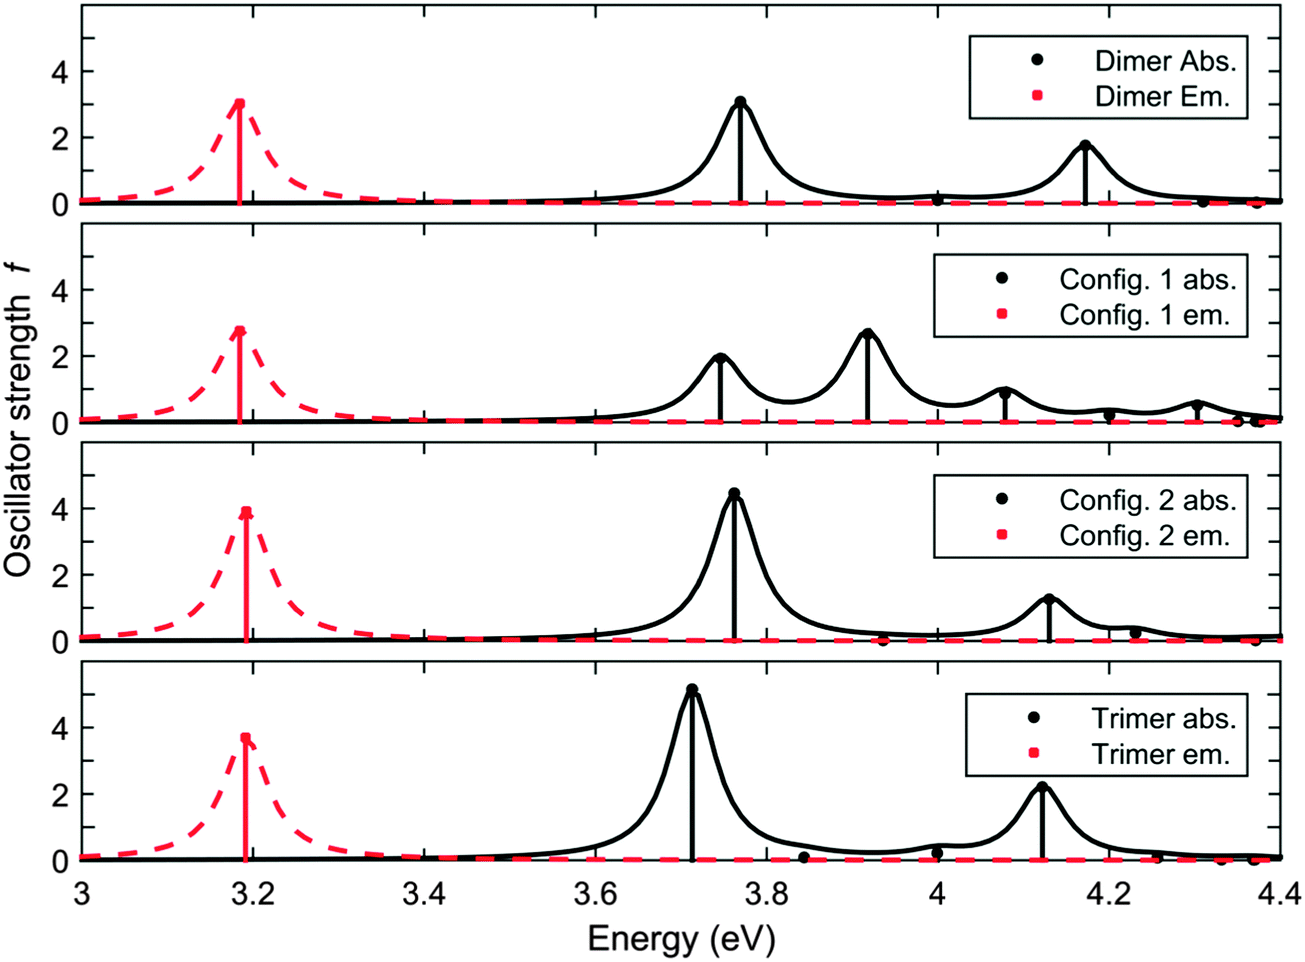 | ||
| Fig. 10 Calculated absorption and emission spectra of the F8TFB-F8TFB-F8, TFB-TFB-F8TFB-F8, F8TFB-F8-F8TFB-F8, F8TFB-F8TFB-F8TFB-F8 molecules, in this order. | ||
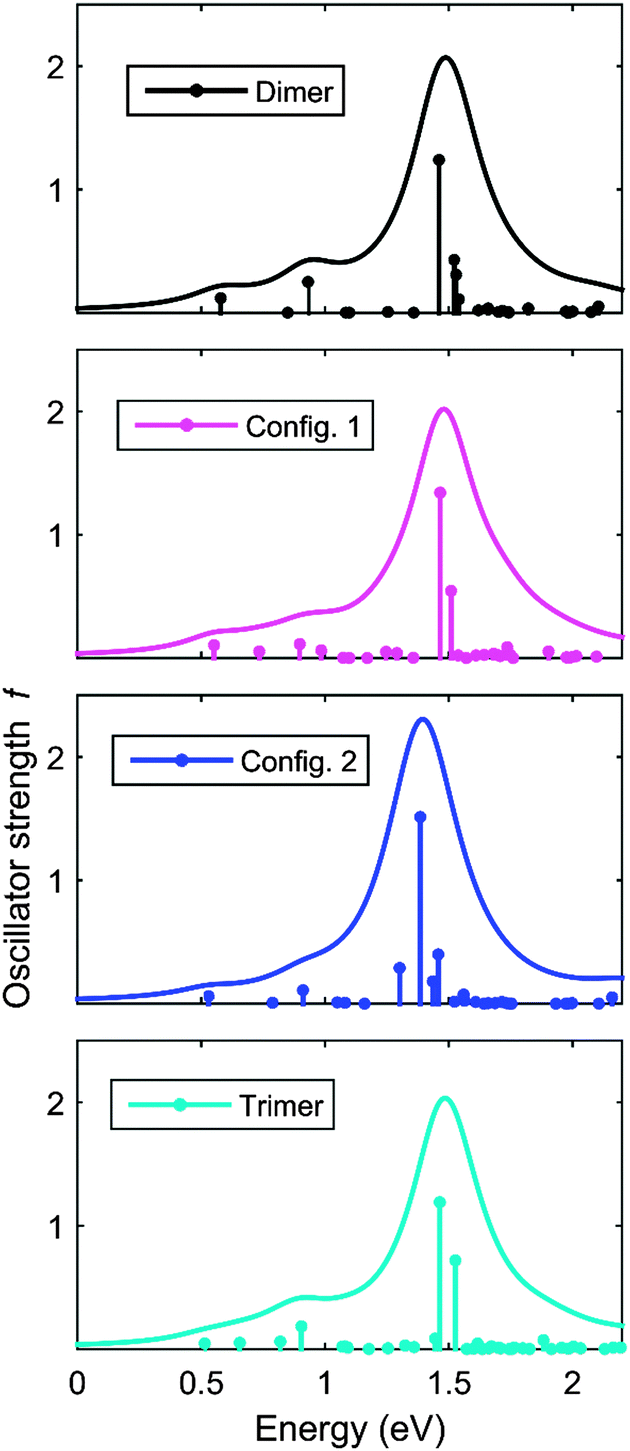 | ||
| Fig. 11 Calculated ESA spectra of the F8TFB-F8TFB-F8, TFB-TFB-F8TFB-F8, F8TFB-F8-F8TFB-F8, F8TFB-F8TFB-F8TFB-F8 molecules, in this order. | ||
Therefore, over the spectral range of this study, we believe that the “model molecules” used in the calculations, with alternating co-polymers units are relevant to describe experimental results, even though the molecules involved in the experiments may not exactly follow this ideal alternating arrangement.
Conclusions
We have calculated and measured the absorption, emission and ESA spectra in fluorene homo-polymers and a variety of fluorene-based co-polymers. We observed that F8PFB and F8TFB behave very similarly, with exciton self-trapping occurring on the fluorene units when the molecules relax to their excited-state geometries, in a similar fashion as for straight fluorene oligomers. This indicates that the nitrogen atoms barely influence the electronic conjugation along the polymer backbones. In contrast, in F8BT, self-trapping occurs primarily on one BT unit, giving rise to an ESA spectra significantly different from the other molecules. In all cases, the ESA spectra consist of one strong electronic transition which produces a “switching” of the charge parity of the original excitation. The ESA spectra of fluorene oligomers do not show any secondary peaks, but F8TFB and F8PFB feature lower energies, weaker peaks, which show additional delocalisation of the charges. In contrast, the F8BT ESA spectra exhibits one higher energy and weaker peak, corresponding to a displacement of charge from one BT unit to another. Overall, reasonable qualitative agreement is found between the experiments and the calculations. Finally, whereas molecular relaxation gives rise to a significant Stokes shift in all these molecules, the ESA spectra is relatively insensitive to such conformational changes.Acknowledgements
We are grateful to Cambridge Display Technology for the supply of the PFO polymer and the copolymers. We thank the EPSRC [EP/J009318/1 and EP/J009016/1] for funding. MJP and IDWS thank the European Research Council (ERC) for funding under the European Union’s Seventh Framework Programme (FP7/2007-2013)/ERC Grant Numbers 258990 and 321305. IDWS acknowledges support from a Royal Society Wolfson Research Merit Award. We would also like to thank Prof. Dr Stefan Schumacher, Dr Peter McDonald and Mr Jack Wildman for useful discussions. The research data supporting this publication can be accessed at http://dx.doi.org/10.17630/484fcd94-6f52-4911-9552-3e5d52be0192.References
- B. Bolto, R. McNeill and D. Weiss, Aust. J. Chem., 1963, 16, 1090–1103 CrossRef CAS.
- A. Tsumura, H. Koezuka and T. Ando, Appl. Phys. Lett., 1986, 49, 1210–1212 CrossRef CAS.
- C. W. Tang and S. A. VanSlyke, Appl. Phys. Lett., 1987, 51, 913–915 CrossRef CAS.
- R. Xia, C. Cheung, A. Ruseckas, D. Amarasinghe, I. D. W. Samuel and D. D. C. Bradley, Adv. Mater., 2007, 19, 4054–4057 CrossRef CAS.
- S. Perissinotto, G. Lanzani, M. Zavelani-Rossi, M. Salerno and G. Gigli, Appl. Phys. Lett., 2007, 91, 191108 CrossRef.
- D. Amarasinghe, A. Ruseckas, A. E. Vasdekis, G. A. Turnbull and I. D. W. Samuel, Appl. Phys. Lett., 2008, 92, 083305 CrossRef.
- J. Clark and G. Lanzani, Nat. Photonics, 2010, 4, 438–446 CrossRef CAS.
- J. Clark, T. Nelson, S. Tretiak, G. Cirmi and G. Lanzani, Nat. Phys., 2012, 8, 225–231 CrossRef CAS.
- Q. Bellier, N. S. Makarov, P.-A. Bouit, S. Rigaut, K. Kamada, P. Feneyrou, G. Berginc, O. Maury, J. W. Perry and C. Andraud, Phys. Chem. Chem. Phys., 2012, 14, 15299–15307 RSC.
- N. A. Montgomery, G. J. Hedley, A. Ruseckas, J.-C. Denis, S. Schumacher, A. L. Kanibolotsky, P. J. Skabara, I. Galbraith, G. A. Turnbull and I. D. W. Samuel, Phys. Chem. Chem. Phys., 2012, 14, 9176–9184 RSC.
- D. Polli, P. Altoe, O. Weingart, K. M. Spillane, C. Manzoni, D. Brida, G. Tomasello, G. Orlandi, P. Kukura, R. A. Mathies, M. Garavelli and G. Cerullo, Nature, 2010, 467, 440–443 CrossRef CAS PubMed.
- A. P. Kulkarni, Y. Zhu and S. A. Jenekhe, Macromolecules, 2005, 38, 1553–1563 CrossRef CAS.
- R. Xia, G. Heliotis, Y. Hou and D. D. C. Bradley, Org. Electron., 2003, 4, 165–177 CrossRef CAS.
- M. A. Stevens, C. Silva, D. M. Russell and R. H. Friend, Phys. Rev. B: Condens. Matter Mater. Phys., 2001, 63, 165213 CrossRef.
- M. Tong, C. X. Sheng and Z. V. Vardeny, Phys. Rev. B: Condens. Matter Mater. Phys., 2007, 75, 125207 CrossRef.
- A. Petrozza, F. Laquai, I. A. Howard, J.-S. Kim and R. H. Friend, Phys. Rev. B: Condens. Matter Mater. Phys., 2010, 81, 205421 CrossRef.
- P. Cronstrand, O. Christiansen, P. Norman and H. Agren, Phys. Chem. Chem. Phys., 2000, 2, 5357–5363 RSC.
- P. Cronstrand, O. Christiansen, P. Norman and H. Agren, Phys. Chem. Chem. Phys., 2001, 3, 2567–2575 RSC.
- A. Shukla, H. Ghosh and S. Mazumdar, Phys. Rev. B: Condens. Matter Mater. Phys., 2003, 67, 245203 CrossRef.
- A. Shukla, H. Ghosh and S. Mazumdar, Synth. Met., 2004, 141, 59–65 CrossRef CAS.
- H. Ghosh, Synth. Met., 2005, 155, 439–442 CrossRef CAS.
- J. Gierschner, J. Cornil and H. J. Egelhaaf, Adv. Mater., 2007, 19, 173–191 CrossRef CAS.
- J.-L. Brédas, Adv. Mater., 1995, 7, 263–274 CrossRef.
- K. Burke, J. Werschnik and E. K. U. Gross, J. Chem. Phys., 2005, 123, 062206 CrossRef PubMed.
- S. Ling, S. Schumacher, I. Galbraith and M. J. Paterson, J. Phys. Chem. C, 2013, 117, 6889–6895 CAS.
- P. N. Day, R. Pachter and K. A. Nguyen, J. Chem. Phys., 2014, 140, 184308 CrossRef PubMed.
- P. N. Day, K. A. Nguyen and R. Pachter, J. Phys. Chem. B, 2005, 109, 1803–1814 CrossRef CAS PubMed.
- M. M. Alam, Phys. Chem. Chem. Phys., 2014, 16, 26342–26347 RSC.
- A. Masunov and S. Tretiak, J. Phys. Chem. B, 2004, 108, 899–907 CrossRef CAS.
- M. A. Salem and A. Brown, J. Chem. Theory Comput., 2014, 10, 3260–3269 CrossRef CAS PubMed.
- A. Rizzo and H. Agren, Phys. Chem. Chem. Phys., 2013, 15, 1198–1207 RSC.
- M. T. P. Beerepoot, D. H. Friese, N. H. List, J. Kongsted and K. Ruud, Phys. Chem. Chem. Phys., 2015, 17, 19306–19314 RSC.
- I. H. Nayyar, A. E. Masunov and S. Tretiak, J. Phys. Chem. C, 2013, 117, 18170–18189 CAS.
- T. Yanai, D. P. Tew and N. C. Handy, Chem. Phys. Lett., 2004, 393, 51–57 CrossRef CAS.
- S. Schumacher, A. Ruseckas, N. A. Montgomery, P. J. Skabara, A. L. Kanibolotsky, M. J. Paterson, I. Galbraith, G. A. Turnbull and I. D. W. Samuel, J. Chem. Phys., 2009, 131, 154906 CrossRef PubMed.
- N. A. Montgomery, J.-C. Denis, S. Schumacher, A. Ruseckas, P. J. Skabara, A. Kanibolotsky, M. J. Paterson, I. Galbraith, G. A. Turnbull and I. D. W. Samuel, J. Phys. Chem. A, 2011, 115, 2913–2919 CrossRef CAS PubMed.
- M. J. Paterson, O. Christiansen, F. Pawłowski, P. Jørgensen, C. Hättig, T. Helgaker and P. Sałek, J. Chem. Phys., 2006, 124, 054322 CrossRef PubMed.
- I. A. Mikhailov, S. Tafur and A. E. Masunov, Phys. Rev. A: At., Mol., Opt. Phys., 2008, 77, 012510 CrossRef.
- M. J. Frisch, G. W. Trucks, H. B. Schlegel, G. E. Scuseria, M. A. Robb, J. R. Cheeseman, G. Scalmani, V. Barone, B. Mennucci, G. A. Petersson, H. Nakatsuji, M. Caricato, X. Li, H. P. Hratchian, A. F. Izmaylov, J. Bloino, G. Zheng, J. L. Sonnenberg, M. Hada, M. Ehara, K. Toyota, R. Fukuda, J. Hasegawa, M. Ishida, T. Nakajima, Y. Honda, O. Kitao, H. Nakai, T. Vreven, J. A. Montgomery, Jr., J. E. Peralta, F. Ogliaro, M. J. Bearpark, J. Heyd, E. N. Brothers, K. N. Kudin, V. N. Staroverov, R. Kobayashi, J. Normand, K. Raghavachari, A. P. Rendell, J. C. Burant, S. S. Iyengar, J. Tomasi, M. Cossi, N. Rega, N. J. Millam, M. Klene, J. E. Knox, J. B. Cross, V. Bakken, C. Adamo, J. Jaramillo, R. Gomperts, R. E. Stratmann, O. Yazyev, A. J. Austin, R. Cammi, C. Pomelli, J. W. Ochterski, R. L. Martin, K. Morokuma, V. G. Zakrzewski, G. A. Voth, P. Salvador, J. J. Dannenberg, S. Dapprich, A. D. Daniels, Ö. Farkas, J. B. Foresman, J. V. Ortiz, J. Cioslowski and D. J. Fox, Gaussian09, Revision C, Gaussian, Inc., Wallingford CT, 2009 Search PubMed.
- J.-S. Kim, L. Lu, P. Sreearunothai, A. Seeley, K.-H. Yim, A. Petrozza, C. E. Murphy, D. Beljonne, J. Cornil and R. H. Friend, J. Am. Chem. Soc., 2008, 130, 13120–13131 CrossRef CAS PubMed.
- Y.-s. Huang, S. Westenhoff, I. Avilov, P. Sreearunothai, J. M. Hodgkiss, C. Deleener, R. H. Friend and D. Beljonne, Nat. Mater., 2008, 7, 483–489 CrossRef CAS PubMed.
- A. Wasserman, N. T. Maitra and K. Burke, J. Chem. Phys., 2005, 122, 144103 CrossRef PubMed.
- J.-L. Bredas, Mater. Horiz., 2014, 1, 17–19 RSC.
- R. Tautz, E. Da Como, C. Wiebeler, G. Soavi, I. Dumsch, N. Fröhlich, G. Grancini, S. Allard, U. Scherf, G. Cerullo, S. Schumacher and J. Feldmann, J. Am. Chem. Soc., 2013, 135, 4282–4290 CrossRef CAS PubMed.
- O. Lehtonen, D. Sundholm, R. Send and M. P. Johansson, J. Chem. Phys., 2009, 131, 024301 CrossRef PubMed.
- S. Fratiloiu, F. C. Grozema, Y. Koizumi, S. Seki, A. Saeki, S. Tagawa, S. P. Dudek and L. D. A. Siebbeles, J. Phys. Chem. B, 2006, 110, 5984–5993 CrossRef CAS PubMed.
- R. Dennington, T. Keith and J. Millam, GaussView, Version 5, Semichem Inc., Shawnee Mission, KS, 2009 Search PubMed.
- B. H. Besler, K. M. Merz and P. A. Kollman, J. Comput. Chem., 1990, 11, 431–439 CrossRef CAS.
- J.-C. Denis, S. Schumacher, G. J. Hedley, A. Ruseckas, P. O. Morawska, Y. Wang, S. Allard, U. Scherf, G. A. Turnbull, I. D. W. Samuel and I. Galbraith, J. Phys. Chem. C, 2015, 119, 9734–9744 CAS.
- T. M. McCormick, C. R. Bridges, E. I. Carrera, P. M. DiCarmine, G. L. Gibson, J. Hollinger, L. M. Kozycz and D. S. Seferos, Macromolecules, 2013, 46, 3879–3886 CrossRef CAS.
- S. C. Hayes and C. Silva, J. Chem. Phys., 2010, 132, 214510 CrossRef PubMed.
- S. A. Fischer, C. J. Cramer and N. Govind, J. Chem. Theory Comput., 2015, 11, 4294–4303 CrossRef CAS PubMed.
Footnote |
| † Electronic supplementary information (ESI) available. See DOI: 10.1039/c6cp02059c |
| This journal is © the Owner Societies 2016 |