 Open Access Article
Creative Commons Attribution 3.0 Unported Licence
Vapor pressure of ionic liquids at low temperatures from AC-chip-calorimetry
Mathias
Ahrenberg
a,
Martin
Beck
b,
Christin
Neise
c,
Olaf
Keßler
bd,
Udo
Kragl
cd,
Sergey P.
Verevkin
cd and
Christoph
Schick
*ad
aInstitute of Physics, University of Rostock, Albert-Einstein-Str. 23-24, 18059 Rostock, Germany. E-mail: christoph.schick@uni-rostock.de
bFaculty of Mechanical Engineering and Marine Technology, University of Rostock, Albert-Einstein-Str. 2, 18059 Rostock, Germany
cInstitute of Chemistry, University of Rostock, Albert-Einstein-Str. 3a, 18059 Rostock, Germany
dCompetence Centre CALOR, Faculty of Interdisciplinary Research, University of Rostock, Albert-Einstein-Str. 25, 18059 Rostock, Germany
First published on 8th July 2016
Abstract
The very low vapor pressure of ionic liquids is challenging to measure. At elevated temperatures the liquids might start to decompose, and at relatively low temperatures the vapor pressure becomes too low to be measured by conventional methods. In this work we developed a highly sensitive method for mass loss determination at temperatures starting from 350 K. This technique is based on an alternating current calorimeter equipped with a chip sensor that consists of a free-standing SiNx-membrane (thickness <1 μm) and a measuring area with lateral dimensions of the order of 1 mm. A small droplet (diameter ca. 600 μm) of an ionic liquid is vaporized isothermally from the chip sensor in a vacuum-chamber. The surface-to-volume-ratio of such a droplet is large and the relative mass loss due to evaporation is therefore easy to monitor by the changing heat capacity (J K−1) of the remaining liquid. The vapor pressure is determined from the measured mass loss rates using the Langmuir equation. The method was successfully tested for the determination of the vapor pressure and the vaporization enthalpy of an archetypical ionic liquid 1-ethyl-3-methylimidazolium bis(trifluoromethylsulfonyl)imide ([EMIm][NTf2]). The data set created in this way in an extremely broad temperature range from 358 K to 780 K has allowed the estimation of the boiling temperature of [EMIm][NTf2]. The value (1120 ± 50) K should be considered as the first reliable boiling point of the archetypical ionic liquid obtained from experimental vapor pressures measured in the most possible close proximity to the normal boiling temperature.
Introduction
Ionic liquids (ILs) exhibit extremely low vapor pressures even at elevated temperatures.1–6 Moreover, they tend to decompose before reaching a measurable vapor pressure by using even well-established conventional techniques.7,8 Thus the reliable vapor pressure determination of ILs is challenging. This constellation of low vapor pressures at the onset temperature of decomposition requires highly sensitive techniques that are able to detect vapor pressures below the onset temperature of decomposition, i.e. ≪1 Pa, in a reasonable time. This narrows the accessible temperature range of vapor pressure determination using common methods, e.g. the Knudsen effusion method or thermogravimetric analysis (TGA), to a few tens of Kelvin.1,2,9,10 In the last decade, many efforts have been undertaken to extend the temperature range of the vapor pressure studies to lower as well as higher temperatures. For example, a reliable method based on the measurement of evaporation rates using a quartz-crystal microbalance has allowed the measurements on ILs to be started even at 350 K.11 The commercially available TGA instruments were adjusted for the determination of IL mass loss rates up to temperatures close to the temperature of decomposition.8,9 Ahrenberg et al.12 successfully combined thermogravimetry with calorimetry and developed a differential fast scanning calorimetry (DFSC) method13 for vapor pressure determination spanning a temperature range of about 400 K for thermally stable ILs.12 The latter method is based on the evaporation of small droplets (diameter is about 100 μm) from a calorimetric chip-sensor by using the proportionality between the measured heat capacity [J K−1] and sample mass of the remaining droplet. The miniaturized sample size results in a large surface-to-volume-ratio of the droplet. In combination with the high heating and cooling rates applicable in DFSC this allows for vapor pressure determination far above the onset of decomposition as determined using slow scanning methods, e.g. TGA. A large surface-to-volume-ratio of such small droplets is the key to success since small amounts of evaporated substance yield a large relative mass change, which is quick and easy to detect. However, the DFSC technique is restricted to lower temperatures due to the long measuring times and the related instrumental stability issues. In this work, in order to extend the measurement range to lower temperatures, an alternating current (AC) chip calorimetry method14 has been adjusted and tested for vapor pressure measurements at low temperatures down to 350 K in a reasonable time and with good instrumental stability.Vapor pressure measurements on an archetypical ionic liquid 1-ethyl-3-methylimidazolium bis(trifluoromethylsulfonyl)imide ([EMIm][NTf2]) have been a popular endeavor in the last decade. A lot of reliable data on this IL have been reported in the literature.1,7,10,12,15,16 Thus this IL becomes a useful reference compound for testing new procedures. The focus of the current work is to develop AC-chip calorimetry for IL vapor pressure measurements at possibly low temperatures. The detailed technical description of the AC-chip calorimeter has been published elsewhere.14,17–19 However, this technique has never been thought of for vapor pressure measurements. In this work, we suggest a possible method to measure mass loss rates and vaporization enthalpies indirectly by heat capacity measurements of the sample.
Heat capacities measured using AC chip calorimetry were treated using the most recent model proposed by Rydh et al.20 This model was validated using data on crystalline NaCl where reliable heat capacities are well established. Then, this model was successfully applied to determine the mass loss rates of [EMIm][NTf2] droplets at temperatures between 358 K and 373 K. New experimental data on vapor pressures for the test IL were consistent with those measured by the DFSC method in our previous study,12 as well as with the data available in the literature.1,7,10,15,16
The combination of new low temperature AC-calorimetric data with the previous high-temperature DFSC vapor pressure data has provided a unique data set for [EMIm][NTf2] in an extremely broad temperature range from 358 K to 780 K. An advantage of such a broad range is that by fitting the vapor pressure data with the Clarke–Glew-equation,12 the reliable thermodynamic parameters of vaporization (standard molar enthalpy of vaporization, standard molar free enthalpy of vaporization and the difference between the standard molar heat capacity of the liquid and standard molar heat capacity of the gas) can be derived. Moreover, due to the extremely broad temperature range, the estimation of the boiling temperature of [EMIm][NTf2] from the fit of the Clarke–Glew-equation can be considered as the first reliable boiling point of the archetypical ionic liquid obtained from the experimental vapor pressures measured in the most possible close proximity to the normal boiling temperature.
Experimental
Materials
The sample of 1-ethyl-3-methylimidazolium bis(trifluoromethylsulfonyl)imide ([EMIm][NTf2]) used for the calorimetric studies was of commercial origin (IOLITEC, Germany, purity 98%). The purity of the commercial sample was checked by NMR and IR spectroscopy. No impurities were detected in both the spectra. Prior to the measurement, it was exposed to ultra-high vacuum (<10−7 Pa) at 358 K for 120 minutes in order to remove possible traces of volatile impurities and water. The sample was additionally conditioned by repeating the full measurement cycle three times for one sample, see the Results and discussion section for details. No changes in the evaporation behavior were detected. The sample of NaCl, used for the validation of heat capacity determination, was purchased from Euro OTC Pharma GmbH, Germany, with a purity of 99.94%.AC chip-calorimetry and the experimental setup
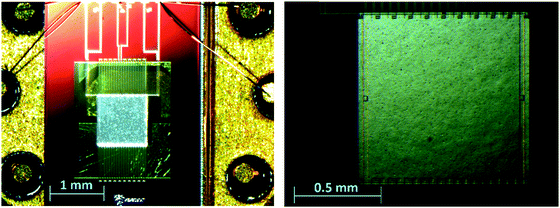
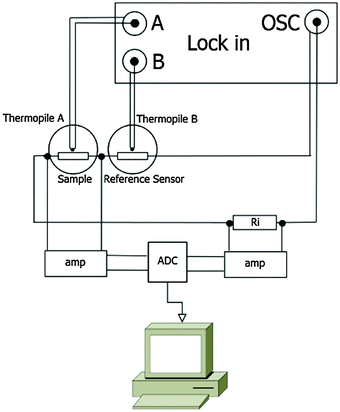
AC chip calorimetry has great potential in the mass loss rate determination of low-volatile compounds due to its high sensitivity and ability to perform isothermal measurements. A detailed description of the used AC-chip calorimeter can be found elsewhere.14,18 Our current setup is similar to that described by Huth et al.17,18 The sensors XI39347 used for the measurements in this work are chip-nanocalorimeters purchased from Xensor Integration B.V., NL. These sensors are based on a sub-micron thick SiNx-membrane with an active area of 1 × 1 mm2 (Fig. 1) mounted to a TO5 housing.21 An oscillating power coming from the oscillator output of a lock-in amplifier (Signal Recovery 7265) is applied to the heaters on the membrane of such a chip-calorimeter (Fig. 1) to heat the membrane. 20 thermocouples (hot junctions located around the edge of the active area of the membrane; cold junctions on the passive frame) are used to measure the response to the oscillating power. The thermopile voltage is given to the inputs of the lock-in amplifier which locks to the 2nd harmonic of the oscillator frequency and is set to measure the magnitude and the phase of the thermopile voltage.We use two chip-calorimeters either in a differential setup (Fig. 2) or each separately. Even the oscillator output voltage is given to both chip-calorimeters in series, the thermopile voltage can be measured in single and differential mode. The single mode measurement will be of importance if possible drifts of the signal have to be taken into account.
The chip-calorimeters are placed in a copper-block that can be heated and cooled in a temperature range from 90 K to 500 K. Thus the copper-block acts as the temperature bath for the calorimeters. The copper-block hangs in a CF 100 double-cross ultra-high vacuum (UHV) chamber that can be evacuated down to <10−7 Pa. More details about the setup can be found elsewhere.17,22
The droplet of a liquid sample is placed on the sensor with a 10 μm thin wire that is first dipped into the IL and then the sticking droplet is wiped off from the wire to the active area of the sensor. The resulting droplet forms a spherical cap on the membrane of the sensor. Solid samples are prepared accordingly. Adhesive or electrostatic forces allow us to pick up small pieces of the material with the copper wire and place it on the membrane.
As a rule, the geometry of the liquid droplet changes due to thermal expansion or evaporation, if heated to high temperatures. However, for the reliable vapor pressure determination the liquid–vacuum interfacial area has to be ideally constant (see eqn (1) below). Therefore, the sensors are locally coated with silica hydroxyapatite nanoparticles (provided by Th. Gerber, University of Rostock)23 to pin the droplet on the membrane at the location of the coated area.12 Thus, the edge of an evaporating droplet remains pinned until the droplet becomes so thin that it breaks into smaller droplets.12
Heat capacity determination
The IL-samples are evaporated from the chip in an ultra-high vacuum and thus the Lagmuir-equation for vaporization from the open surface holds: | (1) |
Heat capacity Cp(t,T) of the IL-sample is monitored during the vaporization process. If Cp(t,T) = m(t)Cp(T) holds, eqn (1) can be written as
 | (2) |
AC chip-calorimetry measures the thermopile voltage, which is (in the differential setup) proportional to the heat capacity of the sample. Huth et al.18 developed a sophisticated method to calculate the heat capacity from the thermopile voltage. However, several specific parameters required for this method are not easy to determine. Rydh et al.20 suggested a more convenient way. Based on the preceding works of Sullivan and Seidel,24 Greene et al.,25 Riou et al.26 and Velichkov et al.27 they developed an analytical description of the frequency dependence of the measured temperature amplitude, TAC,ω, on heat capacities and thermal conductance of the system that consists of a sensor, a sample and a bath:
 | (3) |
The phase of the response to the temperature modulation is given by
 | (4) |
 | (5) |
 accounts for the finite time-constant τm of the membrane-to-bath heat transfer and the frequency ω of the applied power.
The effective thermal conductance of the membrane Ke,eff is calculated using
 | (6) |
 | (7) |
The parameters τi and τm can be expressed by  and
and  . Thus, in the current model five fitting parameters, Ke, Ki, Cm, C0, Cs, are needed to fit the measured data in terms of temperature amplitude to the analytical expression. The temperature amplitude is obtained from the measured thermopile amplitude applying the calibration function of the thermopiles.28
Determination of the interfacial area
The area of the liquid–vacuum interface ALV of the sample required for calculation of the IL vapor pressure according to eqn (2) is usually derived from the lateral dimensions of a sample on the chip-calorimeters measured with the help of an optical microscope. Unfortunately, in this study due to the geometry of the TO5-housing of the current sensor type the height of such a pinned droplet-shaped sample is not accessible, like it is possible for sensors on a ceramics housing.12 However, knowledge of the heat capacity of the sample and the lateral dimensions allows us to calculate the height h from | (8) |
 is the volume of a spherical cap, like for a supported liquid sample. In eqn (8) we neglected the marginal temperature dependent expansion of the volume of the sample. ρ is the density and a is the radius of the contact area between the sample and the support, which is circular in the ideal case. However, commonly the contact area is arbitrary shaped and an optical microscope has to be used for the determination of the lateral dimension of the sample. A local coating on the membrane forces the liquid droplet to attain always the same lateral shape. Thus, the contact area has to be determined for a certain sensor only once. For an ideal spherical cap the liquid–vacuum interfacial area ALV is calculated using
| ALV = π(2a2 + h2) | (9) |
Validation of the model
Small NaCl-crystals with known absolute heat capacities provide a good way to test the applicability of the model of Rydh et al.20 to our measuring system. The dimensions of these crystals can easily be determined with an optical microscope (Olympus BX41) due to their regular cubic lattice structure, which persists even for bulk samples. However, since the active area of the chip-calorimeters is 1 × 1 mm2, the crystals have to be essentially small. Moreover, the heat capacity of the NaCl-crystals should keep the order of that of the ionic liquid droplets to maintain comparability. Liquid droplets have a very good thermal contact to the membrane, while NaCl-crystals have not. To solve this problem we use a small amount of Apiezon-N grease to attach the crystals to the membrane for better thermal contact. It has been shown that the additional contribution to heat capacity coming from the grease is negligibly small compared to the heat capacity of the crystals.From the dimensions of the crystals, and thus their volumes, the well-known density and specific heat capacity at a certain temperature T, their heat capacities can be determined. Thus, again for the reason of comparability, the NaCl-measurements are done at a temperature of T = 323 K.
A NaCl-crystal-loaded and an empty chip-calorimeter are introduced to the UHV-chamber, which is evacuated down to <10−7 Pa. The copper-block is heated to 323 K and the thermopile voltage for the sample and reference sensor is measured in single mode as a function of the frequency of the applied power. For the details of the experimental setup we refer to Ahrenberg et al.17 The thermal frequency is scanned from 0.02 Hz up to 600 Hz.
Fig. 3 shows the measured and fitted values for two NaCl-crystals of different dimensions as well as for the empty chip measurement in a log–log-plot of temperature amplitude over thermal frequency. It has turned out that the Rydh et al.20 model is able to describe the measured data in a wide frequency range. However, for relatively high frequencies the model starts to fail and the thermal frequency range shown in Fig. 3 has been limited to 200 Hz. The heat capacities of the crystals derived from the model are (39 ± 1) μJ K−1 and (10 ± 1) μJ K−1, for the black and the red data in Fig. 3, respectively, which are close to the values determined using an optical microscope ((41 ± 1) μJ K−1 and (9 ± 1) μJ K−1, respectively). Such a good agreement of the results with those from the optical method has proven the applicability of the model to the chip sensors for heat capacity determination.
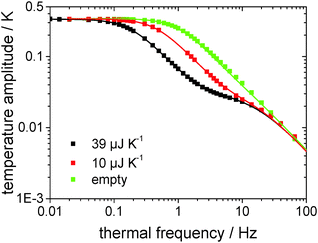 | ||
| Fig. 3 Temperature amplitude over thermal frequency from measurements of two different NaCl-crystal-samples and the empty sensor (squares) as well as the corresponding functions determined by the analytical description (eqn (3), lines). | ||
Heat capacity of the [EMIm][NTf2]-droplet
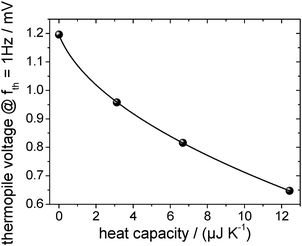
The absolute heat capacity of the [EMIm][NTf2]-droplet has to be known for mass-loss rate measurements (see eqn (1)) at each time and each temperature. Thus the measured thermopile voltage at a certain frequency has to be related to the absolute heat capacity of the IL-droplet. Since the relation is non-linear,17 several measurements of the frequency-dependent thermopile voltage of IL-droplets with distinct masses have to be carried out. Each measurement is fitted using the above described and validated model (according to eqn (3)) to derive the heat capacities of the IL-droplet. Fig. 4 shows the measured and fitted frequency-dependent values of the temperature amplitude and the phase for four droplets of different sample masses on the sensor as well as for the empty sensor. As can be seen, the model is able to describe the measured data and Fig. 5 (fit + data) gives the relation between heat capacity and measured thermopile magnitude for a certain frequency of temperature modulation (see next paragraph). The derived functional relation can be used to calculate the heat capacity of the IL-droplet during the evaporation process from the single mode thermopile magnitude at each time.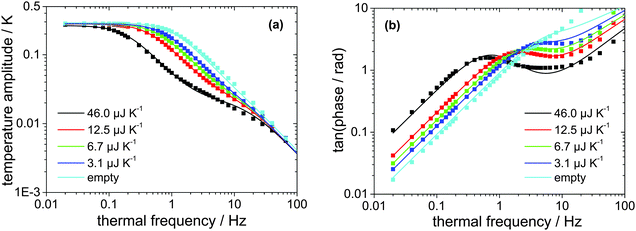 | ||
| Fig. 4 (a) Measured (squares) and fitted (lines, using eqn (3)) temperature amplitude over thermal frequency of four different samples of [EMIm][NTf2] with distinct masses as well as for the empty sensor. (b) Corresponding measured (squares) and fitted (lines, using eqn (4)) phase over thermal frequency. | ||
The frequency of temperature modulation plays an important role in heat capacity determination. In Fig. 4b the linear behavior of the phase at low frequency corresponds to a thermally well-connected sample whereas the behavior at high frequency corresponds to a thermally insufficiently coupled sample. However, the frequency-dependent behavior shifts, e.g. with decreasing sample mass towards higher frequencies. In other words, a smaller sample becomes thermally decoupled at a higher frequency as compared to a larger sample, as expected. Since the mass of the sample decreases during the evaporation experiments, a shift of the thermal decoupling is also expected. We use a thermal frequency of 1 Hz for the evaporation experiments, where thermal decoupling sets in for intermediate samples sizes (Cpca. 12 μJ K−1) to ensure that 100% of the mass of smaller samples is contributing to the measured thermopile magnitude. This argument provides the reason why to exclude the largest droplet measured, as shown in Fig. 4, from the fit as shown in Fig. 5.
Results and discussion
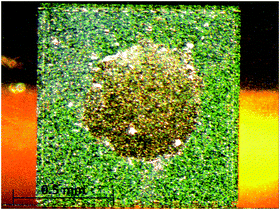
An [EMIm][NTf2]-droplet on the chip-calorimeter in an UHV was studied at different temperatures between 358 K and 373 K. The lowest limit of the working temperatures was at about 358 K where the mass-loss is measurable on a timescale of few hours.Fig. 6 shows the initial droplet on the chip-calorimeter. The lateral dimensions are determined for different cross sections and averaged subsequently. This yields a base radius of the liquid-membrane interface of a = (318 ± 20) μm.
The thermopile voltage is measured in differential mode which has the advantage of higher sensitivity compared to the single mode measurement of the sample sensor. The additional single mode measurements of the reference sensor, which is empty, have the advantage to account for possible drifts in the signal caused by the electronics.
The measurement proceeds as follows: first the copper block, including the chip-calorimeters, is heated to a certain temperature (e.g. 358 K). According to preliminary measurements at this temperature the [EMIm][NTf2]-sample of several hundred nanograms starts to evaporate with a sufficient rate. If the temperature has stabilized at 358 K, an isothermal measurement is started and the software for the data acquisition switches among the differential measurement and the empty sensor single measurement according to a predefined time interval, whose length is generally stipulated by the mass-loss rate at the selected temperature of evaporation.
For example, the measurement at 358 K is performed within approx. five hours in order to obtain a reasonable mass-loss for rate determination. After completing the measurement at 358 K, the isothermal studies are continued in 5 K steps up to 373 K. As a rule, the measurement time at 373 K has not exceeded approx. 3.5 hours, which is still long enough and potentially the AC chip-calorimeter is able to be applied for measurements at higher temperatures than 373 K. Unfortunately, the current construction of the measuring cell consists of a large-sized temperature bath containing the chips. The maximum heating rate of 1 K min−1 and a stabilization time of about 30 minutes yield already a significant mass-loss during the temperature ramping and stabilization. In this respect, for studies at higher temperatures the device requires modifications.
The mass-loss measurements are repeated twice using one and the same sample, yielding a set of three mass-loss values per evaporation temperature. During the course of the whole measurement the thermopile magnitude of the sample decreased to about 33% of the initial value.
Fig. 7 shows the thermopile magnitude of the empty sensor single measurements over time, which is used to detect and correct the possible signal drift. It can clearly be seen that the thermopile magnitude drifts by about 1 μV within 1.5 days. The thermopile magnitudes of sample-loaded single measurements are corrected accordingly. The change in the thermopile magnitude with temperature is due to the temperature-dependent heat capacity of the system (sample + sensor) itself. Surprisingly, the phase data do not drift at all within the resolution limit of ±0.01° during the course of an evaporation experiment. This extremely high stability is due to the employed lock-in technique. An oscillating power at fixed frequency is applied to the sensor and the thermopile signal is detected exclusively at the second harmonic of this frequency. In this way contributions from low and high frequency noise, drifts and electrical noise, respectively, are minimized.
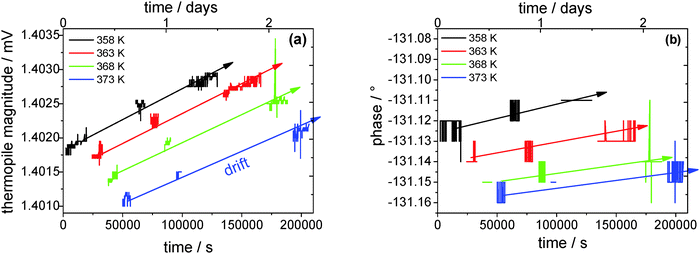 | ||
| Fig. 7 (a) Thermopile magnitude and (b) phase over time of the empty reference sensor. The lines are guides to the eye. | ||
One remaining possibility for a drifting thermopile magnitude is a changing heater resistance. The doped silicon stripes on the membrane used for heating are not long-time stable at elevated temperatures. This was detected in earlier work.29 The applied oscillator voltage is dropping over the two heaters of the sensors and a very stable pre-resistor in series (see Fig. 2). If the heater resistances increase a larger fraction of the oscillator voltage drops across the sensors and the thermopile voltage increases. As a consequence, the heater resistance cannot be used as a reference for temperature determination directly on the membrane, like it was used in earlier works at low temperatures.22
We use the readout of the PT100 attached to the copper block (temperature bath) for temperature determination. Since the measurements are performed in a vacuum a possible temperature gradient across the copper block is not expected for isothermal measurements.
The drift-corrected thermopile magnitude is used for heat capacity calculation using the derived fit function as determined from the data in Fig. 5. Fig. 8 shows the heat capacity change over time for a first sample run from 358 K to 373 K in 5 K-steps. From the heat capacity at the start of the measurement the height h of the droplet is been determined to be hstart = 4.94 μm using eqn (8), which is very shallow compared to the lateral dimension of the droplet of base radius a = (318 ± 20) μm. At the end of the measurement the height has decreased to hend = 1.17 μm. The liquid–vacuum interfacial area ALV = π·(a2 + h2) for the pinned droplet has changed during the course of the measurement from ALV,start = 3.1776 × 10⁻⁷ m2 to ALV,end = 3.1769 × 10⁻⁷ m2, which corresponds to a change of 0.2% and is negligible. Generally, for droplets, which are very shallow, the change of the interfacial area during evaporation can be practically neglected in the series of subsequent experiments.
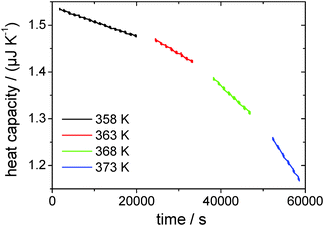 | ||
| Fig. 8 Heat capacity over time for the first four isothermal measurements, representing a complete series of temperatures. | ||
From linear fits to the decreasing heat capacity (see Fig. 8), the rate of heat capacity loss and consequently the vapor pressure according to eqn (2) can be determined (see Fig. 9). As can be seen, the vapor pressure of [EMIm][NTf2] at e.g. 358 K is about 1.3 × 10⁻⁶ Pa. Measurements of such low vapor pressures by e.g. common TGA take several days, provided that the instrument is stable over such a long time. In contrast, with the AC chip-calorimetry we are able to determine the vapor pressure at 358 K within a few hours. Other conventional methods (except for QCM) totally fail to measure such extremely low vapor pressures. The measureable vapor pressure of [EMIm][NTf2] at 358 K already came close to the pressure in the vacuum chamber and one would expect the liquid to start to boil. However, this does not seem to be the case because the bubble forming would be clearly recognized by turbulent distortions of the measured signal. The phenomenon of superheating prevents boiling from taking place as the sample is in a vacuum chamber free of nucleation sites.
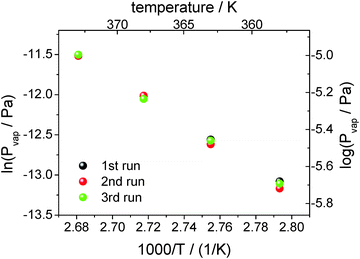 | ||
| Fig. 9 Logarithm of the vapor pressure of [EMIm][NTf2] against reciprocal temperature. The vapor pressure is determined from three measurements at each temperature. | ||
The scatter in the vapor pressure data shown in Fig. 9 cannot be significantly reduced by statistics. Each point is determined from a dataset containing about 10![[thin space (1/6-em)]](https://www.rsc.org/images/entities/char_2009.gif) 000 tuples of time, thermopile magnitude and phase. The relative standard error is about 1‰ for each point. More data, i.e. longer measurements, would not improve the error. Error-contributions from different origins may be responsible for the observed data scatter, e.g. uncertainty of the temperature determination with the PT100 or more possibly the uncertainty of heat capacity determination from the fit function (see Fig. 5). However, it has to be mentioned that vapor pressures scatter within 1–3% measured even by conventional techniques that are considered to be acceptable.
000 tuples of time, thermopile magnitude and phase. The relative standard error is about 1‰ for each point. More data, i.e. longer measurements, would not improve the error. Error-contributions from different origins may be responsible for the observed data scatter, e.g. uncertainty of the temperature determination with the PT100 or more possibly the uncertainty of heat capacity determination from the fit function (see Fig. 5). However, it has to be mentioned that vapor pressures scatter within 1–3% measured even by conventional techniques that are considered to be acceptable.
From the vapor pressures in Fig. 9 the vaporization enthalpy ΔglH0m at the average temperature of the mass-loss determinations was calculated by
 | (10) |
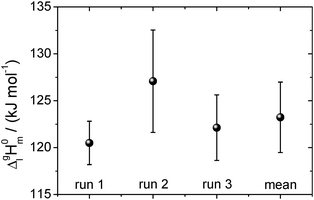 | ||
| Fig. 10 The vaporization enthalpy of [EMIm][NTf2] for each of the three full temperature cycles and their mean value. The error is determined from the standard deviation of the data in Fig. 9. The experimental ΔglH0m (T)-values referred to the mean temperature of vaporization Tavg = 365.5 K were adjusted to the reference temperature 298 K using the heat capacity difference ΔglC0p,m = −56 J K−1 mol−1.30 | ||
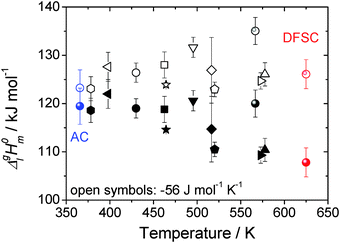 | ||
| Fig. 11 Collection of vaporization enthalpies for [EMIm][NTf2] derived from various methods at different average temperatures (bulk symbols).1,3,9–12,16,31–35 The open symbols represent the data adjusted to the reference temperature of 298 K using ΔglC0p,m = −56 J K−1 mol−1 as suggested by Verevkin et al.30 The data determined by the AC calorimetry and the DFSC are emphasized in color. | ||
As it has been discussed earlier,30 the level of the heat capacity difference ΔglC0p,m required for the temperature adjustments of vaporization enthalpies is a subject of controversy. However, within the current work we have the unique possibility to derive the ΔglC0p,m-value directly from the experimental data measured in a broad temperature range. Indeed, the combination of the earlier published DFSC data (measured in the range 400 to 780 K),36 with the current results from the AC chip-calorimeter measured between 358 K and 373 K), provides vapor pressures in the extremely broad temperature range 358–780 K. Admittedly, from such a data set the ΔglC0p,m-value for [EMIm][NTf2] can be derived by fitting experimental vapor pressures to the Clarke–Glew-equation:37
 | (11) |
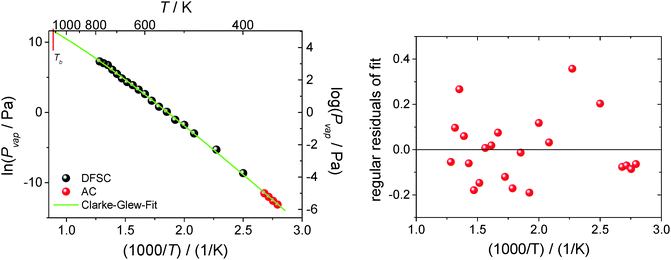
![[thin space (1/6-em)]](https://www.rsc.org/images/entities/char_2009.gif) 300 Pa is the standard pressure. In contrast to the commonly used Clausius–Clapeyron-equation (restricted to the short temperature range), the Clarke–Glew equation is able to take into account the curvature of the vapor–pressure temperature dependence properly due to fitting to the three adjustable parameters ΔglH0m(θ), ΔglC0p,m(θ), and ΔglG0m(θ). Fig. 12 shows the vapor pressure data and the corresponding Clarke–Glew-fit that yields the values ΔglH0m(298 K) = (124 ± 2) kJ mol−1, ΔglC0p,m(298 K) = −(53 ± 10) J mol−1 K−1 and ΔglG0m(298 K) = (81 ± 1) kJ mol−1. The value of the ΔglC0p,m(298 K) = −(53 ± 10) J mol−1 K−1 derived from the Clarke–Glew-fit is slightly smaller than those recommended in our work ΔglC0p,m(298 K) = −(56 ± 10) J mol−1 K−1,30 but the agreement is very good within the experimental uncertainties. Also vaporization enthalpy ΔglH0m(298 K) = (124 ± 2) kJ mol−1, determined from the Clarke–Glew equation is similar to those reported from the earlier fitting to the DFSC-data and other literature data.38 Taking into account the strong interaction energy between the cation and the anion, i.e. about 300 kJ mol−1 in common IL, this value supports the view that thermally stable aprotic ILs exist exclusively as ion pairs in the gaseous phase within a broad range of temperatures.35 However, the new vaporization enthalpy ΔglH0m(298 K) = (124 ± 2) kJ mol−1 and the heat capacity difference ΔglC0p,m(298 K) = −(53 ± 10) J mol−1 K−1 derived in this work can be now considered as the benchmark values for [EMIm][NTf2], useful for testing other experimental methods.
300 Pa is the standard pressure. In contrast to the commonly used Clausius–Clapeyron-equation (restricted to the short temperature range), the Clarke–Glew equation is able to take into account the curvature of the vapor–pressure temperature dependence properly due to fitting to the three adjustable parameters ΔglH0m(θ), ΔglC0p,m(θ), and ΔglG0m(θ). Fig. 12 shows the vapor pressure data and the corresponding Clarke–Glew-fit that yields the values ΔglH0m(298 K) = (124 ± 2) kJ mol−1, ΔglC0p,m(298 K) = −(53 ± 10) J mol−1 K−1 and ΔglG0m(298 K) = (81 ± 1) kJ mol−1. The value of the ΔglC0p,m(298 K) = −(53 ± 10) J mol−1 K−1 derived from the Clarke–Glew-fit is slightly smaller than those recommended in our work ΔglC0p,m(298 K) = −(56 ± 10) J mol−1 K−1,30 but the agreement is very good within the experimental uncertainties. Also vaporization enthalpy ΔglH0m(298 K) = (124 ± 2) kJ mol−1, determined from the Clarke–Glew equation is similar to those reported from the earlier fitting to the DFSC-data and other literature data.38 Taking into account the strong interaction energy between the cation and the anion, i.e. about 300 kJ mol−1 in common IL, this value supports the view that thermally stable aprotic ILs exist exclusively as ion pairs in the gaseous phase within a broad range of temperatures.35 However, the new vaporization enthalpy ΔglH0m(298 K) = (124 ± 2) kJ mol−1 and the heat capacity difference ΔglC0p,m(298 K) = −(53 ± 10) J mol−1 K−1 derived in this work can be now considered as the benchmark values for [EMIm][NTf2], useful for testing other experimental methods.
Taking into account the extremely large temperature range of experiments performed with the DFSC and AC methods as well as that the Clarke–Glew-equation accounts for the curvature of the ln(Pvap) − 1/T dependence, it becomes possible to estimate the normal boiling point of [EMIm][NTf2] in a more reliable way in comparison to other techniques. As can be seen from Fig. 12 the vapor pressure determined by AC calorimetry and DFSC cover a range spanning nine orders of magnitude in pressure and a temperature range of more than 400 K. Since the highest vapor pressure measured by DFSC is about 1000 Pa the extrapolation towards the boiling point is comparably small (two orders of magnitude). Such extrapolation provides the boiling temperature of [EMIm][NTf2] as Tb = (1120 ± 50) K. To our surprise, this value is twice higher than those previously assessed in the literature from surface tension measurements by Rebelo et al.4 However, more surprisingly is that the Tb of [EMIm][NTf2] derived in this work is virtually identical to the critical temperature Tc = (1155 ± 55) K of this IL calculated as the average from empirical Eötvos and Guggenheim equations applied by Rebelo et al.4 Discussion of the reason for this discrepancy is outside the scope of this study. Nevertheless, our new estimate for the normal boiling point is more close to Tb = 977 K calculated by Monte Carlo simulations39 but Tc = 1236 K calculated for [EMIm][NTf2] reported in the same work seems to be too low. Indeed, the vaporization enthalpy of [EMIm][NTf2] measured with DFSC ΔglH0m(780 K) = 100 kJ mol−1 is apparently different from vaporization enthalpy at Tc which has to be zero. Thus, our new estimate for the normal boiling point of [EMIm][NTf2] could be used for parametrization and testing of the force-fields used in molecular-dynamic simulation.
Our new value for Tb of the archetypical IL has also crucial practical aspects. In recent works, Beck et al.40 and Neise et al.41 studied some ILs as quenching media in heat-treatment processes of metals. The boiling point of the quenching medium must be avoided because of the unfavorable Leidenfrost phenomenon.40–43 Because of our reliable estimation of the boiling point for [EMIm][NTf2], which exceeds twice the commonly acknowledged range of Tb for typical ILs, the search for high temperature applications for common ILs can be extended significantly.
Conclusion
AC chip-calorimetry provides a new and very sensitive method for the mass loss rate measurements of extremely low-volatile compounds at low temperatures under UHV-conditions. Reliable vapor pressures of 10−6 Pa and lower can be determined by using sub-microgram samples within relatively short experimental timescales. This is possible due to the small sample size. The ratio of the liquid–vacuum interfacial area to the volume of the sample is increased compared to conventional techniques, e.g. TGA, by a factor of 103, yielding large relative mass changes in short time. Compared to other highly sensitive techniques, like QCM, the AC calorimeter is less sensitive to perturbations and drifts. This is due to the employed lock-in technique which senses the signal only at the second harmonic of the predefined and very stable oscillator frequency. Thus, this technique is predestined for vapor pressure measurements of ILs at relatively low temperatures. Using AC calorimetry we succeeded in measuring the vapor pressure of [EMIm][NTf2] at temperatures starting from 358 K. Potentially, this technique can be applied to measure the vapor pressure of thermally very unstable ILs, which tend to decompose at comparably low temperatures and thus are not suitable for vapor pressure determination by conventional techniques. This work is now in progress. For thermally stable ILs, the combination of AC chip-calorimetry with the DFSC method allows us to extend the experimental temperature range as far as it was not possible before by conventional methods. This combination of the methods opens up a new way for deriving the thermodynamic parameters of vaporization ΔglH0m, ΔglC0p,m and ΔglG0m required for practical application of ILs as thermofluids and reaction media.Acknowledgements
This work is supported by the DFG project: “Ionic Liquids as quenching media for the heat treatment of metallic materials” SCH 331/24-2.Notes and references
- D. H. Zaitsau, G. J. Kabo, A. A. Strechan, Y. U. Paulechka, A. Tschersich, S. P. Verevkin and A. Heintz, J. Phys. Chem. A, 2006, 110, 7303–7306 CrossRef CAS PubMed.
- Y. U. Paulechka, D. H. Zaitsau, G. J. Kabo and A. A. Strechan, Thermochim. Acta, 2005, 439, 158–160 CrossRef CAS.
- J. P. Armstrong, C. Hurst, R. G. Jones, P. Licence, K. R. J. Lovelock, C. J. Satterley and I. J. Villar-Garcia, Phys. Chem. Chem. Phys., 2007, 9, 982–990 RSC.
- L. P. N. Rebelo, J. N. C. Lopes, J. Esperanca and E. Filipe, J. Phys. Chem. B, 2005, 109, 6040–6043 CrossRef CAS PubMed.
- M. J. Earle, J. Esperanca, M. A. Gilea, J. N. C. Lopes, L. P. N. Rebelo, J. W. Magee, K. R. Seddon and J. A. Widegren, Nature, 2006, 439, 831–834 CrossRef CAS PubMed.
- J. A. Widegren, Y. M. Wang, W. A. Henderson and J. W. Magee, J. Phys. Chem. B, 2007, 111, 8959–8964 CrossRef CAS PubMed.
- Y. Chen, Y. Y. Cao, Y. Shi, Z. M. Xue and T. C. Mu, Ind. Eng. Chem. Res., 2012, 51, 7418–7427 CrossRef CAS.
- F. Heym, B. J. M. Etzold, C. Kern and A. Jess, Phys. Chem. Chem. Phys., 2010, 12, 12089–12100 RSC.
- S. P. Verevkin, R. V. Ralys, D. H. Zaitsau, V. N. Emel'yanenko and C. Schick, Thermochim. Acta, 2012, 538, 55–62 CrossRef CAS.
- M. A. A. Rocha, C. Lima, L. R. Gomes, B. Schroder, J. A. P. Coutinho, I. M. Marrucho, J. Esperanca, L. P. N. Rebelo, K. Shimizu, J. N. C. Lopes and L. Santos, J. Phys. Chem. B, 2011, 115, 10919–10926 CrossRef CAS PubMed.
- S. P. Verevkin, D. H. Zaitsau, V. N. Emelyanenko and A. Heintz, J. Phys. Chem. B, 2011, 115, 12889–12895 CrossRef CAS PubMed.
- M. Ahrenberg, M. Brinckmann, J. W. P. Schmelzer, M. Beck, C. Schmidt, O. Kessler, U. Kragl, S. P. Verevkin and C. Schick, Phys. Chem. Chem. Phys., 2014, 16, 2971–2980 RSC.
- E. Zhuravlev and C. Schick, Thermochim. Acta, 2010, 505, 1–13 CrossRef CAS.
- H. Huth, A. Minakov and C. Schick, Netsu Sokutei, 2005, 32, 70–76 CAS.
- F. Heym, B. J. M. Etzold, C. Kern and A. Jess, Green Chem., 2011, 13, 1453–1466 RSC.
- K. R. J. Lovelock, A. Deyko, P. Licence and R. G. Jones, Phys. Chem. Chem. Phys., 2010, 12, 8893–8901 RSC.
- M. Ahrenberg, E. Shoifet, K. R. Whitaker, H. Huth, M. D. Ediger and C. Schick, Rev. Sci. Instrum., 2012, 83, 033902 CrossRef CAS PubMed.
- H. Huth, A. A. Minakov and C. Schick, J. Polym. Sci., Part B: Polym. Phys., 2006, 44, 2996–3005 CrossRef CAS.
- H. Huth, A. A. Minakov, A. Serghei, F. Kremer and C. Schick, Eur. Phys. J.: Spec. Top., 2007, 141, 153–160 CrossRef.
- S. Tagliati and A. Rydh, Thermochim. Acta, 2011, 522, 66–71 CrossRef CAS.
- A. W. van Herwaarden, Thermochim. Acta, 2005, 432, 192–201 CrossRef CAS.
- M. Ahrenberg, Y. Z. Chua, K. R. Whitaker, H. Huth, M. D. Ediger and C. Schick, J. Chem. Phys., 2013, 138, 024501 CrossRef CAS PubMed.
- M. Adam, C. Ganz, W. G. Xu, H. R. Sarajian, W. Gotz and T. Gerber, Int. J. Nanomed., 2014, 9, 975–984 CrossRef CAS PubMed.
- P. Sullivan and G. Seidel, Ann. Acad. Sci. Fenn., Ser. A6, 1966, A, 58–62 Search PubMed.
- R. L. Greene, C. N. King, R. B. Zubeck and J. J. Hauser, Phys. Rev. B: Solid State, 1972, 6, 3297–3305 CrossRef CAS.
- O. Riou, J. F. Durastanti and Y. Sfaxi, Superlattices Microstruct., 2004, 35, 353–361 CrossRef CAS.
- I. V. Velichkov, Cryogenics, 1992, 32, 285–290 CrossRef.
- E. Zhuravlev and C. Schick, Thermochim. Acta, 2010, 505, 14–21 CrossRef CAS.
- M. Ahrenberg, PhD thesis, Universität Rostock, 2013.
- S. P. Verevkin, D. H. Zaitsau, V. N. Emel'yanenko, A. V. Yermalayeu, C. Schick, H. J. Liu, E. J. Maginn, S. Bulut, I. Krossing and R. Kalb, J. Phys. Chem. B, 2013, 117, 6473–6486 CrossRef CAS PubMed.
- A. B. Tolstoguzov, Mass Spectrom., 2007, 4, 283–288 CAS.
- L. Santos, J. N. C. Lopes, J. A. P. Coutinho, J. Esperanca, L. R. Gomes, I. M. Marrucho and L. P. N. Rebelo, J. Am. Chem. Soc., 2007, 129, 284–285 CrossRef CAS PubMed.
- H. M. Luo, G. A. Baker and S. Dai, J. Phys. Chem. B, 2008, 112, 10077–10081 CrossRef CAS PubMed.
- C. M. Wang, H. M. Luo, H. R. Li and S. Dai, Phys. Chem. Chem. Phys., 2010, 12, 7246–7250 RSC.
- V. N. Emel'yanenko, S. P. Verevkin and A. Heintz, J. Am. Chem. Soc., 2007, 129, 3930–3937 CrossRef PubMed.
- M. Ahrenberg, M. Beck, C. Schmidt, O. Keßler, U. Kragl, S. Verevkin and C. Schick, in Fast Scanning Calorimetry, ed. C. Schick and V. Mathot, Springer, 2016, DOI:10.1007/978-3-319-31329-0.
- E. C. W. Clarke and D. N. Glew, Trans. Faraday Soc., 1966, 62, 539–547 RSC.
- M. Ahrenberg, M. Brinckmann, J. W. P. Schmelzer, M. Beck, C. Schmidt, O. H. Keßler, U. Kragl, S. P. Verevkin and C. Schick, Phys. Chem. Chem. Phys., 2014, 16, 2971–2980 RSC.
- N. Rai and E. J. Maginn, Faraday Discuss., 2012, 154, 53–69 RSC.
- M. Beck, C. Schmidt, M. Ahrenberg, C. Schick, U. Kragl and O. Kessler, HTM, J. Heat Treat. Mater., 2015, 70, 73–80 CrossRef.
- C. Neise, C. Rautenberg, U. Bentrup, M. Beck, M. Ahrenberg, C. Schick, O. Keßler and U. Kragl, RSC Adv., 2016, 6, 48462–48468 RSC.
- C. Schmidt, M. Beck, M. Ahrenberg, C. Schick, O. Keßler and U. Kragl, RSC Adv., 2014, 4, 55077–55081 RSC.
- M. Beck, C. Schmidt, M. Ahrenberg, C. Schick, U. Kragl and O. Keßler, HTM, J. Heat Treat. Mater., 2013, 68, 214–223 CrossRef CAS.
| This journal is © the Owner Societies 2016 |

