Extreme high temperature redox kinetics in ceria: exploration of the transition from gas-phase to material-kinetic limitations†
Received
23rd March 2016
, Accepted 7th July 2016
First published on 18th July 2016
Abstract
The redox kinetics of undoped ceria (CeO2−δ) are investigated by the electrical conductivity relaxation method in the oxygen partial pressure range of −4.3 ≤ log(pO2/atm) ≤ −2.0 at 1400 °C. It is demonstrated that extremely large gas flow rates, relative to the mass of the oxide, are required in order to overcome gas phase limitations and access the material kinetic properties. Using these high flow rate conditions, the surface reaction rate constant kchem is found to obey the correlation log(kchem/cm s−1) = (0.84 ± 0.02) × log(pO2/atm) − (0.99 ± 0.05) and increases with oxygen partial pressure. This increase contrasts the known behavior of the dominant defect species, oxygen vacancies and free electrons, which decrease in concentration with increasing oxygen partial pressure. For the sample geometries employed, diffusion was too fast to be detected. At low gas flow rates, the relaxation process becomes limited by the capacity of the sweep gas to supply/remove oxygen to/from the oxide. An analytical expression is derived for the relaxation in the gas-phase limited regime, and the result reveals an exponential decay profile, identical in form to that known for a surface reaction limited process. Thus, measurements under varied gas flow rates are required to differentiate between surface reaction limited and gas flow limited behavior.
1. Introduction
The high redox activity of ceria renders this material an attractive reaction medium for solar-driven thermochemical fuel production. The solar thermochemical process aims at storing solar energy in the form of chemical fuels by taking advantage of changes in oxidation state in a reactive oxide that occur in response to a change in temperature and/or gas-phase oxygen partial pressure. Specifically, under inert atmospheres and at high temperatures, the latter ideally achieved using solar concentration, the reactive oxide releases oxygen as dictated by thermodynamic considerations. Subsequent exposure to steam and/or carbon dioxide, typically at lower temperature, restores the oxidized state of the solid, releasing hydrogen and/or carbon monoxide.1–9 As a means of generating solar fuels, the thermochemical approach is particularly appealing because the entire solar spectrum is inherently utilized and precious metal catalysts are not required. Ceria and its derivatives are leading candidates for this process because of their favorable thermodynamic and kinetic properties.1–3,5–8
The present study is focused in particular on the kinetics of oxygen uptake/release by ceria, in particular at temperatures relevant to thermochemical fuel production. While the thermodynamic properties of ceria at temperatures as high as 1500 °C and over a wide partial pressure range are known to a high degree of confidence,10–13 the same is not true of the kinetic properties. Indeed, only two papers could be found in the literature that attempt to measure diffusivity at temperatures above 1200 °C.14,15 In principle, diffusivity can be computed16 from conductivity and defect concentrations, which are known at high temperature for ceria,10,11 but the calculation relies on assumptions that may not be entirely valid. Even more striking than the absence of transport measurements is the dearth of studies of surface reaction rates of ceria at temperatures at these high temperatures, with again only two papers on the topic.14,17 Yet, for typical material structures designed for effective thermochemical cycling (porous monoliths with relatively short bulk, solid-state diffusion paths), the surface reaction step presents a greater rate limitation than bulk diffusion.2,17
In parallel with inherent material kinetic limitations to oxygen uptake and release, material thermodynamic factors can play a role. Indeed, it has recently been demonstrated that at extreme temperatures and low gas flow rates, relative to the mass of reactive oxide, gas evolution is limited by the thermodynamic capacity of the gas to change the material oxidation state.18 That is, the material kinetic parameters can be so fast as to become irrelevant. In this gas-phase limited regime, the overall rate of oxidation state change of the material is proportional to the rate of gas flow, and the composition of the gas supplied to the material is different from that emerging after reaction with the material. One can readily anticipate that as the gas flow rate is increased, material kinetic factors will take over as the dominant rate limiting process, and moreover, that the transition between the gas-phase limited and the material-kinetics limited regimes will depend on both thermodynamic and kinetic properties of the reactive oxide. Thus, knowledge of the kinetic properties (as a complement to the well-known thermodynamic properties) is essential for understanding thermochemical fuel production rates. The current work addresses this need via a combination of kinetic and thermodynamic analyses of undoped ceria at 1400 °C, a temperature relevant for solar-driven thermochemical fuel production.
2. Theory
A particularly convenient and well-established technique for measuring material kinetic properties – surface reaction rate, kchem, and bulk chemical diffusivity, Dchem – is the (isothermal) electrical conductivity relaxation (ECR) method.19–24 Here, a small perturbation in gas phase oxygen chemical potential (oxygen partial pressure) causes a material to undergo a small change in oxidation state, which in turn, typically results in a change in conductivity. Under appropriate experimental conditions, the flux across the surface of the oxide is| | | JO = kchem(cO,eq − cO,S) = −Dchem(∇cO)S | (1) |
where cO,eq is the oxygen concentration of the oxide at equilibrium with the gas phase, and cO,S is the oxygen concentration just within the oxide surface(s).25 The associated change in conductivity, σ, with time, t, for a thin, planar sample (in which oxygen incorporation/excorporation occurs only along one dimension) is given by:25–28| | 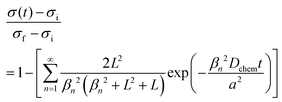 | (2) |
where σi and σf are the initial and final conductivity values, respectively, and the sample thickness is 2a (with exchange occurring on both surfaces of the thin sample). The {βn} are the positive roots of| |  | (3) |
and ![[L with combining tilde]](https://www.rsc.org/images/entities/i_char_004c_0303.gif) is a dimensionless length reflecting the relative importance of diffusion and surface reactivity to the overall relaxation rate. The experimental requirements for the validity of this expression include: (1) use of a sufficiently small perturbation such that (i) kchem and Dchem can be treated as constants, that (ii) these properties respond linearly to the perturbation magnitude,29 that (iii) conductivity varies linearly with oxygen content, and (iv) that the material does not change temperature due to heat release during oxidation or heat adsorption during reduction; (2) use of a sufficiently small reactor volume such that the reactor flush time is much shorter than the material relaxation time; and (3) use of a sufficiently large gas flow rate such that the gas composition surrounding the oxide remains constant over the course of the measurement.
is a dimensionless length reflecting the relative importance of diffusion and surface reactivity to the overall relaxation rate. The experimental requirements for the validity of this expression include: (1) use of a sufficiently small perturbation such that (i) kchem and Dchem can be treated as constants, that (ii) these properties respond linearly to the perturbation magnitude,29 that (iii) conductivity varies linearly with oxygen content, and (iv) that the material does not change temperature due to heat release during oxidation or heat adsorption during reduction; (2) use of a sufficiently small reactor volume such that the reactor flush time is much shorter than the material relaxation time; and (3) use of a sufficiently large gas flow rate such that the gas composition surrounding the oxide remains constant over the course of the measurement.
When kchem ≪ Dchem/a (![[L with combining tilde]](https://www.rsc.org/images/entities/i_char_004c_0303.gif) ≪ 1) the surface reaction dominates the relaxation process, and eqn (2) reduces to
≪ 1) the surface reaction dominates the relaxation process, and eqn (2) reduces to
| |  | (4) |
This simple exponential expression has been widely employed for determining
kchem from the relaxation profiles of thin samples.
The experimental requirements described here for the validity of the ECR analysis methodology are well known. It is of some value, nevertheless, to examine quantitatively, in particular the third requirement, that gas flow rates be sufficiently high that the gas phase composition remain constant. Falkenstein et al. have indeed observed that for a material with rapid kinetic response and large changes in oxygen content, extremely high flow rates may be required to ensure the desired system behavior.23 We have recently presented an analytical treatment of the physical situation in which the flow rate is sufficiently low that the change in material oxidation state is limited by the capacity of the gas to supply/remove oxygen from the sample.18 Under such conditions the change with time in oxygen non-stoichiometry, δ, of a reactive oxide is described by
| |  | (5) |
where
F is the molar flow rate of gas,
nCeOx is the total moles of the oxide (taken here to be ceria),
Ptot is the total pressure of gas, and
pO
in2 is the oxygen partial pressure supplied upon application of the perturbation. The term
pO
2(
δ) is the time-dependent oxygen partial pressure of the gas inside the reaction chamber, in equilibrium with the solid of oxygen content
δ. By definition,
δ varies with time from the initial to final state, and hence
pO
2(
δ) also varies with time. The expression given in
eqn (5) is arrived at by applying an oxygen mass balance requirement to the system. It is valid when (in addition to effectively instantaneous equilibration in the solid state) (1) the oxygen content in the oxide is spatially homogeneous, and (2) the oxygen partial pressure in the gas phase within the chamber is also spatially homogenous (
i.e., perfect mixing within the confines of the reaction chamber).
This result can be used to derive the conductivity relaxation behavior under gas phase-limited kinetics. If pO2(δ) ≪ Ptot, eqn (5) can be simplified to
| |  | (6) |
where it is recognized that
pO
in2 corresponds (irrespective of the simplification) to the equilibrium oxygen partial pressure of the material with the oxygen nonstoichiometry of the final state, and thus
pO
in2 =
pO
2(
δf). Since the oxygen partial pressure change,
pO
2(
δ) −
pO
2(
δf) is very small in a relaxation measurement,
eqn (6) can be further simplified by taking a Taylor expansion,
| |  | (7) |
where
Z is defined as
| |  | (8) |
The solution to this 1st order differential equation is a simple exponential expression:
| |  | (9) |
where
τ is the characteristic time, given by the inverse of
Z.
An analogous form for the dimensionless oxygen partial pressure in the gas-phase has been presented by den Otter et al.23 for the situation in which the reactor, taken to behave as a continuous flow stirred tank reactor (CSTR),26 in which the characteristic time is the response flush-time associated with eliminating the gas already present and replacing it with the new gas. This reactor time constant is independent of material properties (in contrast to the expression given here), but is similarly inversely related to gas flow rate (F), and flush time effects are eliminated by increasing the flow rate. In the apparatus employed here the measured reactor flush time is on order of 10 s, Fig. S1 (ESI†), at least an order of magnitude shorter that the material response time for all measurement conditions, eliminating any need for flush time corrections. The related problem of that in which gas-phase mass transport is too sluggish to eliminate boundary layer effects has been treated numerically by Lohne et al.24 Again, the reliability of the derived parameters generally increases with increasing gas velocity. However, an analytical expression for the relaxation profile is not available.
A significant feature of the result given in eqn (9) is that the functional form of the relaxation behavior in the gas-phase limited (or “sensor” or “quasi-thermodynamic equilibrium”23) regime is identical to that of eqn (4). Thus, gas-phase and material-kinetic limits (where surface reaction dominates over diffusion) cannot be distinguished in the low pO2 regime (at which the simplification embodied in eqn (6) is valid) by analyzing the shapes of the relaxation profiles. Presumption of a surface reaction limited process when in the gas-phase limited regime would yield a kapparentchem = a/τ, which would be substantially smaller than the true kchem.
In the absence of a priori knowledge of the material properties, a simple way to distinguish the two types of behaviors is to evaluate the impact of flow rate (F) on the time constant (τ). Whereas τ is insensitive to F when the material is limited by surface reaction kinetics, it is inversely dependent on F when the system is under gas-phase control. The situation is depicted schematically in Fig. 1. As indicated in the figure, one can expect 1/τ to vary linearly with F up to a value, Ftr, at which Z = kchem/a. This equality yields
| |  | (10) |
where
mCeO2 is the total mass of the oxide,
MCeO2 is the molar mass of the oxide and

. Although not exploited in this work, it is noteworthy that this transition flow rate depends not only on the sample mass, but also on the sample thickness (2
a).
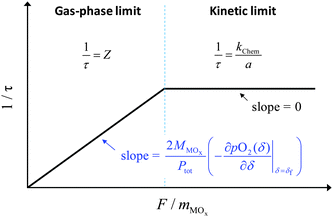 |
| | Fig. 1 Schematic illustration of the time constant as a function of the flow rate under the gas-phase limit and the surface reaction limit. | |
3. Experimental procedures
High temperature ECR studies were performed on undoped, polycrystalline ceria using a free-standing thin-sample geometry. Commercial ceria powder (Inframat Advanced Materials, USA) was compacted into a parallelepiped by uniaxial die-pressing at 100 MPa, followed by cold isostatic pressing at 300 MPa. The green body was sintered at 1500 °C for 10 h, and a compact with density >95% of theoretical was obtained. The sample, 0.3825 g in mass, 0.56 mm in thickness, 5.48 mm in width and ∼19 mm in length, was polished down to 3 μm roughness. In a previous analysis of the conditions of applicability of the 1-D solution to the composition profile (embodied in eqn (2) and (4)), we found that the 1-D model is valid for rectangular-shaped samples so long as the edge thickness is less than ∼20% of the next largest dimension.22 Here, the thickness is only 10% of the sample width, justifying the analysis according to the 1-D model. Conductivity was measured using DC methods in a four-probe configuration. Contact was made by tightly wrapping Pt wires around notches made at the far ends of the sample. Gas and temperature control were provided by an in-house constructed ECR reactor with a sample chamber of approximately 23 cm3 in volume. The sample was placed lengthwise within the 1 cm diameter chamber. The oxygen partial pressure and temperature were measured in situ using a zirconia based oxygen sensor (SIRO2 C700+, Ceramic Oxide Fabricators, Australia) placed approximately 2 cm from the sample.
The relaxation behavior was characterized at 1400 °C (recorded sample temperature) in the range of −4.3 ≤ log(pO2/atm) ≤ −2.0, achieved by flowing mixtures of dry O2 and Ar. Two sets of exploratory experiments were first performed. In the first set, the impact of sweep gas flow rate on both the steady state pO2 and the relaxation time was examined. In the second set of exploratory experiments, the impact of the magnitude of the step change in pO2 was examined at flow rates high enough to ensure material-kinetic limited behavior.30 With the conditions for obtaining reliable material kinetic parameters and specifically kchem values determined (Δlog(pO2/atm) ≤ 0.13 and F ≥ 523 sccm g−1), relaxation profiles were measured over the entire pO2 range of interest and the dependence of kchem on pO2 evaluated. Absence of solid-state diffusion contributions (from all experiments) was established by analyzing the relaxation profiles according to eqn (2) using an in-house written Matlab code.22 The maximum value of ![[L with combining tilde]](https://www.rsc.org/images/entities/i_char_004c_0303.gif) that was encountered was ∼0.26, implying that Dchem ≫a2/τ (i.e., ≫kapparentchema) and thus that bulk diffusion contributes negligibly to the relaxation kinetics. Moreover, fits utilizing eqn (2) and those utilizing the simple exponential form of eqn (4) yielded statistically identical values of τ (and thus of kapparentchem), providing further evidence of negligible solid-state diffusion effects.22
that was encountered was ∼0.26, implying that Dchem ≫a2/τ (i.e., ≫kapparentchema) and thus that bulk diffusion contributes negligibly to the relaxation kinetics. Moreover, fits utilizing eqn (2) and those utilizing the simple exponential form of eqn (4) yielded statistically identical values of τ (and thus of kapparentchem), providing further evidence of negligible solid-state diffusion effects.22
4. Results and discussion
1. Material evaluation
A key requirement for successful ECR experiments is that the material conductivity vary with oxygen partial pressure. As summarized in Fig. 2, the conductivity of ceria indeed shows a clear dependence on oxygen partial pressure (where the latter is that recorded by the oxygen sensor). The present results are consistent with earlier work of Blumenthal et al.,31 and the observed power law exponent of −0.179 ± 0.001 approximately obeys the pO2−1/6 dependence suggested from the defect-chemical analysis reported by Tuller,11 in which it is demonstrated that the dominant defect species are oxygen vacancies and free electrons. The sensitivity of the (n-type) conductivity to pO2 enables the use of relatively small step changes in oxygen partial pressure for the ECR measurements. In particular, for a step change in log(pO2/atm) of 0.068, a typical value utilized in this work, the conductivity changes by about 2.8%, which is easily detected. In addition, the conductivity was invariant over a measurement period of 3 days, indicating excellent stability of both the sample and the electrodes, despite the very high temperature (1400 °C).
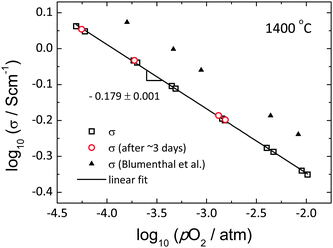 |
| | Fig. 2 Total electrical conductivity of ceria as a function of pO2 at 1400 °C. Red open circle is the conductivity measured after ∼3 days, black line shows the best linear fit, and black filled triangle is from the work of Blumenthal et al.31 for comparison. | |
2. Influence of flow rate
Relaxation profiles obtained as a function of gas flow rate are presented in Fig. 3 over the range of 78 to 523 sccm g−1. A clear increase in the relaxation rate with increasing flow rate is evident. The largely flow-rate independent characteristics of the reactor alone, Fig. S1 (ESI†), justify attribution of this behavior to the material and its interaction with the reactant gas. All of the relaxation profiles were well described by the exponential form expressed in eqn (4) and (9) with reduced R2 values >0.9997 and (error of τ)/τ < 0.2%. The quality of the fit to the lowest flow rate (78 sccm g−1) and the highest flow rates (523 sccm g−1) data sets are shown in Fig. 3(b) as representative examples. The resultant set of relaxation time constants are summarized in Fig. 4, along with the behavior predicted at low flow rate for a gas-phase limited process and at high flow rate for a surface-reaction limited process. The τ are indeed flow-dependent at low flow rates (78–418 sccm g−1) and flow-independent at high flow rates (418–523 sccm g−1). However, the low flow regime does not match the thermodynamic expectation, and moreover, the transition between the two regions is much more gradual than shown schematically on Fig. 1. The deviation is attributed to the strong likelihood that only a small portion of the gas interacts with the solid as it passes through the reactor, and thus the effective gas flow rate per unit mass of oxide is much lower than the supplied value. Indeed, given the small width of the sample (5.48 mm) relative to the 1 cm inner diameter of the reaction chamber and an estimated gas-phase diffusion coefficient of O2 in the O2–Ar mixture of 4.5 cm2 s−1 at 1400 °C,32 it can be readily computed that a residence of time of at least 0.26 s is required for the gas at the periphery of the reactor to come in contact with the center of the sample. Achieving such a residence time over the 1.9 cm length of the sample, in turn, requires a gas velocity of ≤7.3 cm s−1, equivalent to a flow rate of ≤35 sccm. The utilized flow rates are much higher, consistent with the suggestion that kapparentchem is lowered from the theoretical value because the gas does not fully interact with the sample.
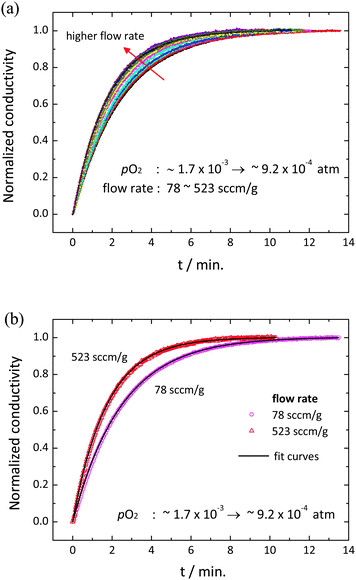 |
| | Fig. 3 Conductivity relaxation behavior at 1400 °C for a pO2 switch from (1.6 ± 0.2) × 10−3 to (9.1 ± 1.0) × 10−4 atm: normalized conductivity relaxation profiles at (a) various flow rates (78 to 523 sccm g−1), and (b) 78 and 523 sccm g−1. Solid lines are the best fits to the exponential decay (eqn (4) or (9)). | |
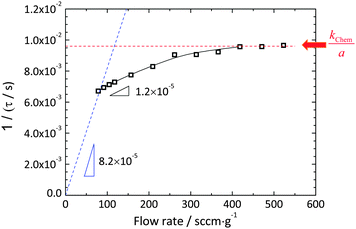 |
| | Fig. 4 The time constant as a function of flow rate derived by fitting to an exponential decay (eqn (3) or (8)). The dotted lines are expected trends under the gas-phase limit (blue) and the surface reaction limit (red). The solid curve is a visual guidance for the measured values. | |
A key conclusion to be drawn from these flow rate dependent measurements is that at high flow rates material kinetic properties can successfully be accessed. The exponential form of the relaxation profile observed here in the flow-rate independent regime implies that the surface reaction step dominates the relaxation behavior, with negligible contribution from solid-state diffusion (i.e., Dchem ≫ kchem·a under these measurement conditions). Significantly, the profiles continue to obey an exponential form even when gas flow rate is important, as predicted from an analysis of gas-phase limited dynamics. While seeking out flow-rate independent behavior seems, perhaps, self-evident as a minimum criterion for determining whether true material behavior has been measured,33 documentation of such behavior appears relatively rare. Moreover, Lohne et al. have gone so far as to suggest that, at high temperatures and low oxygen partial pressures, flow rates (specifically, gas phase velocities) cannot be made large enough to avoid experimental artifacts resulting from unfavorable gas dynamics, in turn, caused by uptake or release of oxygen from the oxide.24 On the basis of numerical simulations, the authors conclude that boundary layer effects, which create a gradient in gas composition from the sample surface to elsewhere in the gas phase, cannot be overcome, implying that plateau behavior cannot be observed. The results obtained here, in which a plateau clearly emerges, demonstrate that, in fact, even at high temperatures and relatively low oxygen partial pressures (<10−3 atm), kinetic properties can be determined by ECR methods. The discrepancy between the two works likely results because the oxygen release from ceria under the present experimental condition is not as large as that for the material and conditions considered by Lohne et al.24 Furthermore, the carrier gas used here is Ar, which leads to a relatively high gas-phase diffusivity and diminishes boundary layer effects.
3. Influence of the magnitude of the pO2 perturbation
Conductivity relaxation profiles obtained for both oxidizing and reducing directions are presented in Fig. 5 (gas flow rate of 784 sccm g−1) for two experimental conditions with similar mean oxygen partial pressures of (a) 6.7 × 10⁻⁵ atm and (b) 6.0 × 10⁻⁵ atm, but different values of |Δlog(pO2)|: (a) 0.19 and (b) 0.13. At this very high gas flow rate, gas-phase limitations are overcome. The profiles reveal significant difference between oxidation and reduction directions in the case of the larger perturbation. In contrast, the pair of profiles obtained under the smaller perturbation are very similar. The extracted kchem values for the small perturbation experiment are (2.404 ± 0.003) × 10−5 cm s−1 for oxidation (koxchem) and (2.278 ± 0.006) × 10−5 for reduction (kredchem), within 5% of one another, with reduced R2 values >0.999. The large perturbation experiment yielded profiles that surprisingly were also well-described by the exponential form of eqn (4). The two surface reaction rate constants extracted are koxchem = (3.725 ± 0.021) × 10−5 cm s−1 (R2 = 0.998) and kredchem = (2.690 ± 0.002) × 10−5 cm s−1 (R2 = 0.999), which differ by 38%.
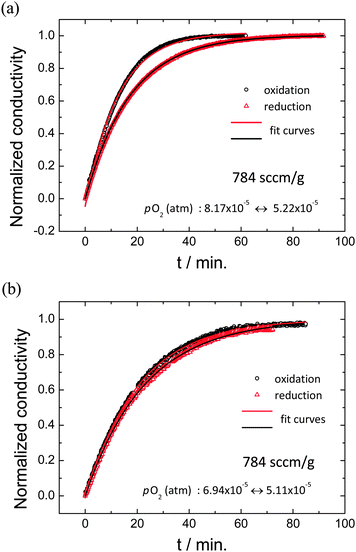 |
| | Fig. 5 Conductivity relaxation profiles upon oxidation and reduction under (a) relatively large pO2 change (8.17 × 10⁻⁵ ↔ 5.22 × 10⁻⁵ atm), showing inequivalence of the forward and reverse profiles and thus application of too large of a step change, and (b) small pO2 change (6.94 × 10⁻⁵ ↔ 5.11 × 10⁻⁵ atm), showing almost identical forward and reverse profiles and thus application of a sufficiently small step change. Solid lines are the best fits to eqn (3); all measurements are performed at 1400 °C and with sufficiently high flow rate (784 sccm g−1) to avoid gas-phase limitations. | |
A substantial difference between the rate constants derived in the two directions (as encountered for the large perturbation measurements) immediately implies that the system is no longer in the simple linear regime. Nevertheless, the profiles, as noted, are well fit by a single exponential expression, a result that others have also observed when the step change is not excessively large.30,34 Asymmetry between koxchem and kredchem under large step changes pO2 has been reported previously, but with significant inconsistencies. Wang et al.30 found koxchem > kredchem and further reported that the rate constant was largely determined by the value of the final oxygen partial pressure. For a kchem that increases with increasing oxygen partial pressure, dependence solely on the final pO2 automatically implies their result of koxchem > kredchem. The relative values determined here may also be due to the same combination of factors (measured kchem depends on final pO2, and true kchem increases with increasing pO2). On the other hand, Merkle and Maier report that kchem depends on both initial and final oxygen partial pressures during oxidation, and solely on the initial pO2 in the reduction direction (a result supported theoretically), hence no generalization is possible with respect to the relative magnitudes of koxchem and kredchem.34 In contrast, Lohne et al. predict kredchem > koxchem when gas stagnation effects become important.24 Most significant for the present study is that it is possible to apply perturbations that are small enough to ensure almost equal values between koxchem and kredchem and hence that the system remains essentially in the linear regime. For the subsequent measurement of kchem as a function of oxygen partial pressure, appropriately small step changes were applied.
4. Surface reaction constant
The dependence of kchem on pO2 over the range −4.3 ≤ log(pO2/atm) ≤ −2.0 is summarized in Fig. 6, for measurements performed using gas flow rates of either 784 or 1046 sccm g−1 and Δ(log(pO2/atm)) values of less than 0.13. The oxygen vacancy content, as reported by Panlener et al.10 is also shown in the figure for comparison. As with all the other relaxation profiles measured in this work, those measured in the construction of Fig. 6 were well described by a simple exponential form. The reduced R2 values were in all cases >0.997 and the (error of kchem)/kchem was <1.7%. The error bar reported in the figure for kchem reflects the difference between the values measured in the oxidation and reduction directions, whereas as that reported for pO2 reflects the perturbation range. The equivalence of the results at 784 and at 1046 sccm g−1 demonstrates that across the entire pO2 regime of measurement, the relaxation behavior was free of gas-phase limitations. The results are, moreover, in excellent agreement with the measurement of Knoblauch et al. who found kchem = 1.66 × 10⁻⁴ cm s−1 at 1410 °C and pO2 = 7 × 10⁻⁴ atm using mass relaxation methods.17
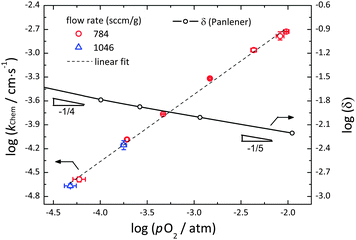 |
| | Fig. 6 The surface reaction rate constant, kchem, for the oxidation/reduction of undoped ceria as a function of pO2 at sufficiently high flow rates (784 and 1046 sccm g−1) at 1400 °C. Shown for comparison is also the oxygen non-stoichiometry, δ, as reported by Panlener et al.,10 on a comparable log scale. The vacancy concentration is given by δ, whereas the electron concentration is given by 2δ. | |
All values of kchem in Fig. 6 lie on a single straight line expressed as:
| | | log(kchem/cm s−1) = (0.84 ± 0.02) × log(pO2/atm) − (0.99 ± 0.05) | (11) |
The power dependence observed here (with a power law exponent
m of 0.84 ± 0.02) is unusual in its magnitude, lying at the extreme upper end of the range of values reported for other mixed ion and electron conductors.
35 It is also unusual in that it reflects the properties of an n-type material catalyzing the reaction between gaseous O
2 and oxygen ions in the solid state. Globally, this can be expressed in Kroger–Vink notation
35–37 as
| |  | (12) |
In the much more commonly examined p-type materials used in the cathodes of solid oxide fuel cells, the reaction is typically expressed as
| |  | (13) |
reflecting the greater abundance of holes (h˙) than free electrons. In those materials, a positive
m (reported values range from 0.14 to 0.82) coincides with an increase in the concentration of the dominant electronic defects with increasing oxygen partial pressure.
22 It has been suggested that
m ≅ 3/4 (for a system with hole concentration that depends on oxygen partial pressure according to a 1/4 power law exponent, and with a low adsorbate coverage as is typical of high temperatures) occurs when reduction of diatomic oxygen from the superoxo to the peroxo species is the rate-limiting step, specifically
38| | | O2,ad− → O2,ad2− + h+ | (14) |
Although the discussion is nominally based on an evaluation of p-type conductors, this result is, in principle, independent of the nature of the dominant electronic species. Moreover, such a reaction can be rate-limiting even when monoatomic oxygen ions (O
ad−), entropically favored at high temperatures, are the predominant adsorbate species. Whether this interpretation can be applied to the behavior of high-temperature, undoped ceria, in which the dominant electronic defects are electrons and the
pO
2 power law exponent describing the concentration of the minority hole species is ∼0.18, remains uncertain. Not only is the defect chemistry substantially different, but also the extent of the experimental data is somewhat limited to support a detailed mechanistic model.
5. Transition between gas-phase and material-kinetic limited behavior
Knowledge of the surface reaction rate across the oxygen partial pressure regime of interest, in combination with the known redox thermodynamics of ceria, enables a precise evaluation of the transition flow rate expected to delineate gas-phase and material-kinetic limited regimes. An approximate solution for Ftr(pO2) can be obtained by insertion of eqn (11) into eqn (10). A more precise solution, valid beyond the constraint of pO2(δ) ≪ Ptot, can be obtained by numerical treatment of eqn (5). The results of these two methods of computing Ftr(pO2) are presented in Fig. 7(a), and a schematic illustrating the expected behavior of the relaxation time as a function of flow rate at different pO2 values presented in Fig. 7(b). For the conditions explored (1400 °C with pO2 ranging from 10−4.5 to 10−1.5 atm) the two methods of calculation produce essentially identical results. More significantly, it is evident that the gas flow rates required to ensure that gas phase limitations are overcome increase dramatically with decreasing oxygen partial pressure. This is a consequence of the redox thermodynamics of ceria, in which the magnitude of dpO2/dδ decreases with decreasing pO2, causing the slope in the flow rate dependent regime of 1/τ (=Z) to decrease, eqn (8). In principle, the decreasing value of kchem with decreasing pO2, Fig. 6, would shift Ftr(pO2) to lower flow rate, but this effect is overwhelmed by the thermodynamic behavior. Along with the computed curves, shown in Fig. 7(a) is the flow rate at which the relaxation behavior was observed to become independent of flow rate. As noted above, this substantial difference is tentatively attributed to a large volume of gas flowing past the sample without interacting with it, in other words, insufficient mixing in the gas phase as a consequence of limited mass transport in the gas. Overall, it is apparent that identification of a suitable flow rate for one set of experimental conditions may not be sufficient to ensure that gas-phase limitations have been overcome for all experimental conditions of interest.
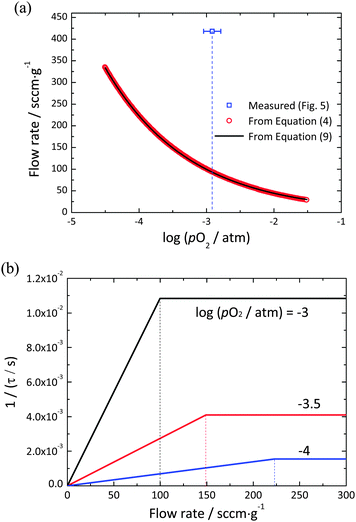 |
| | Fig. 7 (a) Theoretically calculated flow rate at a transition point from the gas-phase to the surface reaction limits for undoped ceria within the range of pO2 from 10−4.5 to 10−1.5 atm at 1400 °C. Red circles are calculated from numerical treatment of eqn (5), the solid curve is from eqn (10), and the blue open square is the value experimentally observed in Fig. 4. (b) 1/τ vs. flow rate at pO2 = 10−3, 10−3.5, and 10−4 atm. The dotted vertical lines indicate the flow rate at the transition point for each value of pO2. | |
5. Conclusions
The relatively large changes in nonstoichiometry of CeO2−δ in response to changes in pO2 at high temperature (1400 °C) result in the overall reaction being limited by the thermodynamic capacity of the sweep gas to supply/remove oxygen to/from undoped ceria, when gas flow rates per mass of ceria are small. Significantly, over a wide range of conditions (corresponding to those at which the equilibrium pO2(δ) is much smaller than Ptot), the relaxation profile under the gas-phase limited regime is identical in form to that obtained when the material is limited by surface reaction kinetics. Thus, observation of an exponential relaxation profile does not imply that the process is surface reaction limited. The two types of behavior can be distinguished by evaluating the impact of flow rate on the time constant, recognizing the time constant is insensitive to flow rate under the material-kinetic limit, whereas it is inversely dependent on flow rate under the gas-phase limit. Because the surface reaction rate is not normally known a priori, direct experimental confirmation that the time constant obtained from relaxation measurement is independent of flow rate is required in order to ensure that the kchem has truly been measured. This requirement is compounded by the fact that even when kchem and the material thermodynamics are known, complexity in the gas phase dynamics results in an effective transition flow rate that is typically much larger than theoretically expected.
The surface reaction constant of undoped ceria, accurately measured at 1400 °C under high gas flow rates, displays a surprisingly steep dependence on oxygen partial pressure, with a power law exponent of 0.84 ± 0.02 in the range of −4.3 ≤ log(pO2/atm) ≤ −2.0. Under these conditions, the dominant defect species, oxygen vacancies and free electrons, both decrease in concentration with increasing pO2, suggesting other factors are at play. This result appears to be amongst the first reports of kchem for the direct reaction of an n-type oxide with oxygen. By analogy to p-type conductors, we speculate that the rate-determining step involves diatomic oxygen species.
Acknowledgements
This material is based upon work supported by the U.S. Department of Energy, through ARPA-e Contract DE-AR0000182. Support for T. C. D. was provided by an EERE Postdoctoral Research Award.
References
- W. C. Chueh, C. Falter, M. Abbott, D. Scipio, P. Furler, S. M. Haile and A. Steinfeld, Science, 2010, 330, 1797–1801 CrossRef CAS PubMed.
- W. C. Chueh and S. M. Haile, Philos. Trans. R. Soc., A, 2010, 368, 3269–3294 CrossRef CAS PubMed.
- Y. Hao, C. K. Yang and S. M. Haile, Phys. Chem. Chem. Phys., 2013, 15, 17084–17092 RSC.
- C. K. Yang, Y. Yamazaki, A. Aydin and S. M. Haile, J. Mater. Chem. A, 2014, 2, 13612–13623 CAS.
- P. Furler, J. Scheffe, M. Gorbar, L. Moes, U. Vogt and A. Steinfeld, Energy Fuels, 2012, 26, 7051–7059 CrossRef CAS.
- J. R. Scheffe, R. Jacot, G. R. Patzke and A. Steinfeld, J. Phys. Chem. C, 2013, 117, 24104–24114 CAS.
- S. G. Rudisill, L. J. Venstrom, N. D. Petkovich, T. Quan, N. Hein, D. B. Boman, J. H. Davidson and A. Stein, J. Phys. Chem. C, 2013, 117, 1692–1700 CAS.
- Y. Hao, C. K. Yang and S. M. Haile, Chem. Mater., 2014, 26, 6073–6082 CrossRef CAS.
- J. R. Scheffe, D. Weibel and A. Steinfeld, Energy Fuels, 2013, 27, 4250–4257 CrossRef CAS.
- R. Panlener, R. Blumenthal and J. Garnier, J. Phys. Chem. Solids, 1975, 36, 1213–1222 CrossRef CAS.
- H. Tuller and A. Nowick, J. Electrochem. Soc., 1979, 126, 209–217 CrossRef CAS.
- C. B. Gopal and A. van de Walle, Phys. Rev. B: Condens. Matter Mater. Phys., 2012, 86, 134117 CrossRef.
- M. Zinkevich, D. Djurovic and F. Aldinger, Solid State Ionics, 2006, 177, 989–1001 CrossRef CAS.
- M. Kamiya, E. Shimada, Y. Ikuma, M. Komatsu and H. Haneda, J. Electrochem. Soc., 2000, 147, 1222–1227 CrossRef CAS.
- S. Ackermann, J. R. Scheffe and A. Steinfeldt, J. Phys. Chem. C, 2014, 118, 5216–5225 CAS.
-
J. Maier, Physical chemistry of ionic materials: ions and electrons in solids, John Wiley & Sons, 2004 Search PubMed.
- N. Knoblauch, L. Dörrer, P. Fielitz, M. Schmücker and G. Borchardt, Phys. Chem. Chem. Phys., 2015, 17, 5849–5860 RSC.
- T. C. Davenport, C.-K. Yang, C. J. Kucharczyk, M. J. Ignatowich and S. M. Haile, Energy Technol., 2016, 4, 764–770 CrossRef CAS.
- I. Yasuda and T. Hikita, J. Electrochem. Soc., 1994, 141, 1268–1273 CrossRef CAS.
- C. R. Song and H. I. Yoo, Solid State Ionics, 1999, 120, 141–153 CrossRef CAS.
- H. Bouwmeester, M. Den Otter and B. Boukamp, J. Solid State Electrochem., 2004, 8, 599–605 CrossRef CAS.
- C. B. Gopal and S. M. Haile, J. Mater. Chem. A, 2014, 2, 2405–2417 CAS.
- A. Falkenstein, D. N. Mueller, R. A. De Souza and M. Martin, Solid State Ionics, 2015, 280, 66–73 CrossRef CAS.
- Ø. F. Lohne, M. Søgaard and K. Wiik, J. Electrochem. Soc., 2013, 160, F1282–F1292 CrossRef.
-
J. Crank, The mathematics of diffusion, Oxford university press, 1979 Search PubMed.
- M. Den Otter, L. Van der Haar and H. Bouwmeester, Solid State Ionics, 2000, 134, 259–264 CrossRef CAS.
- M. Den Otter, H. Bouwmeester, B. Boukamp and H. Verweij, J. Electrochem. Soc., 2001, 148, J1–J6 CrossRef CAS.
- B. A. Boukamp, M. W. den Otter and H. J. Bouwmeester, J. Solid State Electrochem., 2004, 8, 592–598 CrossRef CAS.
- J. Maier, Solid State Ionics, 1998, 112, 197–228 CrossRef CAS.
- S. Wang, A. Verma, Y. Yang, A. Jacobson and B. Abeles, Solid State Ionics, 2001, 140, 125–133 CrossRef CAS.
- R. Blumenthal, P. Lee and R. Panlener, J. Electrochem. Soc., 1971, 118, 123–129 CrossRef CAS.
-
J. R. Welty, C. E. Wicks, G. Rorrer and R. E. Wilson, Fundamentals of momentum, heat, and mass transfer, John Wiley & Sons, 2009 Search PubMed.
- S. Wang, P. van der Heide, C. Chavez, A. Jacobson and S. Adler, Solid State Ionics, 2003, 156, 201–208 CrossRef CAS.
- R. Merkle and J. Maier, Phys. Chem. Chem. Phys., 2002, 4, 4140–4148 RSC.
- W. C. Chueh and S. M. Haile, Annu. Rev. Chem. Biomol. Eng., 2012, 3, 313–341 CrossRef CAS PubMed.
-
F. A. Kröger and J. H. Vink, Relations between Concentrations of Imperfections in Crystalline Solids, in Solid State Physics, Vol. 3,, ed. F. Seitz and D. Turnbull, Academic Press, New York, 1956, pp. 307–435 Search PubMed.
- S. B. Adler, X. Y. Chen and J. R. Wilson, J. Catal., 2007, 245, 91–109 CrossRef CAS.
- J. Fleig, R. Merkle and J. Maier, Phys. Chem. Chem. Phys., 2007, 9, 2713–2723 RSC.
Footnote |
| † Electronic supplementary information (ESI) available. See DOI: 10.1039/c6cp01935h |
|
| This journal is © the Owner Societies 2016 |
Click here to see how this site uses Cookies. View our privacy policy here.  Open Access Article

![[L with combining tilde]](https://www.rsc.org/images/entities/i_char_004c_0303.gif) is a dimensionless length reflecting the relative importance of diffusion and surface reactivity to the overall relaxation rate. The experimental requirements for the validity of this expression include: (1) use of a sufficiently small perturbation such that (i) kchem and Dchem can be treated as constants, that (ii) these properties respond linearly to the perturbation magnitude,29 that (iii) conductivity varies linearly with oxygen content, and (iv) that the material does not change temperature due to heat release during oxidation or heat adsorption during reduction; (2) use of a sufficiently small reactor volume such that the reactor flush time is much shorter than the material relaxation time; and (3) use of a sufficiently large gas flow rate such that the gas composition surrounding the oxide remains constant over the course of the measurement.
is a dimensionless length reflecting the relative importance of diffusion and surface reactivity to the overall relaxation rate. The experimental requirements for the validity of this expression include: (1) use of a sufficiently small perturbation such that (i) kchem and Dchem can be treated as constants, that (ii) these properties respond linearly to the perturbation magnitude,29 that (iii) conductivity varies linearly with oxygen content, and (iv) that the material does not change temperature due to heat release during oxidation or heat adsorption during reduction; (2) use of a sufficiently small reactor volume such that the reactor flush time is much shorter than the material relaxation time; and (3) use of a sufficiently large gas flow rate such that the gas composition surrounding the oxide remains constant over the course of the measurement.
![[L with combining tilde]](https://www.rsc.org/images/entities/i_char_004c_0303.gif) ≪ 1) the surface reaction dominates the relaxation process, and eqn (2) reduces to
≪ 1) the surface reaction dominates the relaxation process, and eqn (2) reduces to


 . Although not exploited in this work, it is noteworthy that this transition flow rate depends not only on the sample mass, but also on the sample thickness (2a).

![[L with combining tilde]](https://www.rsc.org/images/entities/i_char_004c_0303.gif) that was encountered was ∼0.26, implying that Dchem ≫a2/τ (i.e., ≫kapparentchema) and thus that bulk diffusion contributes negligibly to the relaxation kinetics. Moreover, fits utilizing eqn (2) and those utilizing the simple exponential form of eqn (4) yielded statistically identical values of τ (and thus of kapparentchem), providing further evidence of negligible solid-state diffusion effects.22
that was encountered was ∼0.26, implying that Dchem ≫a2/τ (i.e., ≫kapparentchema) and thus that bulk diffusion contributes negligibly to the relaxation kinetics. Moreover, fits utilizing eqn (2) and those utilizing the simple exponential form of eqn (4) yielded statistically identical values of τ (and thus of kapparentchem), providing further evidence of negligible solid-state diffusion effects.22


