 Open Access Article
Creative Commons Attribution 3.0 Unported Licence
Origin-independent two-photon circular dichroism calculations in coupled cluster theory
Daniel H.
Friese
*a,
Christof
Hättig
b and
Antonio
Rizzo
c
aCentre for Theoretical and Computational Chemistry, University of Tromsø, Tromsø, Norway. E-mail: daniel.h.friese@uit.no
bLehrstuhl für Theoretische Chemie, Ruhr-Universität Bochum, Bochum, Germany
cConsiglio Nazionale delle Ricerche – CNR, Istituto per i Processi Chimico-Fisici, IPCF-CNR, Sede Secondaria di Pisa, Area della Ricerca, Via G. Moruzzi 1, I-56124 Pisa, Italy
First published on 3rd May 2016
Abstract
We present the first origin-independent approach for the treatment of two-photon circular dichroism (TPCD) using coupled cluster methods. The approach is assessed concerning its behavior on the choice of the basis set and different coupled cluster methods. We also provide a comparison of results from CC2 with those from density functional theory using the CAM-B3LYP functional. Concerning the basis set we note that in most cases an augmented triple zeta basis or a doubly augmented double zeta basis is needed for reasonably converged results. In the comparison of different coupled cluster methods results from CCSD, CC3 and CC2 have been found to be quite similar in most cases, while CCS results differ remarkably from the results at the higher levels. However, this proof-of-principle study also shows that further benchmarking of DFT and CC2 against accurate coupled cluster reference values (e.g. CCSD or CC3) is needed.
1 Introduction
When a chiral sample is traversed by intense circularly polarized electromagnetic radiation, the two-photon absorption strength measured for left and right circularly polarized light is different. Two-photon circular dichroism (TPCD) is the measure of this difference, found in principle in any optical arrangement where at least one of the two absorbed photons is circularly polarized.1–3 This optical process is the lowest-order non-linear analogue of the well-known electronic circular dichroism (ECD), and is closely related to two-photon absorption (TPA), a phenomenon predicted by Göppert-Mayer in 19314 and observed experimentally for the first time in 1961 by Kaiser and Garett,5 with the advent of high-intensity laser sources. The evaluation of two-photon absorption data has been pushed forward some years later by work of Peticolas,6 Monson and McClain7 and Andrews and Ghoul.8The first theoretical description of TPCD dates back to the mid-seventies in work carried out almost simultaneously by Tinoco, by Power and by Andrews.1–3 First measurements have been reported in 1995 by Gunde and Richardson for chiral gadolinium complexes.9 The interest in the phenomenon was revived a decade ago, by the development of a computational protocol which allowed one to make reliable predictions of the intensity of two-photon circular dichroism,10–13 followed by the design of an experimental setup,12,14 leading, thirteen years after the first qualitative observation, to the flourishing of a new spectroscopic discipline, where the analysis of experimental TPCD spectra is carried out nowadays with the support of computed results.11
Two-photon spectroscopy methods are becoming increasingly popular, both from the experimental and computational aspects, because they have proven to be complementary to their one-photon analogues. Compared with the latter, the former allows exploring spectral regions using photons with increasing penetration depth, higher 3D confocality and reduced photobleaching effects. One-photon absorption often takes place in the far- and near-UV regions of the electromagnetic spectrum and overlaps in many cases with the response of standard aqueous buffer solutions or other common solvents. In these cases the lower laser frequencies used in two-photon spectrometers help getting access to information otherwise hidden. Another advantage of two-photon spectroscopy methods arises from the different transition rules. In particular for samples with an inversion point, transitions which are symmetry forbidden at the one-photon level are allowed in the corresponding two-photon spectroscopy. Although this aspect is less relevant for dichroic response, due to the reduced symmetry of chiral samples or environments, it is a fact that even for low-symmetry systems quite often states that are weak one-photon absorbers are active when probed by two photons.15
Different selection rules can also be observed when comparing absorptive and dichroic (differential absorptive) properties as they are related to different operators (magnetic dipole moment and electric quarupole moment) with different symmetry behaviour, therefore dichroic properties allow the detection of states which might be difficult to detect by absorptive properties.
In this respect it is worth noting that, when dealing with isotropic samples, TPCD is the lowest-order chiroptical property where electric quadrupole transitions play a role.11 Lower-order absorption properties, such as one-photon absorption and electronic circular dichroism (ECD), and two-photon absorption can be rationalized to the lowest order in perturbation theory by resorting to either only electric dipole (OPA, TPA) or magnetic and electric dipole transition moments (ECD). The contribution of electric quadrupole transitions, formally arising at the same order of perturbation theory as magnetic dipole transitions, averages out for these spectroscopy methods, whereas it is non-vanishing and often non-negligible in TPCD. In addition, TPCD is very sensitive to conformational changes in chiral molecules,11,16,17 and it can be used to gain insight into the conformational structure of a molecule.
In general the computational description of TPCD requires the calculation of two-photon transition strengths which correspond to the single residues of the cubic response function.18 The transition strengths can be decomposed in left and right transition moment tensors which can also be obtained from single residues of the quadratic response function.18,19 Implementations of two-photon absorption strengths are available today for SCF-based methods20,21 as well as at different levels of coupled cluster response theory which enables a description with a hierarchy of methods with systematically increasing accuracy with an approximate treatment of doubles,22 full doubles,23 approximate triples,24etc. These implementations can be used for TPCD calculations as long as the required perturbation operators (electric dipole moment, magnetic dipole moment and electric quadrupole moment, vide infra) are available in the corresponding code.
Since the computational protocol for TPCD has been outlined,10,25 quantum chemical calculations have consistently exploited a time-dependent density functional theory (TD-DFT) structure model, mainly due to the size of the systems investigated also by experimentalists. In this study we develop and test a novel approach where we transfer the computational protocol for TPCD to coupled cluster response theory. In contrast to TD-DFT calculations, which normally scale at most with the fourth power of the system size, coupled cluster methods have a steeper scaling behavior depending on the excitation level, but offer the possibility of systematic improvement in the hierarchy of coupled cluster methods.26 As for two-photon absorption,22,27 coupled cluster can therefore be considered to be a reference method which additionally does not have the known deficiencies of TD-DFT e.g. in the description of Rydberg and charge transfer states.28 It can therefore be used to validate TD-DFT and provides an alternative when TD-DFT is not applicable because it does not give correct excitation energies.
Since the rotatory strengths in TPCD spectra involve mixed electric dipole–magnetic dipole and electric dipole–electric quadrupole transition tensors, the problem of (magnetic and electric quadrupole gauge) origin dependence of the results arises, as it is also the case for electronic circular dichroic and optical rotation spectra. In methods that describe the response of the electronic wavefunction to the electro-magnetic field in an orbital-relaxed framework, this problem can be solved by using the so-called gauge-including atomic orbitals (GIAOs).29–34
This is, however, not easily possible for the standard coupled cluster response methods where unrelaxed orbitals are used for frequency-dependent properties and transition moments.35–37 Therefore other approaches are usually used to get origin-independent results for frequency-dependent magnetic properties with standard coupled cluster methods. For optical rotation and one-photon circular dichroism techniques have been established which express the electric dipole operator in velocity gauge and thereby achieve origin invariance.36–39 A similar velocity-gauge based technique, which is actually based on the original derivation of TPCD from ref. 1, has been introduced by one of us to obtain origin-independent results for TPCD using SCF-based methods (Hartree–Fock and TD-DFT) and has become standard for the computational treatment of TPCD.25 Very recently, a GIAO-based treatment of TPCD for SCF-based theory has also been realized by one of us.40 In the following we will adapt the velocity-gauge based approach to the requirements of coupled cluster theory.
The remainder of this article is organized as follows: in Section 2 we describe the basic theory of TPCD and its origin invariant description and show how it can be applied in connection with coupled cluster response methods. Section 3 is dedicated to technical information about the methods and molecules which were used. In Section 4 we present a general assessement of the approach where we compare results from different basis sets, coupled cluster models and density functional theory before we discuss our results in Section 5.
2 Theory
The general theory for TPCD has been first presented by Tinoco in 1975.1 Afterwards there have been some other formulations by Power2 and Andrews,3 and Meath and Power have discussed TPCD in their 1987-paper.41 However, Tinoco's approach has found most attention during the last decade since Rizzo and coworkers have shown in 2006 that it is the best choice for obtaining origin-independent results for TPCD with finite basis sets.25 Just recently the theory by Tinoco has been discussed in more detail by one of us.42As all properties that involve the magnetic dipole and electric quadrupole operators TPCD also suffers in the length gauge formulation from the problem of origin dependence which occurs as long as the calculations are not carried out in a complete one-electron basis set.25 In CC theory also an untruncated cluster operator would be needed.43,44 However the approach presented by Rizzo and coworkers circumvents the problem of origin-dependence by treating the electric dipole operator completely in the velocity gauge and the electric quadrupole operator in a mixed length-velocity gauge. In the following we will very briefly recapitulate this approach before we present its generalization for coupled cluster response theory.
2.1 TPCD in velocity gauge formulation
TPCD, which is the differential two-photon absorption of left and right circularly polarized light, can be written as25 | (1) |
The quantity fRTP is called TPCD rotatory strength. It is defined as
fRTP = −b1![[scr B, script letter B]](https://www.rsc.org/images/entities/char_e13f.gif) 1 − b2 1 − b2![[scr B, script letter B]](https://www.rsc.org/images/entities/char_e13f.gif) 2 − b3 2 − b3![[scr B, script letter B]](https://www.rsc.org/images/entities/char_e13f.gif) 3, 3, | (2) |
![[scr B, script letter B]](https://www.rsc.org/images/entities/char_e13f.gif) 1,
1, ![[scr B, script letter B]](https://www.rsc.org/images/entities/char_e13f.gif) 2 and
2 and ![[scr B, script letter B]](https://www.rsc.org/images/entities/char_e13f.gif) 3 are defined as
3 are defined as | (3) |
 | (4) |
 | (5) |
![[scr P, script letter P]](https://www.rsc.org/images/entities/char_e52f.gif) p,f0ab and
p,f0ab and ![[scr M, script letter M]](https://www.rsc.org/images/entities/char_e145.gif) p,0fab denote the electric-dipole–electric-dipole and the electric-dipole–magnetic-dipole transition moments with the electric dipole moment expressed in velocity gauge (μp). In a sum-over-states formulation these expressions are
p,0fab denote the electric-dipole–electric-dipole and the electric-dipole–magnetic-dipole transition moments with the electric dipole moment expressed in velocity gauge (μp). In a sum-over-states formulation these expressions are | (6) |
 | (7) |
The tensor ![[scr T, script letter T]](https://www.rsc.org/images/entities/char_e533.gif) +,0fab is a special form of the electric-dipole–electric-quadrupole transition moment tensor which is defined as
+,0fab is a special form of the electric-dipole–electric-quadrupole transition moment tensor which is defined as
 | (8) |
 | (9) |
2.2 Origin independence
The origin dependencies of the operators m and T+ are:| Δma = −½εacdRcμpd, | (10) |
| ΔT+ab = −μpaRb − μpbRa, | (11) |
 | (12) |
 | (13) |
![[scr B, script letter B]](https://www.rsc.org/images/entities/char_e13f.gif) 3 is origin independent by construction.25 In case the transition moments are obtained from response calculations using variational methods, eqn (12) and (13) are immediately25 zero since the tensors
3 is origin independent by construction.25 In case the transition moments are obtained from response calculations using variational methods, eqn (12) and (13) are immediately25 zero since the tensors ![[scr P, script letter P]](https://www.rsc.org/images/entities/char_e52f.gif) p,0f and
p,0f and ![[scr P, script letter P]](https://www.rsc.org/images/entities/char_e52f.gif) p,f0 are for these methods—as for the exact wavefunctions—the complex conjugates of each other, so that εdabRa
p,f0 are for these methods—as for the exact wavefunctions—the complex conjugates of each other, so that εdabRa![[scr P, script letter P]](https://www.rsc.org/images/entities/char_e52f.gif) p,0fcb
p,0fcb![[scr P, script letter P]](https://www.rsc.org/images/entities/char_e52f.gif) p,f0cd and εbadRa
p,f0cd and εbadRa![[scr P, script letter P]](https://www.rsc.org/images/entities/char_e52f.gif) p,0fcd
p,0fcd![[scr P, script letter P]](https://www.rsc.org/images/entities/char_e52f.gif) p,f0cb cancel each other exactly.
p,f0cb cancel each other exactly.
2.3 TPCD in coupled cluster theory
The discussion of origin dependence which was given in the previous section does not hold for non-variational response methods such as coupled cluster since in these cases the two transition moments![[scr P, script letter P]](https://www.rsc.org/images/entities/char_e52f.gif) p,0f and
p,0f and ![[scr P, script letter P]](https://www.rsc.org/images/entities/char_e52f.gif) p,f0 are no longer related by complex conjugation. However, as shown e.g. in eqn (51) of ref. 45, the absorption strengths are obtained in general from left and right transition moments M0f and Mf0, which are no longer the complex conjugate of each other, according to
p,f0 are no longer related by complex conjugation. However, as shown e.g. in eqn (51) of ref. 45, the absorption strengths are obtained in general from left and right transition moments M0f and Mf0, which are no longer the complex conjugate of each other, according to | (14) |
 | (15) |
 | (16) |
 | (17) |
3 Computational details
3.1 Molecules in the test set
To explore the behavior of TPCD with different coupled cluster methods and basis sets we have used a test set of small molecules which also allow for high-level coupled cluster calculations. Their structures are shown in Fig. 1. The tricyclic molecules as well as 5 have been taken from a test set for optical rotation which was set up by Srebro and coworkers.47 From this reference also the structures were taken.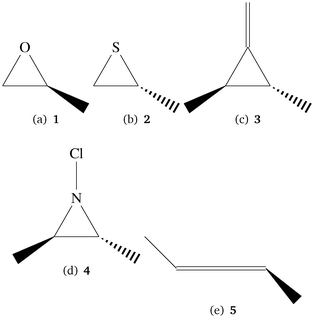 | ||
| Fig. 1 Small molecules in the test set for method and basis set behavior. The molecules were taken from a test set by Srebro et al.47 | ||
For the study of the basis set behavior and for a first comparison with DFT results we have used the CC2 method48 and some additional molecules that are larger and also feature larger π-systems so that they allow for the investigation of π→π*- and n→π*-excitations while the spectra of the smaller molecules are dominated by Rydberg states. They are, however, at the limit of what can be treated with the available CCSD implementation for two-photon transition strengths. The additional molecules for the basis set study are shown in Fig. 2.
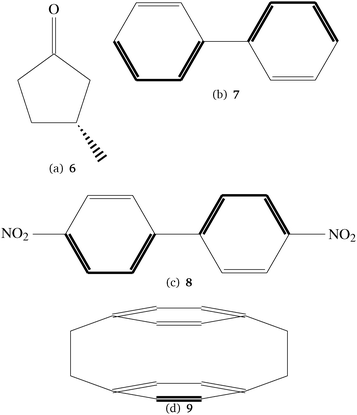 | ||
| Fig. 2 Molecules in the test set for the basis set behavior. All molecules are used in chiral conformations. No. 6 was studied in ref. 49. | ||
6 has been studied thoroughly by one of us using different conformers, basis sets and density functionals.49 In this paper a structure which was optimized using the B3LYP functional50–54 and the TZVP basis set.55 Structures 7, 8 and 9 in Fig. 2 are achiral, however all molecules are treated here in chiral, frozen conformations. For 7 and 8 these structures have also been optimized using the B3LYP density functional and the TZVP basis set, while for the optimization of 9 the MP2 model and the cc-pVTZ basis set have been used. The reason for this is that for 9 the presumably correct D2 point group symmetry is not correctly reproduced by many DFT functionals. Optimization in the D2 point group symmetry is achieved by MP2 in sufficiently large basis sets, as reported in several studies.56–58
3.2 TPCD-calculations
The coupled cluster calculations at the CC2 level were carried out using the ricc2 module59 from the TURBOMOLE suite of programs,60,61 namely the functionality for the calculation of two-photon absorption which has been developed by two of us22 and has for the current study been extended to compute the integrals and transition tensors for the TPA rotatory strength. The ricc2 program uses the RI approximation for two-electron repulsion integrals (ERI) which gives a large benefit in efficiency and a large reduction in memory and I/O demands without introducing any significant errors in the results.62 The calculations for the other coupled cluster models CCS, CCSD and CC3 were carried out using the DALTON electronic structure program63,64 which includes the TPA implementation reported in ref. 23. These calculations, which are used to study the convergence of the TPCD rotatory strength with the coupled cluster model, have been carried out only for the aug-cc-pVDZ basis set.65,66 At the CC2 level we also used the aug-cc-pVTZ, aug-cc-pVQZ, aug-cc-pV5Z and aug-cc-pV6Z basis sets from the same references together with the corresponding optimized auxiliary basis sets67,68 to study the basis set convergence. The same auxiliary basis sets are also used together with the doubly augmented basis sets d-aug-cc-pVXZ with X = D, T, Q, 5 as previous studies have shown that they still provide a high accuracy and that additional diffuse auxiliary functions have only a minor benefit.62 For chlorine and sulphur d-aug-cc-pVQZ and d-aug-cc-pV5Z basis sets have been constructed from the singly augmented ones using the even-tempered approximation.Using both programs, the tensors ![[scr P, script letter P]](https://www.rsc.org/images/entities/char_e52f.gif) p,0f,
p,0f, ![[scr P, script letter P]](https://www.rsc.org/images/entities/char_e52f.gif) p,f0,
p,f0, ![[scr M, script letter M]](https://www.rsc.org/images/entities/char_e145.gif) p,0f,
p,0f, ![[scr M, script letter M]](https://www.rsc.org/images/entities/char_e145.gif) p,f0,
p,f0, ![[scr T, script letter T]](https://www.rsc.org/images/entities/char_e533.gif) +,0f and
+,0f and ![[scr T, script letter T]](https://www.rsc.org/images/entities/char_e533.gif) +,f0 have been calculated and combined according to eqn (15)–(17) to the intermediates
+,f0 have been calculated and combined according to eqn (15)–(17) to the intermediates ![[scr B, script letter B]](https://www.rsc.org/images/entities/char_e13f.gif) CC1,
CC1, ![[scr B, script letter B]](https://www.rsc.org/images/entities/char_e13f.gif) CC2 and
CC2 and ![[scr B, script letter B]](https://www.rsc.org/images/entities/char_e13f.gif) CC3 and the rotatory strength fRTP (eqn (2)).
CC3 and the rotatory strength fRTP (eqn (2)).
The TD-DFT calculations have been carried out using the CAM-B3LYP density functional69 and the aug-cc-pVDZ basis set using the DALTON program.63,64
The factors forming the rotatory strength are set to b1 = 6.0, b2 = 2.0 and b3 = −2.0 following ref. 25. This choice corresponds to two circularly polarized photons which propagate parallel to each other.
To get the TPCD in Göppert-Mayer (GM) units, which are also used to report two-photon absorption cross-sections, we rewrite eqn (1) slightly following the lines of ref. 70 setting in the conversion factors for the speed of light in vacuo, the Bohr radius and time from atomic units to the cgs unit system and get
| δTPCD = 4.87555 × 10⁻⁵ω2g(2ω)fRTP. | (18) |
4 Basis set and method study
4.1 Basis set behavior
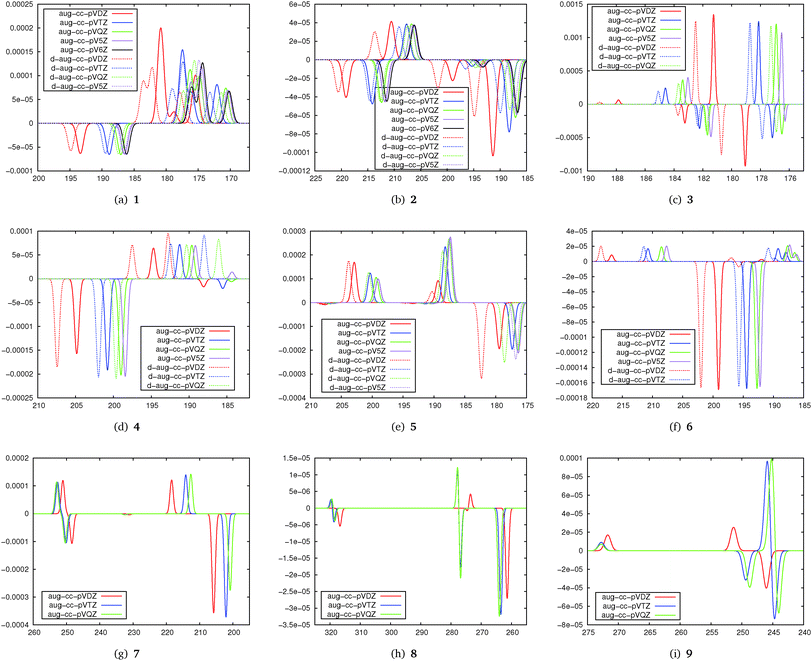
The basis set convergence of TPCD in correlated wavefunction calculations has been studied at the CC2 level. The results of the basis set study are plotted in Fig. 3 as simulated TPCD spectra.The simulated TPCD spectra contain information on both the excitation energy and the TPCD strength for different singly and doubly augmented basis sets. The first important finding from this part of the study is that double augmentation is less important for the TPCD strength than for the excitation energy, where it is crucial if Rydberg states play a role. However, as this study focusses on the TPCD strength effects, the excitation energy will not be further discussed here. Therefore, the large and computationally demanding doubly augmented basis sets do not seem to be recommendable for an efficient description of TPCD.
The second important finding is that depending on the molecule, TPCD is about converged with the aug-cc-pVDZ (4–7) or aug-cc-pVTZ basis set (1, 2, 3, 8, and 9). In some cases (e.g.1, 2, 5 and 8) the basis set dependence for different states differs a lot so that we can conclude that basis set convergence of TPCD depends non-trivially on both the molecule and the character of the excited state. The results show that the basis set convergence can be expected already for aug-cc-pVDZ if the valence spectrum of larger molecules is studied (6, 7 or 8), while for smaller molecules, where Rydberg states are often important, aug-cc-pVTZ or even a larger basis set will be needed. The more difficult basis set behaviour of 9 might be strongly influenced by the π-stacking effects of the two aromatic rings, complicating the description of the electronic structure. These findings are consistent with the well-established finding that the basis set convergence is often faster for larger molecules, in particular if they have a three-dimensional structure.
4.2 Model behavior
| 1 | 2 | ||||||
|---|---|---|---|---|---|---|---|
| CCS | CC2 | CCSD | CC3 | CCS | CC2 | CCSD | CC3 |
| 140 (8.85) | 193 (6.41) | 173 (7.17) | 172 (7.20) | 228 (5.44) | 246 (5.03) | 249 (4.98) | 249 (4.94) |
| 137 (9.07) | 181 (6.86) | 168 (7.47) | 165 (7.51) | 189 (6.55) | 219 (5.66) | 213 (5.83) | 213 (5.79) |
| 133 (9.30) | 179 (6.94) | 164 (7.63) | 161 (7.67) | 182 (6.82) | 211 (5.89) | 209 (5.94) | 209 (5.92) |
| 133 (9.34) | 175 (7.07) | 159 (7.84) | 158 (7.86) | 170 (7.30) | 199 (6.23) | 194 (6.39) | 194 (6.36) |
| 132 (9.41) | 162 (7.67) | 155 (8.05) | 154 (8.05) | 164 (7.55) | 191 (6.48) | 187 (6.65) | 186 (6.61) |
| 3 | ||
|---|---|---|
| CCS | CC2 | CCSD |
| 176 (7.03) | 191 (6.50) | 188 (6.61) |
| 172 (7.21) | 188 (6.60) | 181 (6.83) |
| 161 (7.71) | 181 (6.84) | 174 (7.14) |
| 169 (7.33) | 183 (6.77) | 177 (7.01) |
| 155 (7.92) | 179 (6.92) | 171 (7.24) |
For the excitation energies we note that the results from CCS are strongly blue-shifted in all cases while CC2 shows a slight red shift compared to CCSD and CC3 which yield very similar excitation energies in all cases.
Simulated TPCD spectra are shown in Fig. 4. Regarding the excitation energies they show the expected behaviour for the different methods: CCS excitation energies are normally strongly blue-shifted compared to the others, while CC2 values are red-shifted for Rydberg states. For 1 we note that the spectra for CCSD and CC2 are in excellent agreement while CCS even fails to reproduce most of the TPCD signs. The plots for CCSD and CC3 are nearly on top of each other. The artificial spectra for CC2 and CCSD/CC3 would look even more similar if the CC2 values would be blue-shifted to the excitation energies from CCSD/CC3. For 2 the difference between CCSD and CC2 is a bit larger, however, all peaks can be identified in both spectra also with a good qualitative agreement in intensity. The agreement between CCSD and CC3 is much higher than the one between CCSD and CC2, however, we note that it is less pronounced than for 1. CCS is far off the higher-order methods. For 3 the difference between CC2 and CCSD is stronger than for 1 and 2, however, the dominating peaks can be identified in both spectra although they are a bit shifted. Anyway from the comparison of the peaks we can also see more similarities between CCS and CCSD compared to the other molecules. In general this small test series shows that CC2 and the higher order coupled cluster models are in quite good agreement when it comes to the description of TPCD spectra while CCS in general yields poorer results. This is also supported by the position of CC2 in the coupled cluster hierarchy where it is located between CCS and CCSD.26
In general time-dependent density functional theory is known for having deficiencies in the treatment of charge transfer and Rydberg states. Parts of these deficiencies are compensated by a flexible exact exchange contribution as it is realized in the so-called range-separated functionals such as the CAM-B3LYP functional which has been used for this study.
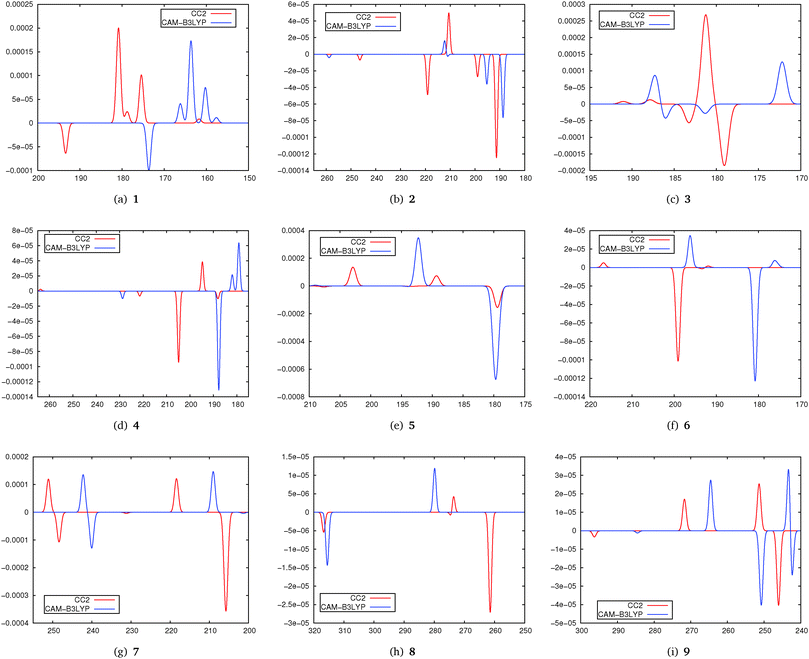
In Fig. 5 simulated spectra for the five lowest states of molecules 1–9 obtained using CC2 and CAM-B3LYP are shown. As in the previous parts of the study the spectra have been obtained by centering Gaussians with a unit width and a height corresponding to the TPCD strength at the excitation energy.
From these spectra we note that the agreement between DFT and CC2 is very different. A general tendency is that DFT/CAM-B3LYP excitation energies are to a certain extent blue-shifted. When evaluating the data plotted in Fig. 5 it has to be kept in mind that in both DFT and CC2 calculations only the five lowest excited states have been considered. This means that changes in the ordering of the states especially for S4 and S5 might occur.
For 1 we find a very good qualitative agreement between the spectra. The agreement for 2 is a bit poorer while for 3 we cannot really recognize a systematic agreement. For molecules 4, 5 and 6 we can at least identify the most intense peaks in both spectra. In particular for 7 and 8, this is at least the case for the two lowest states. In 9 it is possible to identify some peaks in both spectra, although this molecule, due to the strong influence of π-stacking effects on the structure, might be expected to be a problematic case in DFT treatment. Furthermore we have to recall that in 3 and 5 the chromophore is an isolated C![[double bond, length as m-dash]](https://www.rsc.org/images/entities/char_e001.gif) C-double bond. Its TPCD spectrum is apparently described adaquately neither by CAM-B3LYP nor by CC2.
C-double bond. Its TPCD spectrum is apparently described adaquately neither by CAM-B3LYP nor by CC2.
In general comparing the results from this part of the study we identify a moderate agreement between TD-DFT and CC2. Further benchmarking of TPCD values from TD-DFT against coupled cluster methods is needed. Note that some molecules of the test set we used here are relatively small, which give rise to low-lying Rydberg states. While these states are described well by coupled cluster, it is well known that their treatment is one of the strong deficiencies of TD-DFT with commonly used functionals.71
For this reason an upcoming benchmark study should focus especially on larger molecules where the problem of low-lying Rydberg states is less pronounced. However, such a benchmark requires the availability of efficient and parallelized CC3- and CCSD-implementations of two-photon transition tensors which is not yet the case. In case this is done, other density functionals should also be taken into account.
5 Discussion
We presented a scheme for the coupled cluster treatment of two-photon circular dichroism based on the origin-independent velocity gauge approach that is used for TPCD calculations for SCF-based methods for about a decade now. Both the method and the basis set behavior of coupled cluster TPCD calculations have been investigated.Regarding the basis set behavior we found that the aug-cc-pVDZ basis set from the correlation-consistent basis set family often does not yield satisfying results. For small molecules or when Rydberg states are important converged results require at least a basis set of aug-cc-pVTZ quality. For valence transitions in larger molecules the quality of the results obtained using the aug-cc-pVDZ basis set is, however, usually acceptable. In a comparison of different coupled cluster models we could find that there is a general excellent agreement between CCSD and CC3 and that in most cases also the agreement between CC2 and CCSD is quite good while CCS behaves poorly. For this reason we consider CC2 to be a promising candidate for a benchmark method for DFT calculations although further benchmarking of this is needed, especially for larger molecules. However, the availability of efficient and parallel CCSD and CC3 implementations of two-photon transition moments would be required for this.
In a comparison between CC2 and the CAM-B3LYP functional, however, we found a moderate agreement of the results. We find a strong deviation of excitation energies between CC2 and CAM-B3LYP, however, especially for larger TPCD values and molecules with an unproblematic electronic structure (no π-stacking as in paracyclophane), there is qualitative agreement between the artificial TPCD spectra for these two methods. Also, here a more thorough benchmarking is required which should not only involve higher-order coupled cluster models but also other density functionals.
Appendix A: formation of rotatory strengths
As discussed before TPCD is obtained from different contributions involving the electric dipole, the magnetic dipole, and the electric quadrupole operators. However, a straightforward theoretical derivation of these results does not necessarily fit with the results obtained from a calculation using a perturbation operator in a quantum chemistry program. Therefore here we will discuss the connection between the results obtained from DALTON and TURBOMOLE and the theory presented by Tinoco,1 Rizzo et al.25 and us earlier in this article. The major aim of this subsection is to describe the connection between the operators implemented in the program and the operators needed for the rotatory strength.It is important to note that the definitions and the labels of the operators differ between the different implementations. In the case of the electric dipole operator in velocity gauge multiplication with  is already carried out prior to the printing of the results in the DFT code in DALTON, while in the coupled cluster codes in DALTON and TURBOMOLE this is not the case. Moreover the signs of the angular momentum operators differ between DALTON and TURBOMOLE. Table 2 gives an overview of the different operators, their labels and definitions. This information is, of course, subject to changes in the code and reflects the stage of the implementations when this work was written.
As can be seen from the table different implementations differ only by signs and prefactors. However this has important implications for the formation of the rotatory strengths. For the formation from the TD-DFT results in DALTON the following equation has to be used
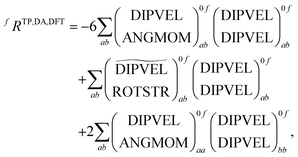 | (19) |
![[scr T, script letter T]](https://www.rsc.org/images/entities/char_e533.gif) +,0f from the electric quadrupole–electric dipole transition tensor. The arrays of operator labels denote the matrix elements as printed by the program for either the left (0f) or the right (f0) transition matrix elements. The coupled cluster outputs from DALTON are evaluated using
+,0f from the electric quadrupole–electric dipole transition tensor. The arrays of operator labels denote the matrix elements as printed by the program for either the left (0f) or the right (f0) transition matrix elements. The coupled cluster outputs from DALTON are evaluated using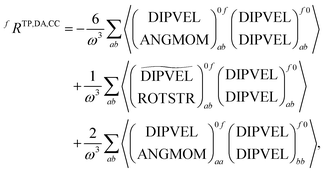 | (20) |
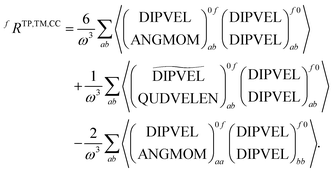 | (21) |
Acknowledgements
This work received support from the Research Council of Norway through a Centre of Excellence grant (Grant No. 179568/V30) and the Norwegian Supercomputing Program (Grant No. NN4654K). C. H. gratefully acknowledges financial support from the Deutsche Forschungsgemeinschaft (DFG) through grant no. HA 2588/5.References
- I. Tinoco, J. Chem. Phys., 1975, 62, 1006–1009 CrossRef CAS.
- E. A. Power, J. Chem. Phys., 1975, 63, 1348–1350 CrossRef CAS.
- D. Andrews, Chem. Phys., 1976, 16, 419–424 CrossRef CAS.
- M. Göppert-Mayer, Ann. Phys., 1931, 401, 273–294 CrossRef.
- W. Kaiser and C. G. B. Garrett, Phys. Rev. Lett., 1961, 7, 229–231 CrossRef CAS.
- W. Peticolas, Annu. Rev. Phys. Chem., 1967, 18, 233–260 CrossRef CAS.
- P. R. Monson and W. M. McClain, J. Chem. Phys., 1970, 53, 29–37 CrossRef CAS.
- D. L. Andrews and W. A. Ghoul, J. Chem. Phys., 1981, 75, 530–538 CrossRef CAS.
- K. E. Gunde and F. Richardson, Chem. Phys., 1995, 194, 195–206 CrossRef CAS.
- B. Jansík, A. Rizzo and H. Ågren, Chem. Phys. Lett., 2005, 414, 461–467 CrossRef.
- C. Toro, L. De Boni, N. Lin, F. Santoro, A. Rizzo and F. Hernández, Chem. – Eur. J., 2010, 16, 3504–3509 CrossRef CAS PubMed.
- F. E. Hernández and A. Rizzo, Molecules, 2011, 16, 3315–3337 CrossRef PubMed.
- A. Rizzo, S. Coriani and K. Ruud, Computational Strategies for Spectroscopy: from Small Molecules to Nano Systems, John Wiley & Sons, Hoboken, NJ, 2012, ch. 2, pp. 77–135 Search PubMed.
- L. D. Boni, C. Toro and F. E. Hernández, Opt. Lett., 2008, 33, 2958–2960 CrossRef PubMed.
- D. H. Friese, A. Mikhaylov, M. Krzeszewski, Y. M. Poronik, A. Rebane, K. Ruud and D. T. Gryko, Chem. – Eur. J., 2015, 18364–18374 CrossRef CAS PubMed.
- C. Diaz, L. Echevarria and F. E. Hernández, Chem. Phys. Lett., 2013, 568–569, 176–183 CrossRef CAS.
- C. Díaz, L. Echevarria and F. E. Hernández, J. Phys. Chem. A, 2013, 117, 8416–8426 CrossRef PubMed.
- J. Olsen and P. Jørgensen, J. Chem. Phys., 1985, 82, 3235–3264 CrossRef CAS.
- C. Hättig, O. Christiansen and P. Jørgensen, J. Chem. Phys., 1998, 108, 8331–8354 CrossRef.
- H. Hettema, H. J. Aa. Jensen, P. Jørgensen and J. Olsen, J. Chem. Phys., 1992, 97, 1174–1190 CrossRef CAS.
- P. Sałek, O. Vahtras, J. D. Guo, Y. Luo, T. Helgaker and H. Ågren, Chem. Phys. Lett., 2003, 374, 446–452 CrossRef.
- D. H. Friese, C. Hättig and K. Ruud, Phys. Chem. Chem. Phys., 2012, 14, 1175–1184 RSC.
- C. Hättig, O. Christiansen and P. Jørgensen, J. Chem. Phys., 1998, 108, 8355–8359 CrossRef.
- M. Paterson, O. Christiansen, F. Pawlowski, P. Jørgensen, C. Hättig, T. Helgaker and P. Salek, J. Chem. Phys., 2006, 124, 054322 CrossRef PubMed.
- A. Rizzo, B. Jansík, T. B. Pedersen and H. Ågren, J. Chem. Phys., 2006, 125, 064113 CrossRef PubMed.
- H. Koch, O. Christiansen, P. Jørgensen and J. Olsen, Chem. Phys. Lett., 1995, 244, 75–82 CrossRef CAS.
- M. J. Paterson, O. Christiansen, F. Pawłowski, P. Jørgensen, C. Hättig, T. Helgaker and P. Sałek, J. Chem. Phys., 2006, 124, 054322 CrossRef PubMed.
- A. Dreuw, J. L. Weisman and M. Head-Gordon, J. Chem. Phys., 2003, 119, 2943–2946 CrossRef CAS.
- F. London, J. Phys. Radium, 1937, 8, 397 CrossRef CAS.
- H. Hameka, Mol. Phys., 1958, 1, 203–215 CrossRef CAS.
- J. A. Pople, Discuss. Faraday Soc., 1962, 34, 7–14 RSC.
- R. Ditchfield, J. Chem. Phys., 1972, 56, 5688–5691 CrossRef CAS.
- R. Ditchfield, Mol. Phys., 1974, 27, 789–807 CrossRef CAS.
- T. Helgaker and P. Jørgensen, J. Chem. Phys., 1991, 95, 2595–2601 CrossRef CAS.
- T. B. Pedersen and H. Koch, J. Chem. Phys., 1997, 106, 8059–8072 CrossRef CAS.
- T. B. Pedersen, H. Koch and K. Ruud, J. Chem. Phys., 1999, 110, 2883–2892 CrossRef CAS.
- T. B. Pedersen and H. Koch, J. Chem. Phys., 2000, 112, 2139–2147 CrossRef CAS.
- K. Ruud, P. J. Stephens, F. J. Devlin, P. R. Taylor, J. R. Cheeseman and M. J. Frisch, Chem. Phys. Lett., 2003, 373, 606–614 CrossRef CAS.
- T. B. Pedersen, H. Koch, L. Boman and A. M. Sánchez de Merás, Chem. Phys. Lett., 2004, 393, 319–326 CrossRef CAS.
- D. H. Friese, M. Ringholm, B. Gao and K. Ruud, J. Chem. Theory Comput., 2015, 11, 4814–4824 CrossRef CAS PubMed.
- W. J. Meath and E. A. Power, J. Phys. B: At. Mol. Phys., 1987, 20, 1945 CrossRef CAS.
- D. H. Friese, J. Chem. Phys., 2015, 143, 096101 CrossRef PubMed.
- T. B. Pedersen, H. Koch and C. Hättig, J. Chem. Phys., 1999, 110, 8318–8327 CrossRef CAS.
- T. B. Pedersen, B. Fernández and H. Koch, J. Chem. Phys., 2001, 114, 6983–6993 CrossRef CAS.
- C. Hättig, O. Christiansen and P. Jørgensen, J. Chem. Phys., 1998, 108, 8331–8354 CrossRef.
- H. Koch and P. Jørgensen, J. Chem. Phys., 1990, 93, 3333–3344 CrossRef CAS.
- M. Srebro, N. Govind, W. A. de Jong and J. Autschbach, J. Phys. Chem. A, 2011, 115, 10930–10949 CrossRef CAS PubMed.
- O. Christiansen, H. Koch and P. Jørgensen, Chem. Phys. Lett., 1995, 243, 409–418 CrossRef CAS.
- A. Rizzo, N. Lin and K. Ruud, J. Chem. Phys., 2008, 128, 164312 CrossRef PubMed.
- P. A. M. Dirac, Proc. R. Soc. A, 1929, 123, 714–733 CrossRef CAS.
- J. C. Slater, Phys. Rev., 1951, 81, 385–390 CrossRef CAS.
- S. H. Vosko, L. Wilk and M. Nusair, Can. J. Phys., 1980, 58, 1200–1211 CrossRef CAS.
- A. D. Becke, Phys. Rev. A: At., Mol., Opt. Phys., 1988, 38, 3098–3100 CrossRef CAS.
- C. Lee, W. Yang and R. G. Parr, Phys. Rev. B: Condens. Matter Mater. Phys., 1988, 37, 785–789 CrossRef CAS.
- F. Weigend, M. Häser, H. Patzelt and R. Ahlrichs, Chem. Phys. Lett., 1998, 294, 143–152 CrossRef CAS.
- D. Henseler and G. Hohlneicher, J. Phys. Chem. A, 1998, 102, 10828–10833 CrossRef CAS.
- S. Grimme, Chem. – Eur. J., 2004, 10, 3423–3429 CrossRef CAS PubMed.
- D. H. Friese, C. Hättig and J. Koßmann, J. Chem. Theory Comput., 2013, 9, 1469–1480 CrossRef CAS PubMed.
- C. Hättig and F. Weigend, J. Chem. Phys., 2000, 113, 5154–5161 CrossRef.
- TURBOMOLE developer's version, a devolpment of Universität Karlsruhe and of Forschungszentrums Karlsruhe GmbH, 1989–2007, TURBOMOLE GmbH, 2007; available at http://www.turbomole.com.
- F. Furche, R. Ahlrichs, C. Hättig, W. Klopper, M. Sierka and F. Weigend, Wiley Interdiscip. Rev.: Comput. Mol. Sci., 2014, 4, 91–100 CrossRef CAS.
- C. Hättig and A. Köhn, J. Chem. Phys., 2002, 117, 6939–6951 CrossRef.
- K. Aidas, C. Angeli, K. L. Bak, V. Bakken, R. Bast, L. Boman, O. Christiansen, R. Cimiraglia, S. Coriani, P. Dahle, E. K. Dalskov, U. Ekström, T. Enevoldsen, J. J. Eriksen, P. Ettenhuber, B. Fernández, L. Ferrighi, H. Fliegl, L. Frediani, K. Hald, A. Halkier, C. Hättig, H. Heiberg, T. Helgaker, A. C. Hennum, H. Hettema, E. Hjertenæs, S. Høst, I.-M. Høyvik, M. F. Iozzi, B. Jansík, H. J. A. Jensen, D. Jonsson, P. Jørgensen, J. Kauczor, S. Kirpekar, T. Kjærgaard, W. Klopper, S. Knecht, R. Kobayashi, H. Koch, J. Kongsted, A. Krapp, K. Kristensen, A. Ligabue, O. B. Lutnæs, J. I. Melo, K. V. Mikkelsen, R. H. Myhre, C. Neiss, C. B. Nielsen, P. Norman, J. Olsen, J. M. H. Olsen, A. Osted, M. J. Packer, F. Pawlowski, T. B. Pedersen, P. F. Provasi, S. Reine, Z. Rinkevicius, T. A. Ruden, K. Ruud, V. V. Rybkin, P. Sałek, C. C. M. Samson, A. Sánchez de Merás, T. Saue, S. P. A. Sauer, B. Schimmelpfennig, K. Sneskov, A. H. Steindal, K. O. Sylvester-Hvid, P. R. Taylor, A. M. Teale, E. I. Tellgren, D. P. Tew, A. J. Thorvaldsen, L. Thøgersen, O. Vahtras, M. A. Watson, D. J. D. Wilson, M. Ziolkowski and H. Ågren, Wiley Interdiscip. Rev.: Comput. Mol. Sci., 2013, 4, 269 CrossRef PubMed.
- DALTON, a molecular electronic structure program, Release Dalton2011 (2011), see http://daltonprogram.org/.
- T. H. Dunning, J. Chem. Phys., 1989, 90, 1007–1023 CrossRef CAS.
- D. E. Woon and T. H. Dunning, J. Chem. Phys., 1993, 98, 1358–1371 CrossRef CAS.
- F. Weigend, A. Köhn and C. Hättig, J. Chem. Phys., 2002, 116, 3175–3183 CrossRef CAS.
- C. Hättig, Phys. Chem. Chem. Phys., 2005, 7, 59–66 RSC.
- T. Yanai, D. P. Tew and N. C. Handy, Chem. Phys. Lett., 2004, 393, 51–57 CrossRef CAS.
- M. Guillaume, K. Ruud, A. Rizzo, S. Monti, Z. Lin and X. Xu, J. Phys. Chem. B, 2010, 114, 6500–6512 CrossRef CAS PubMed.
- A. Dreuw and M. Head-Gordon, Chem. Rev., 2005, 105, 4009–4037 CrossRef CAS PubMed.
| This journal is © the Owner Societies 2016 |

