 Open Access Article
Creative Commons Attribution 3.0 Unported Licence
Investigation of the electrochemical and photoelectrochemical properties of Ni–Al LDH photocatalysts†
Shoji
Iguchi
a,
Soichi
Kikkawa
a,
Kentaro
Teramura
*abc,
Saburo
Hosokawa
ab and
Tsunehiro
Tanaka
*ab
aDepartment of Molecular Engineering, Graduate School of Engineering, Kyoto University, Kyotodaigaku Katsura, Nishikyo-ku, Kyoto 615-8510, Japan. E-mail: teramura@moleng.kyoto-u.ac.jp; Fax: +81-75-383-2561; Tel: +81-75-383-2559
bElements Strategy Initiative for Catalysts & Batteries (ESICB), Kyoto University, 1-30 Goryo-Ohara, Nishikyo-ku, Kyoto 615-8245, Japan
cPrecursory Research for Embryonic Science and Technology (PRESTO), Japan Science and Technology Agency (JST), 4-1-8 Honcho, Kawaguchi, Saitama 332-0012, Japan
First published on 22nd April 2016
Abstract
Layered double hydroxide (LDH) photocatalysts, including Ni–Al LDH, are active for the photocatalytic conversion of CO2 in water under UV light irradiation. In this study, we found that a series of LDHs exhibited anodic photocurrent which is a characteristic feature corresponding to n-type materials. Also, we estimated the potentials of photogenerated electrons and holes for LDHs, which are responsible for the photocatalytic reactions, using electrochemical techniques. The flat band potential of the Ni–Al LDH photocatalyst was estimated to be −0.40 V vs. NHE (pH = 0), indicating that the potential of the photogenerated electron is sufficient to reduce CO2 to CO. Moreover, we revealed that the flat band potentials of M2+–M3+ LDH are clearly influenced by the type of trivalent metal (M3+) components.
Introduction
Layered double hydroxides (LDHs), also known as anionic clays,1–3 have the general formula [M1−x2+–Mx3+(OH)2](An−)x/n·mH2O, where M2+ and M3+ are divalent and trivalent cations, respectively; An− is an interlayer anion of valence n; and x denotes the molar ratio of M3+/(M2+ + M3+). The metal cations occupy the centers of edge-sharing octahedra, whose vertexes contain hydroxide ions that connect to form infinite two-dimensional sheets. Currently, many advanced applications for LDHs have been developed: for example, anion conductive materials,4–7 capacitors,8–11 electrocatalysts12 and photocatalysts.13–15 Some reactions carried out using these photocatalysts are photocatalytic degradation of organic compounds using a series of Zn-containing LDHs (Zn–Al, Zn–Bi, and Zn–Ti LDH)14,16,17 and a CeO2/Mg–Al LDH composite,18 half-reactions of photocatalytic water splitting in the presence of sacrificial reagents using Ti-containing LDHs (Ni–Ti and Zn–Ti LDH)19,20 and Zn–Cr LDH,21 and photocatalytic conversion of CO2.22–25 We developed a photocatalytic system for the conversion of CO2 in aqueous solution using Ni–Al LDH,26,27 which enables the selective formation of CO (as the reduction product of CO2) because of the complete suppression of H2 evolution via the reduction of protons (H+). The hydroxyl groups on the surface of LDH might act as an adsorption site for the dissolved CO2 molecules in the reaction solution. In such a case, photoirradiation through Pyrex glass did not induce any photocatalytic reaction over Ni–Al LDH, whereas the use of quartz glass allowed the photocatalytic conversion of CO2, indicating that UV light irradiation (λ < 300 nm) is necessary for this photocatalytic reaction.28 In contrast, García et al. reported that Zn–Cr LDH was an active photocatalyst for the oxidation of H2O into O2 under visible light irradiation.21 Because LDHs show photocatalytic activities for several kinds of reactions as reported by us and others (as cited above), there must be an energy gap that can induce photocatalytic reactions under illumination. However, only a few studies have investigated the electrochemical properties of these LDHs, such as energy gap measurement, charge separation induced by photoirradiation, and potentials of photogenerated electrons and holes. Concerning the reduction of CO2 in aqueous media, the relationship between the standard potential for CO2 (i.e., E°(CO2/CO) = −0.11 V vs. NHE)29 and the potential of the photoexcited electron in the photocatalyst material must be considered carefully because it is difficult to reduce CO2, one of the most stable molecules, particularly in comparison with the reduction of a proton (E°(H+/H2) = 0.0 V vs. NHE).29Electrochemical and photoelectrochemical measurements are useful techniques that are widely used in the field of photocatalysis to understand the photocatalytic properties of materials, such as the distinction between n-type and p-type semiconductors, photon-to-current conversion efficiencies, energy levels of the bottom of the conduction band (hereinafter “ECB”) and the top of the valence band (hereinafter “EVB”), and the energy gap of the band structure (hereinafter “EBG”).30 Electrochemical properties can be investigated by observing the interface between the semiconductor electrode and the electrolyte solution while applying an external bias to the former.31,32 When a certain potential is applied, the Fermi level of the semiconductor lies at the same energy as the redox potential of the electrolyte solution, and there is no charge transfer between them; thus, no band bending occurs. This potential is referred to as the flat band potential (hereinafter “EFB”).33,34 For n-type semiconductors,31 the cathodic dark current is detected when the applied potential is more negative than EFB because the accumulation layer, which appears under cathodic polarization, enables electron transfer from the electrode to the electrolyte solution, similar to that of a metallic electrode. In contrast, n-type semiconductors can act as photoanodes under anodic polarization. The photogenerated hole (h+) in the depletion layer can move toward the interface, in accordance with band bending, and can easily receive electrons from the electrolyte solution. This permits electron transfer from the semiconductor to the counter electrode through a conductor cable, which is regarded as the anodic photocurrent. The values of EFB and EBG for semiconductor photocatalysts can be determined experimentally by using the Mott–Schottky and Davis–Mott equations; the details are presented in the Experimental section.
Recently, Wei et al. reported the theoretical studies on the band edge placement of M2+–M3+ LDHs (M2+ = Mg2+, Co2+, Ni2+, and Zn2+; M3+ = Al3+ and Ga3+), and the relationship between the band position and the photocatalytic activity for water oxidation was discussed.35 In the present study, we have demonstrated properties such as the photoresponse character, energy gap, and potential of the photogenerated electron and hole for LDHs including Ni–Al LDH, which show the photocatalytic activities for the conversion of CO2 in water, using experimental techniques based on photoelectrochemical considerations.
Experimental section
Electrode preparation
Ni–Al LDH was synthesized using a typical coprecipitation method. An aqueous solution containing NiCl2·6H2O (99.9%, Wako) and AlCl3 (98.0%, Wako) was slowly dropped into an aqueous Na2CO3 (99.5%, Wako) solution at room temperature. The pH of the solution was kept stable between 9.9 and 10.1 by adding an aqueous NaOH (97.0%, Wako) solution using a liquid feed pump (NRP-76, NISSHIN RIKA). The resulting suspension was aged at 383 K under hydrothermal conditions using a stainless steel autoclave equipped with an inner Teflon vessel. The solid cake was collected by filtration and washed with ultra-pure water, and then dried at 383 K in air. Other combinations of metal components in LDH, such as Mg–Al, Zn–Al, Ni–Ga, and Ni–In, were fabricated via the same procedure as Ni–Al LDH using chloride salts as precursors.For electrochemical and a photoelectrochemical measurements, LDH electrodes were prepared on a fluorine doped tin oxide (FTO) glass via an electrophoresis deposition method. 100 mg of LDH powder was added into 50 mL of an acetone solution containing 10 mg of iodine as an electrolyte, and then the LDH powder was dispersed thoroughly by ultrasonication. Prior to use, FTO glass (AGC fabritech Co., Ltd) was washed with acetone and 2-propanol solution in turn. Two FTO glasses were immersed in the solution facing each other, and direct current (DC) was applied between the two FTO glasses by using an electrochemical measurement system (HZ-5000, Hokuto Denko Corp.), at 0.1 mA stable current (2 min) for measurements in an aqueous solution, and at 10.0 V stable voltage (5 min) for those in an organic solution. After drying at room temperature in air, the prepared LDH electrode (hereinafter, called the X LDH/FTO electrode, X = Ni–Al, Mg–Al, Zn–Al, Ni–Ga, and Ni–In) was heated at 473 K for 2 h in order to remove the residual iodine. As reference electrodes, TiO2/FTO and Ta2O5/FTO electrodes were prepared via the same procedure using TiO2 (ST-01, Ishihara Sangyo Kaisha, Ltd) and Ta2O5 (Kojundo Chemical Laboratory Co., Ltd) as powder samples.
Characterization
X-ray diffraction (XRD) patterns of the prepared electrodes were collected by using an X-ray diffractometer (Multiflex, Rigaku) using Cu Kα radiation at an acceleration voltage of 40 kV with 0.02° per step. Scanning electron microscopy images for a sectioned view of the electrodes were captured by using a Field Emission Scanning Electron Microscope (SU-8220, Hitachi High-Technologies) at an acceleration voltage of 3.0 kV. UV/Vis diffuse reflectance spectra of LDH powder samples were measured using a UV-Visible spectrometer (V-670, JASCO) equipped with an integrated sphere accessory. The energy gap (hereinafter “Eg”) of a series of LDHs and the EBG of TiO2 and Ta2O5 were determined by the Davis–Mott equation36 using the Kubelka–Munk function F(R∞) obtained from the diffuse reflectance spectrum,| [F(R∞)hν]−n = A(hν − Eg) | (1) |
Electrochemical measurements
Electrochemical measurements were performed using a three-electrode electrochemical cell consisting of the prepared LDH/FTO electrode, Ag/AgCl electrode, and Pt wire as the working electrode, reference electrode, and counter electrode, respectively. Prior to the measurements, the dissolved air in the electrolyte solution was completely removed by He gas flow. For a cyclic voltammetry, acetonitrile solution was used as a solvent, which contains 0.05 M of LiClO4 as the electrolyte. The current value was recorded as the applied voltage was varied from −2.0 to 1.0 V vs. Ag/AgCl at a sweep rate of 10 mV s−1 using an electrochemical measurement system (HZ-5000, Hokuto Denko Corp.). For impedance measurements, an aqueous Na2SO4 solution (0.1 M) was used as an electrolyte solution. The imaginary component of the impedance (Z′′) of the equivalent circuit including the X LDH/FTO electrode (X = Ni–Al, Mg–Al, Zn–Al, Ni–Ga, or Ni–In) was evaluated at an alternating current frequency of 72.0, 52.0, and 37.3 kHz with a sweeping applied voltage from 0.5 to −0.5 V vs. Ag/AgCl using an electrochemical measurement system (HZ-5000, Hokuto Denko Corp.). The capacitance (C) of the circuit was calculated from the imaginary component of the impedance (Z′′) using the relation,| |Z′′| = 1/(2πfC) | (2) |
| C−2 = (2/εε0A2eND)(E − EFB − kBT/e) | (3) |
| E(pH=a) = E(pH=b) − 0.059 × (a − b) | (4) |
| E(vs. NHE) − E(vs. Ag/AgCl) = 0.199 V | (5) |
| E(vs. NHE) − E(vs. SCE) = 0.244 V | (6) |
Photoelectrochemical measurements
Photoelectrochemical measurements were conducted using a three-electrode electrochemical cell equipped with a quartz window. The prepared LDH/FTO electrode, the Ag/AgCl electrode, and Pt wire were used as the working electrode, reference electrode, and counter electrode, respectively. For the measurement in an organic solvent, LiClO4 acetonitrile solution (0.05 M) containing 5 vol% methanol was used as the electrolyte solution. In contrast, an aqueous Na2SO4 solution which contains 5 vol% methanol was used for the measurement in an aqueous solution. In both cases, the solution was thoroughly degassed by He gas flow. The working electrode (X LDH/FTO, X = Ni–Al, Mg–Al, and Zn–Al) was irradiated using a 200 W Hg–Xe lamp (SAN-EI Electric Co., Ltd) through the quartz window. The photocurrent value was collected using an electrochemical measurement system (HZ-5000, Hokuto Denko Corp.) without an external bias. For linear sweep voltammetry under photoirradiation, the applied bias was swept from −1.5 to 1.0 V vs. Ag/AgCl.Results and discussion
Fig. 1A shows the X-ray diffraction (XRD) pattern of the prepared Ni–Al LDH/FTO composite. Compared to those of the Ni–Al LDH powder sample (a) and bare FTO glass (c), the XRD pattern of Ni–Al LDH/FTO (b) shows mixed diffraction peaks of the above two samples. Two low angle peaks, 11° and 23°, in the powder sample are indexed as (0 0 3) and (0 0 6) planes, respectively, which define the characteristic layer structure of the LDH powders.1 The peak positions of these reflections correspond to the layer-to-layer thickness; that is, the interlayer distance is equal to d(0![[thin space (1/6-em)]](https://www.rsc.org/images/entities/char_2009.gif) 0
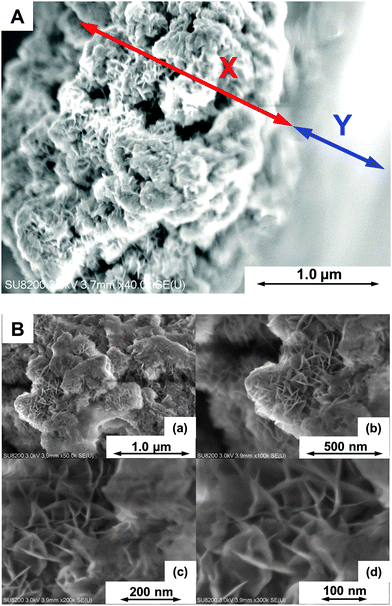
0![[thin space (1/6-em)]](https://www.rsc.org/images/entities/char_2009.gif) 3) with respect to hexagonal axes. As shown in Fig. 1B, Ni–Al LDH/FTO exhibited small peaks around the same position as those in the powder sample, indicating that Ni–Al LDH is fixed onto the FTO glass and retains its layer structure. Moreover, the interlayer distance was conserved after the deposition onto FTO, because the positions of the (0 0 3) and (0 0 6) reflections were unchanged. As previously reported,26,27 other LDHs (Mg–Al, Zn–Al, Ni–Ga, and Ni–In LDH) were successfully synthesized (XRD patterns of powder samples of these prepared LDHs are presented in Fig. S1, ESI†). Moreover, the specific surface area of the Ni–Al LDH powder sample was estimated to be ca. 100 m2 g−1. Fig. 2A shows the SEM images of Ni–Al LDH/FTO prepared using the electrophoresis deposition method. Regions X and Y mark the deposited Ni–Al LDH region and the FTO glass, respectively. We found that Ni–Al LDH particles with a thickness of several micrometers were deposited on the FTO glass. Regarding the enlarged views shown in Fig. 2B, flower-petal-like morphologies, which are characteristic of LDH-type materials,1,39 were also maintained. These SEM images are consistent with the results of XRD measurements of Ni–Al LDH/FTO. Based on the XRD patterns and SEM images, the state of the Ni–Al LDH deposited on FTO glass is considered to be similar to that of the powder sample, which shows photocatalytic activity for the conversion of CO2 in aqueous solution.26,28
3) with respect to hexagonal axes. As shown in Fig. 1B, Ni–Al LDH/FTO exhibited small peaks around the same position as those in the powder sample, indicating that Ni–Al LDH is fixed onto the FTO glass and retains its layer structure. Moreover, the interlayer distance was conserved after the deposition onto FTO, because the positions of the (0 0 3) and (0 0 6) reflections were unchanged. As previously reported,26,27 other LDHs (Mg–Al, Zn–Al, Ni–Ga, and Ni–In LDH) were successfully synthesized (XRD patterns of powder samples of these prepared LDHs are presented in Fig. S1, ESI†). Moreover, the specific surface area of the Ni–Al LDH powder sample was estimated to be ca. 100 m2 g−1. Fig. 2A shows the SEM images of Ni–Al LDH/FTO prepared using the electrophoresis deposition method. Regions X and Y mark the deposited Ni–Al LDH region and the FTO glass, respectively. We found that Ni–Al LDH particles with a thickness of several micrometers were deposited on the FTO glass. Regarding the enlarged views shown in Fig. 2B, flower-petal-like morphologies, which are characteristic of LDH-type materials,1,39 were also maintained. These SEM images are consistent with the results of XRD measurements of Ni–Al LDH/FTO. Based on the XRD patterns and SEM images, the state of the Ni–Al LDH deposited on FTO glass is considered to be similar to that of the powder sample, which shows photocatalytic activity for the conversion of CO2 in aqueous solution.26,28
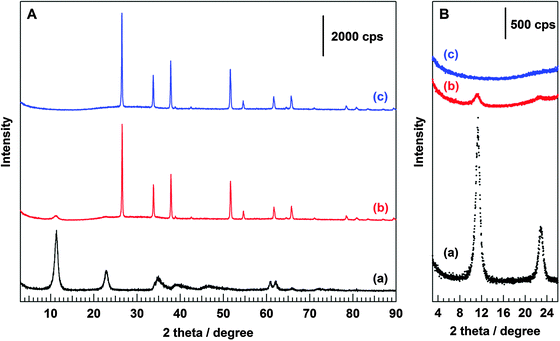 | ||
| Fig. 1 XRD patterns of (a) Ni–Al LDH powder sample, (b) Ni–Al LDH/FTO, and (c) bare FTO collected in a (A) wide range scan and (B) narrow range scan. | ||
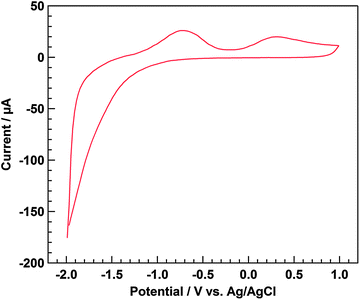
Fig. 3 shows the cyclic voltammogram recorded using a three-electrode electrochemical cell. The prepared Ni–Al LDH/FTO was used as the working electrode under a He atmosphere. When the working electrode was set under cathodic polarization, the cathodic dark current was determined, indicating that electron transfer from the working electrode to the electrolyte solution occurred because of the formation of an accumulation layer at the interface of the electrode, making the electron flow possible without an electric barrier. The cathodic dark current under cathodic polarization is known to be a characteristic feature of n-type semiconductor materials. In contrast, anodic current should not be found under dark conditions for n-type electrodes because of the band bending in the depletion layer. However, two anodic current peaks were found. Because the standard potential was reported as E°(IO3−/I−) = 1.08 V vs. NHE (pH = 0),29 the first peak, at ca. 0.4 V vs. Ag/AgCl, was assigned to the oxidation of I− to IO3−, derived from I2 that was used in the electrophoresis process. However, we were unable to assign the other peak, at ca. −0.2 V, to any reaction.
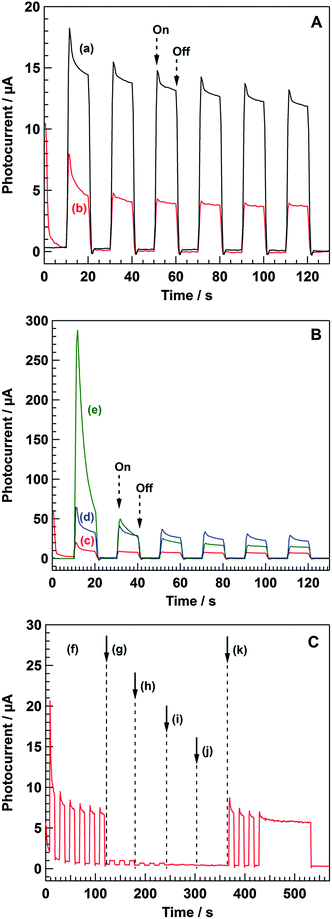
Fig. 4A shows the photocurrent values of the Ni–Al LDH/FTO working electrode under illumination cycling through the quartz window with no applied external bias. The anodic photocurrent increased upon illumination and diminished when the illumination stopped. The use of acetonitrile solution containing LiClO4 resulted in a higher photocurrent than that compared to the use of an aqueous Na2SO4 solution. In both cases, the addition of methanol into the electrolyte solution was necessary to induce the anodic photocurrent, indicating that photogenerated holes (h+) can oxidize methanol in the electrolyte solution and photoexcited electrons (e−) can transfer to the counter electrode as an anodic current. As shown in Fig. 4B, the substitution of Ni2+ in Ni–Al LDH by either Mg2+ or Zn2+ affected the photocurrent value, and the order of the initial photocurrent intensity was (e) Zn–Al LDH >, (d) Mg–Al LDH > and (c) Ni–Al LDH. This agrees with the quantity of electrons consumed in the photocatalytic conversion of CO2 in water using these LDHs (powder samples) as previously shown;26 specifically, the amount of electrons used to reduce CO2 and H+ (CO and H2 were produced as reduction products) during 8 h of photoirradiation was 254, 110, and 68 μmol for Zn–Al LDH, Mg–Al LDH, and Ni–Al LDH, respectively (see the ESI† for the details of powder reaction: Table S1). Although Ni–Al LDH led to the evolution of the largest amount of CO and showed the highest selectivity among these M2+–Al LDHs, the total amount of reduction products was largest in the Zn–Al LDH because, in that case, a large amount of H2 was evolved. The photocurrent values measured in the present study are considered to reflect the total photocatalytic activities of the LDH photocatalysts; that is, the metal components of the hydroxide sheets alter the photocatalytic activity of a series of LDH materials, and Zn–Al LDH is a good photocatalyst based on the results of the photoelectrochemical measurements. Nevertheless the photocurrent value was smaller than others; Ni–Al LDH can reduce CO2 into CO with high selectivity (Table S1, ESI†). However, it is possible that self-oxidation of Zn–Al LDH by the photogenerated holes led to a rapid decrease in the photocurrent intensity, as reported for the case of ZnO.40Fig. 4C shows the photocurrent value of Ni–Al LDH/FTO under cycled illumination in a photoelectrochemical cell using an aqueous Na2SO4 solution as the electrolyte. In regions (f) and (k), photoirradiation was performed using a Hg–Xe lamp through a quartz window. For regions (g), (h), (i), and (j), long-pass cut-off filters UV-29, UV-31, UV-33, and UV-35, respectively, were set to control the photoirradiation wavelengths. The photocurrent intensity under photoirradiation through the UV-29 filter was much smaller than that through the quartz window. Moreover, the use of UV-31, UV-33, or UV-35 significantly diminished the photocurrent value during illumination. This result indicates that UV light irradiation of <270 nm is necessary to induce photocatalytic reactions over Ni–Al LDH, because a very low percentage of light at 270 nm can be transmitted through the UV-29 filter. Based on a Davis–Mott plot of Ni–Al LDH shown in Fig. S2 (ESI†), the band gap energy of Ni–Al LDH is estimated at 4.8 eV (=258 nm). This value is consistent with the results of the wavelength dependence measurements on the photocurrent intensity.
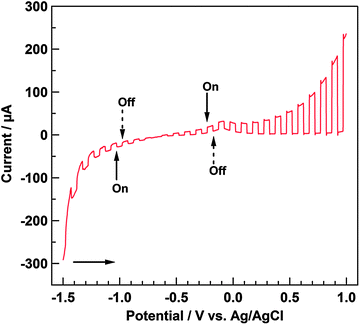
Fig. 5 shows the linear sweep voltammograms measured while the light source was cycled on and off under a He atmosphere. Under anodic polarization, the anodic photocurrent flowed when photoirradiation started. The presence of a depletion layer at the interface of the electrode under anodic polarization enables the separation of the photogenerated charge carriers. Accordingly, for an n-type material at the positive potential, the band edges curve upwards, the hole moves toward the interface, and the electron moves to the interior of the material.31,32 Holes are high-energy species that can extract an electron from the electrolyte solution; that is, the n-type material acts as a photoanode under anodic polarization. Based on this, it can be inferred that Ni–Al LDH has electrochemical properties corresponding to an n-type material. In contrast, a small cathodic photocurrent was observed under cathodic polarization, which generally results from the p-type character. We presumed that the cathodic photocurrent was due to the self-reduction of Ni species in Ni–Al LDH: from Ni2+ to Ni0 (E°(Ni2+/Ni) = −0.26 V vs. NHE (pH = 0))29 or from NiOOH to Ni(OH)2 (E°(NiOOH/Ni(OH)2) = 0.52 V vs. NHE (pH = 0)),29 because it can be estimated that Ni2+ incoporated into Ni–Al LDH was oxidized by the anodic applied potential during the electrophoresis method. Therefore, Mg–Al LDH did not show the cathodic photocurrent at that region. Moreover, the onset potential for the anodic photocurrent, based on the shape of the photocurrent profile during photoirradiation cycling, was estimated to be ca. −0.75 V vs. Ag/AgCl in this study.
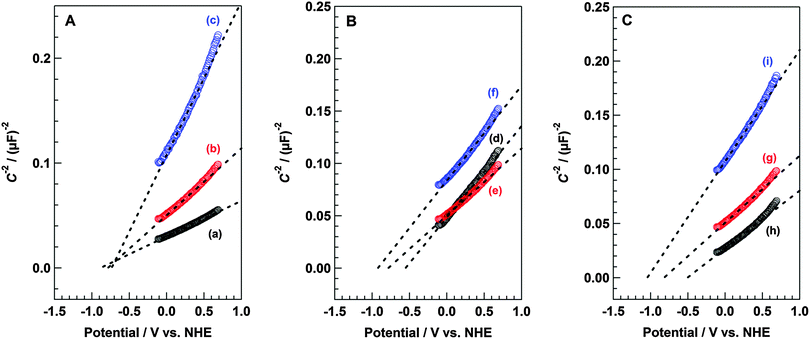
Fig. 6A–C show the Mott–Schottky plots of X LDH/FTO (X = Ni–Al, Mg–Al, Zn–Al, Ni–Ga, and Ni–In), TiO2/FTO, and Ta2O5/FTO based on the impedance measurements using these materials as working electrodes. As mentioned above, the flat band potential (EFB) can be determined by extrapolation to C−2 = 0 (C: capacitance), in accordance with the Mott–Schottky equation. When impedance measurements are conducted at variable frequencies, the fitted line for each Mott–Schottky plot should converge at EFB (C−2 = 0). In the case of Ni–Al LDH/FTO, the fitting lines of the Mott–Schottky plots for frequencies of 37.3, 52.0, and 72.0 kHz crossed at a point shifted from the x-axis intercept, as shown in Fig. 6A. Despite that, the EFB of Ni–Al LDH/FTO was estimated to range from −0.9 to −0.7 V vs. NHE (pH = 6.2). Moreover, the incline of the fitting line for the Mott–Schottky plot was positive (rightward inclining), indicating that the Ni–Al LDH shows n-type semiconductor-like properties,31 as we determined before from the photoelectrochemical measurements. Fig. 6B displays the Mott–Schottky plots of (d) TiO2/FTO, (e) Ni–Al LDH/FTO, and (f) Ta2O5/FTO, recorded using an aqueous Na2SO4 solution (pH = 6.2) as an electrolyte under 52.0 kHz of the alternating current frequency. From this result, the EFB of anatase TiO2 was considered to be −0.55 V vs. NHE, and the value of EFB matched with those of previous reports that described the energy position of the flat band for anatase TiO2.41,42 Similarly, the estimated value of EFB of Ta2O5 in this study was −0.92 V vs. NHE (pH = 6.2), similar to those reported in the previous literature.43 Compared to these reference samples, the position of EFB in Ni–Al LDH was between those of TiO2 and Ta2O5, and was determined to be −0.77 V vs. NHE (pH = 6.2). This value was slightly shifted from the onset potential obtained from the photocurrent observation by sweeping the applied bias (Fig. 5). Bolts et al. and Sprunken et al. have pointed out the dependence of the onset potential of photocurrent on experimental conditions such as surface coverage with reducible adsorbates, illumination intensity, wavelength, and pH of the electrolyte solution.44,45 Concerning the present study, the results of the impedance measurements in accordance with the Mott–Schottky equation were used to determine the value of EFB. Generally, the difference in the value of EFB for n-type metal oxide semiconductors is considered to be due to the metal components, which form the conduction band. The conduction band of TiO2 and Ta2O5 mainly comprise the Ti 3d and Ta 5d orbitals, respectively. As shown in Fig. 6C, a change in the estimated EFB value was found upon the substitution of metal species of hydroxide sheets within the LDH structure. The incorporation of Ga3+ or In3+ instead of Al3+ into the Ni–Al LDH for the formation of Ni–Ga LDH or Ni–In LDH clearly influenced the value of EFB, whereas the substitution of Ni2+ with Mg2+ or Zn2+ did not affect the value of EFB, as shown in Fig. S3 (ESI†). Based on these results, we conclude that the potential of the photogenerated electrons for a series of M2+–M3+ LDH group materials are regulated by M3+ species within the hydroxide sheets, rather than M2+ species. Moreover, the Mott–Schottky plot for Ni–Al LDH shifted to negative potential with increasing pH of the electrolyte solution in accordance with the Nernst equation (eqn (4)), as shown in Fig. S4 (ESI†).
Fig. 7 summarizes the results of the investigation of the electrochemical properties for X LDHs (X = Ni–Al, Mg–Al, Zn–Al, Ni–Ga, and Ni–In) and reference samples (TiO2 and Ta2O5). Unless otherwise noted, the units of potential in this paragraph are quoted vs. NHE (pH = 0). Because the Fermi level for electrons of n-type character materials is considered to merge with the lowest potential of the conduction band,30 the value of EFB obtained through the impedance measurements in this study is read as that of Ee for the LDH photocatalysts, and that of ECB for the TiO2 and Ta2O5 typical semiconductor photocatalysts. The value of energy gap (Eg) between Ee and Eh for a series of LDHs, and the band gap (EBG) between ECB and EVB for TiO2 and Ta2O5 were estimated from UV/vis diffuse reflectance spectra based on the Davis–Mott plot, as shown in Fig. S2 (ESI†). In addition, the potential of the top of the valence band (EVB) was calculated using the values of ECB and EBG. For the case of TiO2, ECB and EBG were estimated to be −0.19 eV and 3.4 eV, respectively. The value of ECB was adapted to that previously reported because −0.40 V vs. SCE (pH = 0) in the literature presented by Grätzel et al.42 must be converted to −0.16 V vs. NHE (pH = 0) in accordance with eqn (6). The EBG value determined in this study was slightly larger than the general value. For Ta2O5, the estimated values of ECB and EVB were, respectively, −0.56 V and 3.46 V, which are consistent with the results of electrochemical measurements in the literature reported by Domen and co-authors.43 Based on these results for the reference samples, we suggest that the electrochemical character of X LDH (X = Ni–Al, Mg–Al, Zn–Al, Ni–Ga, and Ni–In) photocatalysts is as follows. For Ni–Al LDH, which has been reported as a photocatalyst for the selective conversion of CO2 into CO in our previous studies,26,28Ee was −0.40 V, thereby satisfying the required potential for the reduction of CO2 to CO; however, it was not enough for the one-electron reduction of CO2 (E°(CO2/CO2˙−) ≈ −2.0 V vs. NHE).46 From this result, it can be inferred that the Ni–Al LDH photocatalyst might reduce CO2 into CO in a two-electron process. On the other hand, Eh of Ni–Al LDH was found to be 4.39 V, significantly more positive than the value of EVB for typical oxides such as TiO2 and Ta2O5. Our experimental results for electrochemical properties of LDH photocatalysts were not fully consistent with the results of the theoretical studies.35 As is often the case, the disagreement between experimental and theoretical results caused by the differences in limitations of the two approaches should be considered in the near future. However, this potential is sufficient to oxidize Cl− into Cl2, as shown in Fig. 7 (E°(Cl2/Cl−) = 1.39 V).29 We previously insisted that Cl− in the reaction solution can act as an effective hole scavenger for the photocatalytic conversion of CO2 in an aqueous solution and Cl− should be oxidized into Cl2, which is immediately converted into hypochlorous acid (HClO).28 By carrying out electrochemical investigations, we inferred that photogenerated electrons and holes in Ni–Al LDH are capable of reducing CO2 into CO and oxidizing Cl− into Cl2. The changes in the value of Eh were determined by substituting Ni2+ in Ni–Al LDH with Mg2+ or Zn2+, whereas the position of Ee was not influenced by the type of divalent metal (M2+) in M2+–Al LDH, as mentioned above. In contrast, the change of trivalent metal clearly affected the position of Ee; for example, the incorporation of In3+ shifted to a negative value compared to Al3+, while the Ee of Ni–Ga LDH was found to have a positive potential, similar to the value of ECB for TiO2. By considering thermodynamic aspects, the reduction of protons to H2 (E°(H+/H2) = 0.0 V),29 which competitively takes place in the photocatalytic conversion of CO2 in an aqueous media, is relatively favorable in comparison to the reduction of CO2 into CO (E°(CO2/CO) = −0.11 V)29,46 because of their reduction potentials. The overpotential of the photoexcited electron toward the reduction of CO2 into CO (ΔEOP) is presented in accordance with eqn (7), as shown below.
| ΔEOP = E°(CO2/CO) − Ee | (7) |
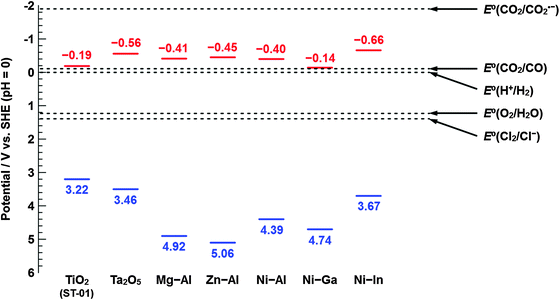 | ||
| Fig. 7 Summary of the investigation of the electrochemical properties of X LDHs (X = Ni–Al, Mg–Al, Zn–Al, Ni–Ga, and Ni–In), and references (TiO2 and Ta2O5). Standard potentials of redox couples are cited from the literature.29,45 Potentials of the photogenerated electron and hole are, respectively, presented in red and blue color. | ||
Conclusion
A series of LDHs (Ni–Al, Mg–Al, and Zn–Al LDH) were found to produce anodic photocurrent under no external bias, and the order of the initial photocurrent intensities were in accordance with the amount of electrons consumed in the photocatalytic conversion of CO2 in water using these LDH powder samples. Ni–Al LDH had electrochemical properties corresponding to n-type materials; that is, a cathodic dark current under cathodic polarization and an anodic photocurrent under anodic polarization were determined by electrochemical measurements. The value of Ee for the Ni–Al LDH photocatalyst was estimated to be −0.40 V vs. NHE (pH = 0), which is enough to induce the two-electron reduction of CO2 into CO. The change of M3+ metal in Ni–M3+ LDH clearly influenced Ee; Ee changed from negative to positive in the following order: Ni–In LDH, Ni–Al LDH, and Ni–Ga LDH. We concluded that the selectivity toward CO2 reduction and the inhibition of proton reduction to H2 are regulated not only by the overpotential of photogenerated electrons but also by the chemical properties of LDH photocatalysts.Abbreviations
| NHE | Normal hydrogen electrode |
| Ag/AgCl | Silver–silver chloride electrode |
| SCE | Standard calomel electrode |
| E CB | Bottom of the conduction band for semiconductors |
| E VB | Top of the valence band for semiconductors |
| E BG | Energy gap of the band structure for semiconductors |
| E FB | Flat band potential |
| E e | Potential of the photogenerated electron for a series of LDHs |
| E h | Potential of the photogenerated hole for a series of LDHs |
| E g | Energy gap for a series of LDHs |
| Z′′ | Imaginary component of the impedance |
| C | Capacitance |
| π | Circumference ratio |
| f | Frequency of the alternating current |
| A | Area of the electrode |
| N D | Number of carriers |
| E | Applied potential |
| k B | Boltzmann's constant |
| T | Absolute temperature |
| ε | Dielectric constant |
| ε 0 | Permittivity of free space |
| e | Electronic charge |
Acknowledgements
This study was partially supported by a Grant-in-Aid for Scientific Research on Innovative Areas “All Nippon Artificial Photosynthesis Project for Living Earth” (No. 2406) of the Ministry of Education, Culture, Sports, Science, and Technology (MEXT) of Japan, the Precursory Research for Embryonic Science and Technology (PRESTO), supported by the Japan Science and Technology Agency (JST), and the Program for Elements Strategy Initiative for Catalysts & Batteries (ESICB), commissioned by the MEXT of Japan. Shoji Iguchi thanks the JSPS Research Fellowships for Young Scientists.References
- F. Cavani, F. Trifirò and A. Vaccari, Catal. Today, 1991, 11, 173–301 CrossRef CAS.
- C. Delhoyo, Appl. Clay Sci., 2007, 36, 103–121 CrossRef CAS.
- B. F. Sels, D. E. De Vos and P. A. Jacobs, Catal. Rev., 2001, 43, 443–488 CAS.
- Y. Arishige, D. Kubo, K. Tadanaga, A. Hayashi and M. Tatsumisago, Solid State Ionics, 2014, 262, 238–240 CrossRef CAS.
- D. Kubo, K. Tadanaga, A. Hayashi and M. Tatsumisago, J. Electroanal. Chem., 2012, 671, 102–105 CrossRef CAS.
- D. Kubo, K. Tadanaga, A. Hayashi and M. Tatsumisago, J. Power Sources, 2013, 222, 493–497 CrossRef CAS.
- K. Tadanaga, Y. Furukawa, A. Hayashi and M. Tatsumisago, J. Electrochem. Soc., 2012, 159, B368–B370 CrossRef CAS.
- J. Fang, M. Li, Q. Li, W. Zhang, Q. Shou, F. Liu, X. Zhang and J. Cheng, Electrochim. Acta, 2012, 85, 248–255 CrossRef CAS.
- Z. Gao, J. Wang, Z. Li, W. Yang, B. Wang, M. Hou, Y. He, Q. Liu, T. Mann, P. Yang, M. Zhang and L. Liu, Chem. Mater., 2011, 23, 3509–3516 CrossRef CAS.
- A. Malak-Polaczyk, C. Vix-Guterl and E. Frackowiak, Energy Fuels, 2010, 24, 3346–3351 CrossRef CAS.
- T. Stimpfling and F. Leroux, Chem. Mater., 2010, 22, 974–987 CrossRef CAS.
- D. H. Youn, Y. B. Park, J. Y. Kim, G. Magesh, Y. J. Jang and J. S. Lee, J. Power Sources, 2015, 294, 437–443 CrossRef CAS.
- W. He, R. Wang, L. Zhang, J. Zhu, X. Xiang and F. Li, J. Mater. Chem. A, 2015, 3, 17977–17982 CAS.
- L. Mohapatra and K. M. Parida, Phys. Chem. Chem. Phys., 2014, 16, 16985–16996 RSC.
- L. Wang, F. Dionigi, N. T. Nguyen, R. Kirchgeorg, M. Gliech, S. Grigorescu, P. Strasser and P. Schmuki, Chem. Mater., 2015, 27, 2360–2366 CrossRef CAS.
- M. Shao, J. Han, M. Wei, D. G. Evans and X. Duan, Chem. Eng. J., 2011, 168, 519–524 CrossRef CAS.
- S. J. Xia, F. X. Liu, Z. M. Ni, J. L. Xue and P. P. Qian, J. Colloid Interface Sci., 2013, 405, 195–200 CrossRef CAS PubMed.
- J. S. Valente, F. Tzompantzi and J. Prince, Appl. Catal., B, 2011, 102, 276–285 CrossRef CAS.
- B. Li, Y. Zhao, S. Zhang, W. Gao and M. Wei, ACS Appl. Mater. Interfaces, 2013, 5, 10233–10239 CAS.
- Y. Zhao, P. Chen, B. Zhang, D. S. Su, S. Zhang, L. Tian, J. Lu, Z. Li, X. Cao, B. Wang, M. Wei, D. G. Evans and X. Duan, Chemistry, 2012, 18, 11949–11958 CrossRef CAS PubMed.
- C. G. Silva, Y. Bouizi, V. Fornés and H. García, J. Am. Chem. Soc., 2009, 131, 13833–13839 CrossRef PubMed.
- N. Ahmed, Y. Shibata, T. Taniguchi and Y. Izumi, J. Catal., 2011, 279, 123–135 CrossRef CAS.
- K.-I. Katsumata, K. Sakai, K. Ikeda, G. Carja, N. Matsushita and K. Okada, Mater. Lett., 2013, 107, 138–140 CrossRef CAS.
- M. Morikawa, N. Ahmed, Y. Yoshida and Y. Izumi, Appl. Catal., B, 2014, 144, 561–569 CrossRef CAS.
- M. Morikawa, Y. Ogura, N. Ahmed, S. Kawamura, G. Mikami, S. Okamoto and Y. Izumi, Catal. Sci. Technol., 2014, 4, 1644–1651 CAS.
- S. Iguchi, K. Teramura, S. Hosokawa and T. Tanaka, Catal. Today, 2015, 251, 140–144 CrossRef CAS.
- K. Teramura, S. Iguchi, Y. Mizuno, T. Shishido and T. Tanaka, Angew. Chem., Int. Ed., 2012, 51, 8008–8011 CrossRef CAS PubMed.
- S. Iguchi, K. Teramura, S. Hosokawa and T. Tanaka, Phys. Chem. Chem. Phys., 2015, 17, 17995–18003 RSC.
- Standard Potentials in Aqueous Solution, ed. A. J. Bard, R. Parsons and J. Jordan, Marcel Dekker, 1985 Search PubMed.
- R. Beranek, Adv. Phys. Chem., 2011, 2011, 1–20 CrossRef.
- A. W. Bott, Curr. Sep., 1998, 17, 87–91 CAS.
- L. L. K. Gelderman and S. W. Donne, J. Chem. Educ., 2007, 84, 685–688 CrossRef.
- W. G. F. Cardon, J. Phys. D: Appl. Phys., 1978, 11, L63–L67 CrossRef.
- W. J. Albery, G. J. O'Shea and A. L. Smith, J. Chem. Soc., Faraday Trans., 1996, 92, 4083–4085 RSC.
- S.-M. Xu, T. Pan, Y.-B. Dou, H. Yan, S.-T. Zhang, F.-Y. Ning, W.-Y. Shi and M. Wei, J. Phys. Chem. C, 2015, 119, 18823–18834 CAS.
- E. A. Davis and N. F. Mott, Philos. Mag., 1970, 22, 0903–0922 CrossRef CAS.
- R. G. Bates, Determination of pH: theory and practice, John Wiley & Sons, 1973 Search PubMed.
- D. T. Sawyer, A. Sobkowiak and J. L. Roberts, Electrochemistry for Chemists, Wiley, 1995 Search PubMed.
- J. Zhang, X. Xie, C. Li, H. Wang and L. Wang, RSC Adv., 2015, 5, 29757–29765 RSC.
- L. N. Elaziouti and B. Ahmed, J. Chem. Eng. Process Technol., 2011, 2, 106 Search PubMed.
- L. Kavan, M. Grätzel, S. E. Gilbert, C. Klemenz and H. J. Scheel, J. Am. Chem. Soc., 1996, 118, 6716–6723 CrossRef CAS.
- G. Rothenberger, D. Fitzmaurice and M. Grätzel, J. Phys. Chem., 1992, 96, 5983–5986 CrossRef CAS.
- W.-J. Chun, A. Ishikawa, H. Fujisawa, T. Takata, J. N. Kondo, M. Hara, M. Kawai, Y. Matsumoto and K. Domen, J. Phys. Chem. B, 2003, 107, 1798–1803 CrossRef CAS.
- J. M. Bolts and M. S. Wrighton, J. Phys. Chem., 1976, 80, 2641–2645 CrossRef CAS.
- H. R. Sprunken, R. Schumacher and R. N. Schindler, Faraday Discuss. Chem. Soc., 1980, 70, 55–66 RSC.
- J.-M. Lehn and R. Ziessel, Proc. Natl. Acad. Sci. U. S. A., 1982, 79, 701–704 CrossRef CAS.
Footnote |
| † Electronic supplementary information (ESI) available. See DOI: 10.1039/c6cp01646d |
| This journal is © the Owner Societies 2016 |

