
 Open Access Article
 This Open Access Article is licensed under a
 Creative Commons Attribution 3.0 Unported Licence
Extreme population inversion in the fragments formed by UV photoinduced S–H bond fission in 2-thiophenethiol†
Rebecca A.
Ingle
a,
Tolga N. V.
Karsili
a,
Gregg J.
Dennis
a,
Michael
Staniforth
b,
Vasilios G.
Stavros
b and
Michael N. R.
Ashfold
*a
aSchool of Chemistry, University of Bristol, Cantock's Close, Bristol, UK BS8 1TS. E-mail: mike.ashfold@bris.ac.uk; Fax: +44 117 925 0612; Tel: +44 117 928 8312
bDepartment of Chemistry, University of Warwick, Library Road, Coventry, UK CV4 7AL
First published on 24th March 2016
Abstract
H atom loss following near ultraviolet photoexcitation of gas phase 2-thiophenethiol molecules has been studied experimentally, by photofragment translational spectroscopy (PTS) methods, and computationally, by ab initio electronic structure calculations. The long wavelength (277.5 ≥ λphot ≥ 240 nm) PTS data are consistent with S–H bond fission after population of the first 1πσ* state. The partner thiophenethiyl (R) radicals are formed predominantly in their first excited Ã2A′ state, but assignment of a weak signal attributable to H + R(![[X with combining tilde]](https://www.rsc.org/images/entities/char_0058_0303.gif) 2A′′) products allows determination of the S–H bond strength, D0 = 27
2A′′) products allows determination of the S–H bond strength, D0 = 27![[thin space (1/6-em)]](https://www.rsc.org/images/entities/char_2009.gif) 800 ± 100 cm−1 and the Ö state splitting in the thiophenethiyl radical (ΔE = 3580 ± 100 cm−1). The deduced population inversion between the à and states of the radical reflects the non-planar ground state geometry (wherein the S–H bond is directed near orthogonal to the ring plane) which, post-photoexcitation, is unable to planarise sufficiently prior to bond fission. This dictates that the dissociating molecules follow the adiabatic fragmentation pathway to electronically excited radical products. π* ← π absorption dominates at shorter excitation wavelengths. Coupling to the same 1πσ* potential energy surface (PES) remains the dominant dissociation route, but a minor yield of H atoms attributable to a rival fragmentation pathway is identified. These products are deduced to arise via unimolecular decay following internal conversion to the ground (S0) state PES via a conical intersection accessed by intra-ring C–S bond extension. The measured translational energy disposal shows a more striking change once λphot ≤ 220 nm. Once again, however, the dominant decay pathway is deduced to be S–H bond fission following coupling to the 1πσ* PES but, in this case, many of the evolving molecules are deduced to have sufficiently near-planar geometries to allow passage through the conical intersection at extended S–H bond lengths and dissociation to ground () state radical products. The present data provide no definitive evidence that complete ring opening can compete with fast S–H bond fission following near UV photoexcitation of 2-thiophenethiol.
800 ± 100 cm−1 and the Ö state splitting in the thiophenethiyl radical (ΔE = 3580 ± 100 cm−1). The deduced population inversion between the à and states of the radical reflects the non-planar ground state geometry (wherein the S–H bond is directed near orthogonal to the ring plane) which, post-photoexcitation, is unable to planarise sufficiently prior to bond fission. This dictates that the dissociating molecules follow the adiabatic fragmentation pathway to electronically excited radical products. π* ← π absorption dominates at shorter excitation wavelengths. Coupling to the same 1πσ* potential energy surface (PES) remains the dominant dissociation route, but a minor yield of H atoms attributable to a rival fragmentation pathway is identified. These products are deduced to arise via unimolecular decay following internal conversion to the ground (S0) state PES via a conical intersection accessed by intra-ring C–S bond extension. The measured translational energy disposal shows a more striking change once λphot ≤ 220 nm. Once again, however, the dominant decay pathway is deduced to be S–H bond fission following coupling to the 1πσ* PES but, in this case, many of the evolving molecules are deduced to have sufficiently near-planar geometries to allow passage through the conical intersection at extended S–H bond lengths and dissociation to ground () state radical products. The present data provide no definitive evidence that complete ring opening can compete with fast S–H bond fission following near UV photoexcitation of 2-thiophenethiol.
1 Introduction
Many recent studies have illustrated the importance of X–Y (X = O, S, etc., Y = H, CH3, etc.) bond fission following near UV excitation of (thio)phenols1–17 and (thio)anisoles,18–29 in the gas phase. The translational energy distributions of the resulting photofragments generally peak at energies well above zero, consistent with dissociation on an excited state potential energy surface (PES) that is repulsive with respect to X–Y bond extension. Such excited states are formed by electron promotion from one of the highest occupied molecular orbitals (typically a non-bonding (n) orbital centred on the heteroatom or a delocalised π bonding orbital) to an anti-bonding σ* orbital centred around the X–Y bond. For compactness, these latter states are henceforth simply termed πσ* excited states and the narrative will focus solely on singlet states of the molecule.In many cases, the first πσ* PES in these molecules shows a shallow minimum in the Franck–Condon region, due to Rydberg/valence mixing.19,30 In the planar limit, the ground (S0) state correlates diabatically with a Y atom/radical together with the X-containing radical (henceforth R) in its first excited (Ã) electronic state upon X–Y bond extension, while the πσ* PES correlates with the ground () state of the radical. In a simple orbital picture, the and à states of R are distinguished by whether the odd electron is in, respectively, a px or py orbital of the heteroatom, and their relative energies reflect the conjugation (or not) of this odd electron with the π system of the ring. The πσ* and S0 PESs thus display a conical intersection (CI) at extended X–Y bond lengths, RX–Y. Molecules approaching this CI on the πσ* PES at non-planar geometries tend to follow the adiabatic path and form electronically excited radical products. Non-adiabatic coupling probabilities are much higher at near-planar geometries, and molecules on the πσ* PES approaching the CI tend to follow the diabatic path and dissociate to state radical products. The branching between the à and states of R thus constitutes a sensitive probe of the excited state geometry during X–Y bond extension.27
π* ← π absorption in molecules of this type typically lie at similar energies to the σ* ← π excitations discussed above, and typically have larger cross-sections. Thus the relative probability of exciting a π* ← π or σ* ← π transition is likely to be wavelength dependent. In a diabatic picture, the ππ* excited state is bound with respect to extending RX–Y. Nonetheless, molecules excited to the ππ* state typically still undergo X–Y bond fission, by radiationless transfer mediated by a CI between the ππ* and πσ* PESs at shorter RX–Y. Henceforth, we will use the labels CI-1 and CI-2 to distinguish the ππ*/πσ* and πσ*/S0 CIs respectively.
The present study focuses on the near UV photochemistry of 2-thiophenethiol (Fig. 1), which offers a test-bed for exploring photoinduced fission of an S–H bond attached to an alternative aromatic ring using a combination of photofragment translational spectroscopy (PTS) and ab initio electronic structure methods. It also offers an opportunity to revisit conclusions reached in an earlier study of the photodissociation dynamics of a related heterocycle, 2-methyl-3-furanthiol.31 S–H bond fission on the πσ* PES is shown to be a major H atom formation channel at all wavelengths studied, but we appreciate that other fragmentation pathways may also be active. For example, an early PTS study following 193 nm excitation of thiophenol found evidence of a competing C–S bond cleavage pathway, yielding C6H5 + SH products,32 although the present study is blind to any such products. 2-thiophenethiol also has intra-ring C–S bonds. Recent theoretical and/or experimental studies of bare thiophene,33–35 thiophenone36 and 2-bromo- and 2-iodothiophene37 have all identified photoinduced C–S bond extension as a route to accessing a low energy CI with the ground state PES and subsequent ring opening. The present study suggests the operation of a similar ring-expansion driven radiationless transfer to the S0 PES in 2-thiophenethiol, and unimolecular decay yielding slow H atoms, but is unable to unequivocally confirm parent ring-opening.
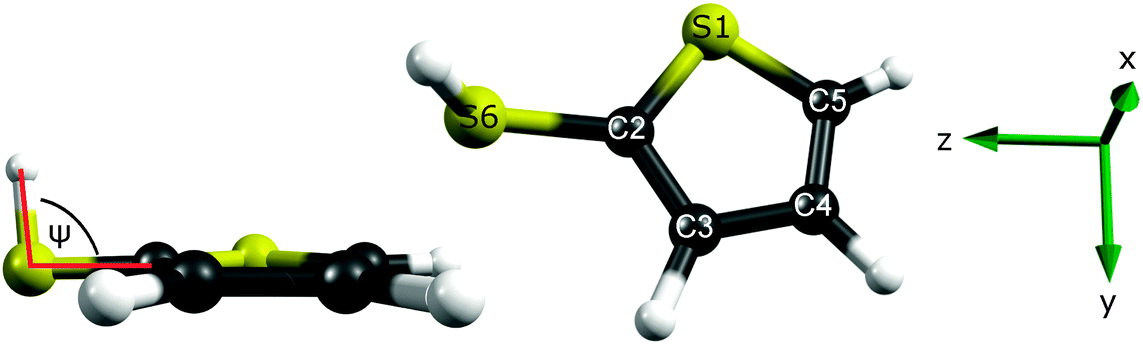 | ||
| Fig. 1 Optimised ground state geometry of 2-thiophenethiol, calculated at the MP2/aug(S)-AVTZ level of theory, with the heavy atoms numbered for future reference. The coordinate system used in this work is shown on the right, with x perpendicular to the ring plane and the dihedral angle (ψ) used in the torsional scans illustrated on the left. | ||
2 Methodology
2.1 Experimental
The H Rydberg atom (HRA)-PTS experiment has been described previously,38,39 so only a summary and details of some recent experimental upgrades will be given here. 2-thiophenethiol (≥90% purity, Sigma Aldrich) was used without further purification. The sample was heated to ≈50 °C and the resulting vapour then supersonically expanded in ≈400 mbar of argon seed gas (BOC Gases, CP grade) to form the pulsed molecular beam (10 Hz). The molecular beam was intersected with a tunable UV photolysis pulse generated by frequency-doubling the output of a Nd-YAG pumped dye laser (208 nm ≤ λphot ≤ 277.5 nm). 277.5 nm was the longest photolysis wavelength at which measurable H atom signal was detected. H atom photoproducts formed in the interaction region were then excited to high-lying (n ≈ 80) Rydberg states using a double-resonant process involving 121.6 nm (Lyman-α) and 366 nm laser pulses both delayed with respect to the photolysis pulse by δt ≈ 10 ns. H atom photoproducts formed with recoil velocities aligned with the detection axis travel through a field- and collision-free time-of-flight (TOF) region prior to passing through a grounded mesh positioned ≈1 cm in front of a new microchannel plate (MCP) detector. The total flight length (d) from the interaction region with the new detector arrangement is 0.605 m. Product recoil anisotropy parameters (β) were estimated by comparing TOF spectra recorded with the polarisation vector of the photolysis laser, εphot, aligned at θ = 0°, 54.7° and 90° to the TOF axis.The apparatus and procedures for the time-resolved velocity map ion imaging (TR-VMI) experiments have also been detailed elsewhere.1,40,41 The 2-thiophenethiol sample was introduced into the spectrometer using an Even-Lavie pulsed solenoid valve operating at a 125 Hz repetition rate with a typical opening time of 14 μs,42 seeded in 2 bar of He. The 800 nm output of a Ti:sapphire oscillator and regenerative amplifier system was used to pump two optical parametric amplifiers to generate UV pump (235 nm ≤ λphot ≤ 260 nm) and probe (243.1 nm) pulses. We also extended the wavelength of our pump to 200 nm (≈1 μJ per pulse), by frequency mixing in a series of type-I and type-II β-barium borate crystals. The temporal delay between the pump and probe pulses was user variable out to δt ≈ 1.2 ns. H atom photofragments formed in the interaction region were ionised by the probe pulse via (2 + 1) resonance-enhanced multiphoton ionisation at 243.1 nm. Velocity map images of H+ ions were recorded using a pair of MCPs coupled to a P-43 phosphor screen with a CCD camera and the 3-D distributions reconstructed from the crushed ion images using the polar onion-peeling (POP) algorithm.43 The instrument response function (IRF) was characterised by the non-resonant multiphoton ionisation of methanol, yielding an IRF of ≈120 fs at λphot ≥ 238 nm or ≈150 fs at 200 nm.
2.2 Theoretical
The ground state geometry of 2-thiophenethiol was optimised using MP2/aug(S)-AVTZ, where AVTZ = aug-cc-pV(T+d)Z,44,45 with extra even tempered sets of s and p diffuse functions and additional d polarisation functions located on both sulfur atoms. A torsional scan was performed by fixing the C3C2S6H dihedral angle ψ and optimising the rest of the nuclear framework with MP2/aug(S)-AVTZ. Single-point energies were then calculated for these optimised geometries using CCSD(T)(F12*)/aug(S)-AVTZ.46Two independent sets of potential energy profiles were scanned along RS6–H and RC2–S1 (henceforth simply RS–H and RC–S) in order to assess the competition between S–H bond fission and C–S ring-expansion upon photoexcitation. As before,37 scans along the latter coordinate were undertaken by progressively elongating RC–S from its equilibrium value and allowing the remainder of the nuclear geometry to relax with MP2/cc-pVDZ, whereas those along RS–H were rigid-body (unrelaxed) and based on the ground state MP2/cc-pVDZ minimum energy geometry. At each geometry along RC–S and RS–H, energies for the ground and first three singlet excited states were computed using complete active space with second order perturbation theory (CASPT2) based on a state-averaged complete active space self-consistent field reference wavefunction (SA-CASSCF) alongside a cc-pVDZ basis set. In constructing the potential energy profiles, careful testing of the basis set and SA-CASSCF showed that (i) augmentation of the basis set was unnecessary due to the weak Rydberg/valence mixing and (ii) the CASSCF reference wavefunctions required SA4 and SA5, for scans along RC–S and RS–H, respectively. The active space comprised ten electrons distributed in eight orbitals (see ESI† for orbital depictions). In order to access the S1 minimum energy path (MEP) along RC–S, the adiabatic S1 relaxed path was calculated using the second-order algebraic diagrammatic construction (ADC(2)) method alongside a cc-pVDZ basis set. The resolution of identity (RI) formalism was used in order to compute the electron repulsion integrals. The energies at the returned relaxed geometries were then recalculated with CASPT2.
Oscillator strengths between initial state i and final states j (fij) were calculated using eqn (1).
 | (1) |
Density functional Theory (DFT) was used to compute the anharmonic normal mode wavenumbers of the thiophenethiyl radical and to identify isomers of 2-thiophenethiol and possible dissociation products. The isomers were optimised at the DFT/B3LYP/6-31G(d) level of theory, with single point energy corrections carried out using the larger 6-311+G(d,p) basis set. Potential transition states between parent isomers on the S0 PES were optimised using the Synchronous Transit-Guided Quasi-Newton Method using the DFT/B3LYP/6-31G(d) level of theory and the various isomers as structural guesses. Anharmonic normal mode vibrational wavenumbers for the ground state R radical were calculated using DFT/B3LYP/6-311G(d,p).
The MP2/aug(S)-AVTZ, CCSD(T)(F12)* and CASSCF/CASPT2 calculations were calculated in Molpro 2010.1,47 the MP2/cc-pVDZ and DFT calculations in Gaussian 0948 and the ADC(2) calculations in Turbomole.49
3 Results and discussion
3.1 Parent molecule spectroscopy
Fig. 2 shows the UV absorption spectrum of a room temperature gas phase sample of 2-thiophenethiol over the range 200 ≤ λphot ≤ 310 nm. This absorption profile can be rationalised by reference to Table 1, which lists the vertical excitation energies and oscillator strengths calculated using CASPT2 and CASSCF, and the various potential energy cuts (PECs) presented later in the paper. The broad, intense feature that plateaus at ≈230 nm is most plausibly attributed to the second ring-centred π* ← π transition, with the predicted 11ππ* ← S0 and 11πσ* ← S0 excitations contributing to the weaker tail extending to longer wavelengths.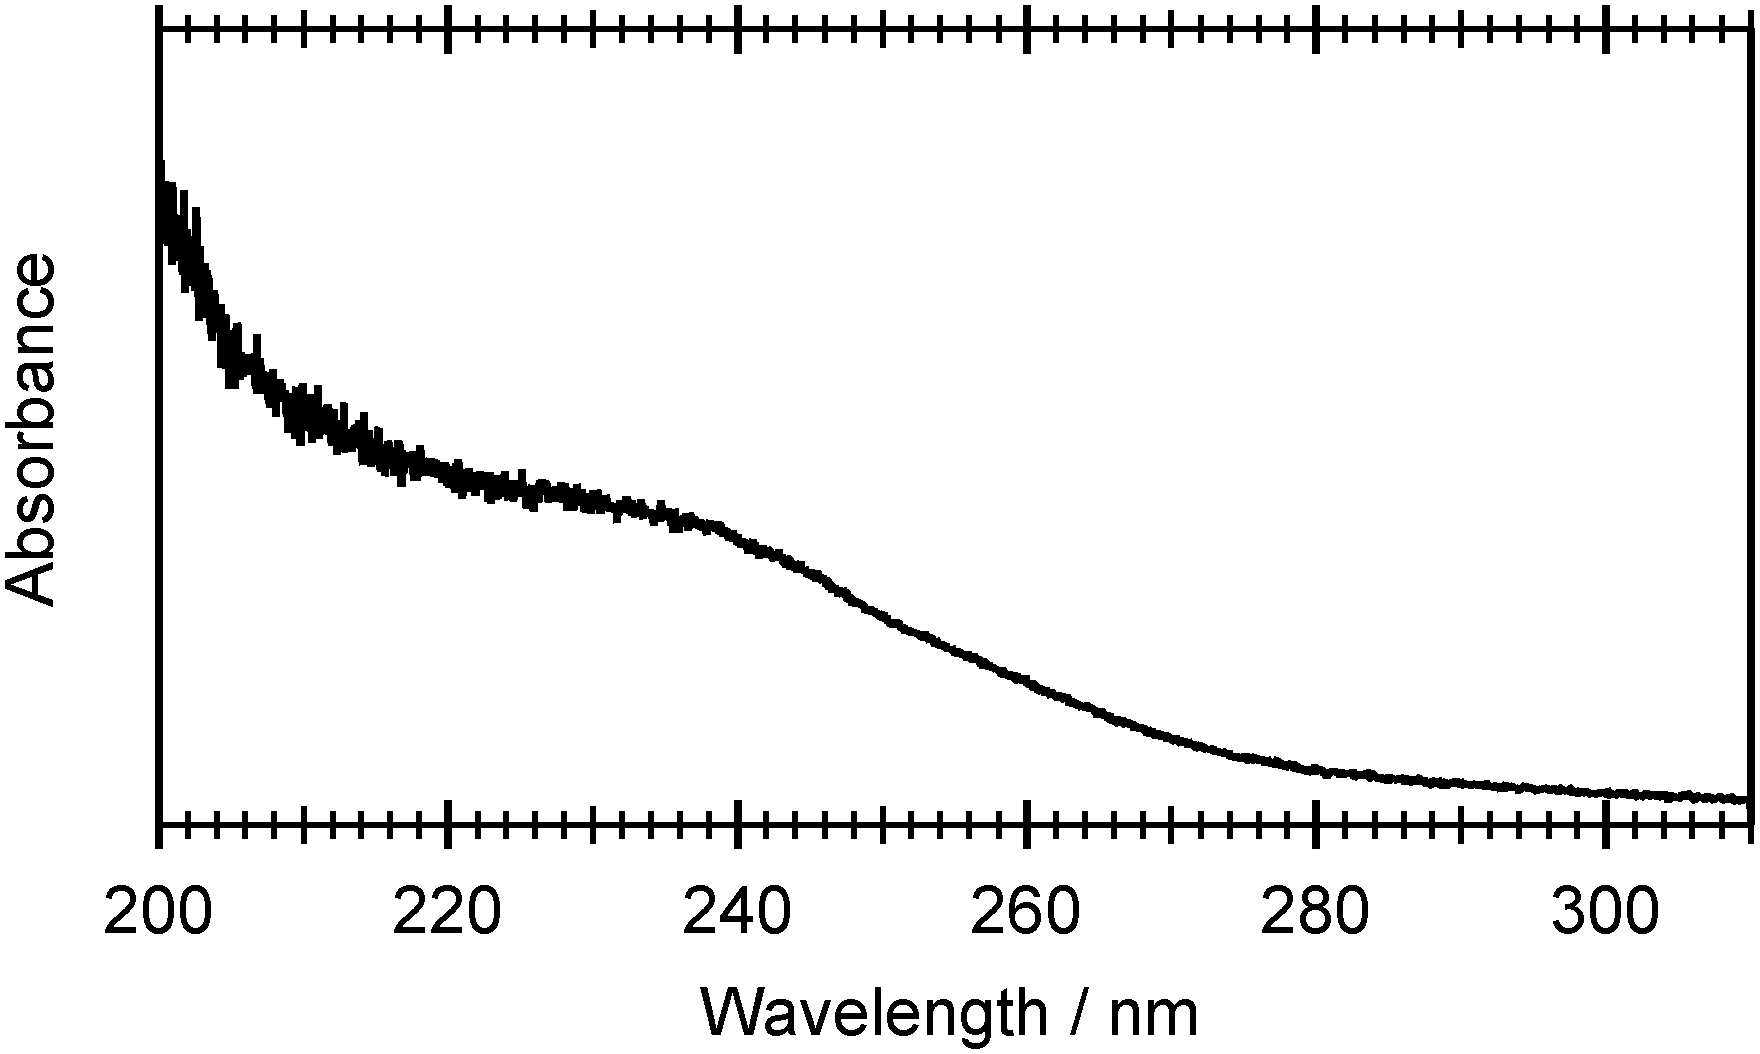 | ||
| Fig. 2 UV absorption spectrum of room temperature, gas phase 2-thiophenethiol recorded over the wavelength range 200 ≤ λphot ≤ 310 nm. | ||
| Transition | Energy/eV | f | Transition dipole moment/a.u. | Transition character | ||
|---|---|---|---|---|---|---|
| μ x | μ y | μ z | ||||
| S1 ← S0 | 5.49 | 0.024 | 0.013 | −0.395 | −0.081 | 1ππ* |
| S2 ← S0 | 5.51 | 0.004 | −0.002 | 0.033 | 0.165 | 1πσ* (S–H) |
| S3 ← S0 | 5.55 | 0.365 | 0.185 | −0.115 | 1.399 | 1ππ* |
| S4 ← S0 | 6.49 | 0.001 | 0.081 | −0.010 | 0.007 | 1πσ* (C–S) |
Fig. 3 shows the calculated cut through the ground state potential of 2-thiophenethiol, along ψ. The optimised ground state geometry involves a planar heavy atom structure, with the S–H bond directed at ψ = 80° to the ring plane. This can be understood by recognising that the S1 atom is sp2 hybridised and thus has a partial positive charge as its lone pair is delocalised around the ring. This renders the 2- and 3-positions nucleophilic. As SH is a weak π donor, planar (ψ = 0° or 180°) configurations would involve unfavourable electrostatic interactions between the 3px orbital on S6 and the ring π system. A ψ = 80° configuration both precludes this destabilising interaction and allows the σ* orbital around the S6–H bond to accept the electron density at the 2-position. Fig. 3 suggests that the torsional barrier in the ground state is ≈600–700 cm−1.
 | ||
| Fig. 3 Torsional scan along the C3C2S6H dihedral angle ψ, performed by fixing the dihedral angle at 15° increments and optimising the rest of the nuclear framework using MP2/aug(S)-AVTZ. These points were then subsequently energy corrected using CCSD(T)(F12*)/aug(S)-AVTZ. | ||
3.2 HRA-PTS studies
Fig. 4 shows the total kinetic energy release (TKER) spectra derived from H atom TOF spectra measured at several different photolysis wavelengths in the range 239 ≤ λphot ≤ 277.5 nm. TKER distributions were derived using eqn (2).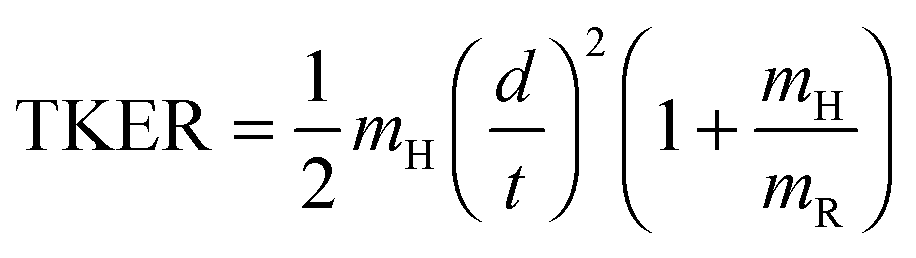 | (2) |
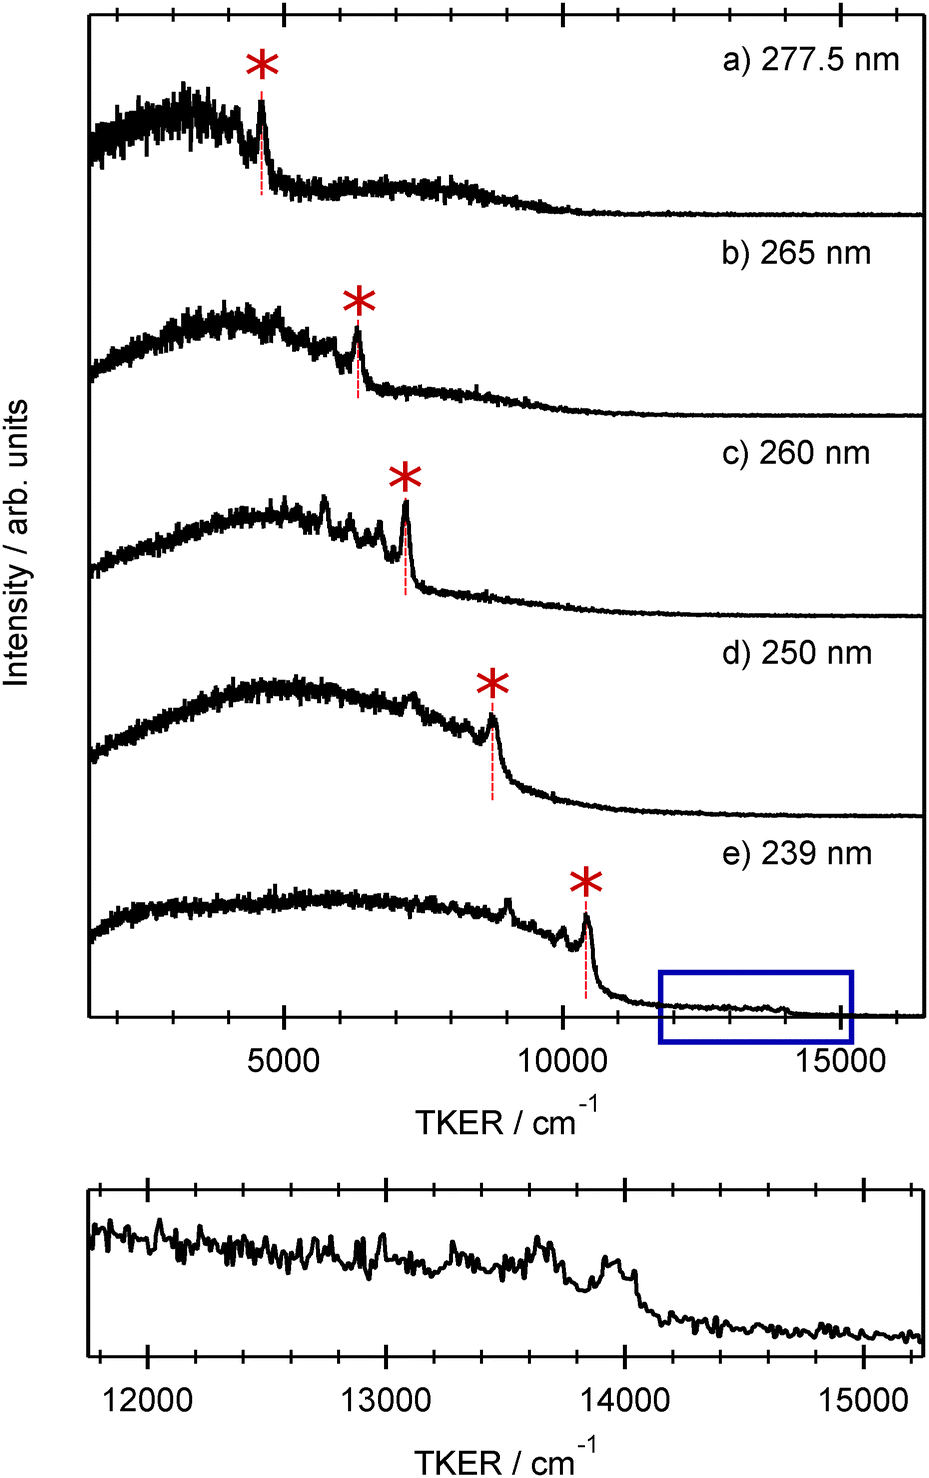 | ||
| Fig. 4 TKER spectra derived from H atom TOF spectra recorded following photodissociation of 2-thiophenethiol at λphot = (a) 277.5, (b) 265, (c) 260, (d) 250 and (e) 239 nm. The peak assigned to H + R(Ã, v = 0) products in each spectrum is indicated by the asterisk. The panel below shows an expanded view of the weak high TKER feature evident in panel (e). | ||
Each spectrum shows a relatively clear onset at high TKER but also extends to near zero kinetic energies, implying that some of the co-fragments are formed highly internally excited. The TKER associated with the high energy ‘peak’ in each spectrum, starred in Fig. 4, increases linearly with increasing photolysis energy. We start by associating this peak with formation of co-fragments in their zero-point (v = 0) vibrational level. Energy conservation arguments then allow us to estimate an S–H bond dissociation energy D0(R–H) ≈ 31550 cm−1. This implied bond strength is significantly higher than that determined for bare thiophenol and several substituted thiophenols, but similar to previously determined threshold energies for forming electronically excited (i.e. Ã state) thiophenoxyl radicals.31 This encouraged more careful scrutiny of the measured TKER spectra, several of which do show a weak pedestal at TKERs extended beyond the starred feature. The bottom panel in Fig. 4, which shows an expanded view of this high energy region in the 239 nm data, reveals a weak step comprising a fast peak at TKER ≈ 13950 cm−1 and extending to lower TKER. The energy spacing between this feature and the starred feature in Fig. 4(e) is 3580 ± 100 cm−1. Associating this faster onset with the formation of H + R(, v = 0) fragments returns a bond dissociation energy D0(R–H) = 27800 ± 100 cm−1 that is sensibly consistent with documented S–H bond strengths in other aromatic thiols.50
This analysis implies a near total population inversion between the Ã2A′ and 2A′′ electronic states of the radical co-fragment. Such dramatic branching between the electronic states of a photoproduct is not without precedent: the thiophenoxyl products formed by UV photolysis of thioanisole and various substituted thioanisoles are mostly formed in their excited (Ã) electronic state.27 This has been explained by considering the forces acting on the thioanisole molecules as they evolve on the πσ* PES. The πσ* PES in this case is accessed by radiationless transfer following photoexcitation to the 11ππ* state. This transfer is facilitated by out-of-plane distortions that persist as RS–CH3 extends towards values associated with CI-2. Being non-planar in this region ensures that the molecules follow the adiabatic dissociation path, and electronically excited thiophenoxyl radical products are the inevitable result.
Most of the spectra in Fig. 4 show one or more peaks at TKER values just below TKERmax. These are most plausibly attributed to population of specific vibrational levels of the R(Ã) co-fragment. The more prominent intervals observed in two or more spectra lie ≈470, ≈1000 and ≈1450 cm−1 below the TKERmax peak. Comparing these intervals with calculated anharmonic wavenumbers for the various vibrational fundamentals of the R() radical – listed in the ESI† – suggests preferential population of levels carrying one quantum of ν14, ν10 and ν4. All three are in-plane ring-breathing modes, the wavenumbers for which are expected to be similar in the and à states of the radical. Population of such modes can most readily be understood on Franck–Condon grounds given the change in the ring π-bonding during the initial parent photo-excitation step and in the subsequent evolution to R(Ã) fragments.
Angular anisotropy measurements at λphot = 270 and 240 nm both showed a higher relative yield of faster H atoms (e.g. products with TKER > 3000 cm−1) when εphot was aligned perpendicular to the TOF axis (i.e. at θ = 90°). Here, we estimate a β value of about −0.5. Recalling Fig. 2, it is likely that the dominant excitation changes from some mix of σ* ← π and π* ← π excitations (at 270 nm) to predominantly 21ππ* ← S0 across this wavelength range but, as Table 1 shows, all three transition dipole moments are calculated to lie predominantly in the ring plane, and thus near perpendicular to the S6–H bond. The observed recoil anisotropy follows naturally in the limit of prompt dissociation and near axial H atom recoil.
The foregoing discussion also accords with the observed electronic branching in the R products. Fig. 5 shows two sets of PECs for the ground and first few excited singlet states of 2-thiophenethiol along RS–H. The solid curves are calculated with ψ = 80° (the ground state equilibrium geometry), while those shown by dashed lines are for ψ = 0°. In both cases, ψ is clamped and the S6–H bond incremented with the remainder of the nuclear framework held fixed at the ground state equilibrium geometry. Fig. 5 reiterates the similar vertical excitation energies of the S1 and S2 states (recall Table 1) and illustrates the expected CI between the 1πσ* and S0 PECs at RS–H ≈ 2.6 Å and ψ = 0° (the analogue of CI-2 in the thiophenols). It also highlights the preferred planar geometry of molecules in the 1πσ* excited state. The observed product branching and recoil anisotropy both imply that, following UV photoexcitation, RS–H in the dissociating molecules must extend beyond that required for radiationless transfer through CI-2, before the S6–H bond rotates into the ring plane. As such, the photoexcited molecules follow the adiabatic path towards dissociation to yield H + R(Ã) products.
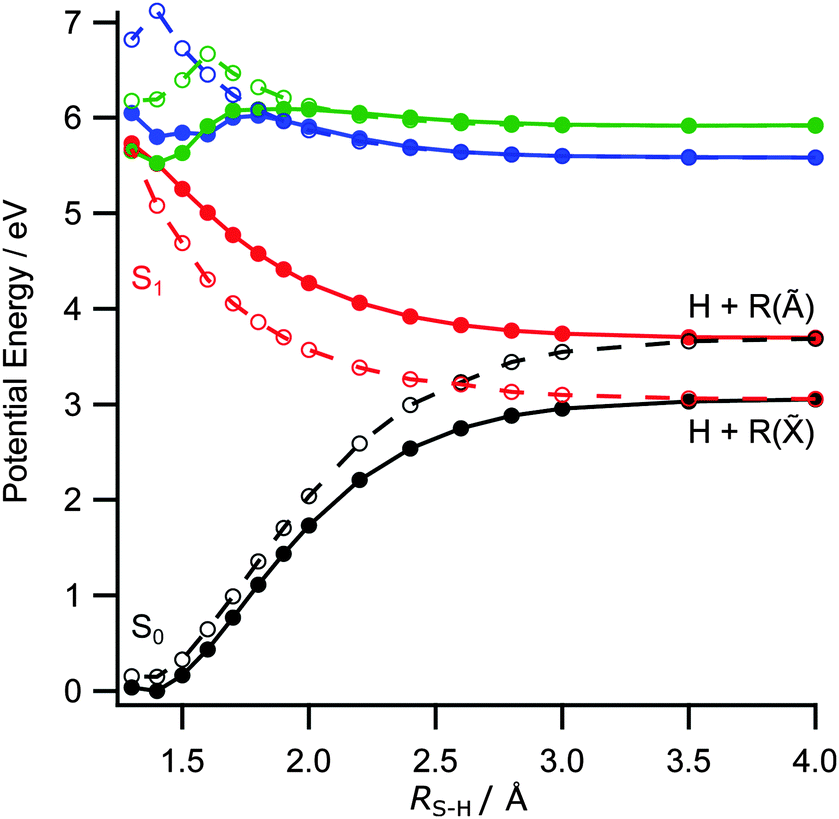 | ||
| Fig. 5 Unrelaxed PECs along RS–H calculated at the CASPT2(10,8)/cc-pVDZ level for the ground and first three singlet excited states for 2-thiophenethiol with ψ = 80° (filled circles and solid lines) and ψ = 0° (open circles and dashed lines). | ||
TKER spectra derived from H atom TOF spectra measured at several shorter wavelengths in the range 208.5 ≤ λphot ≤ 230 nm are shown in Fig. 6. The 230 and 225 nm data are sensibly consistent with that obtained at longer photolysis wavelengths, with an obvious fast peak (starred) that we associate with formation of R(Ã, v = 0) products. The TKER spectrum obtained at 220 nm (Fig. 6(c)) shows several noteworthy differences. The H + R(Ã, v = 0) peak is no longer evident (its expected position is indicated by the star), and the relative yield of slower products is increased. Of greater significance, however, the TKER spectrum shows clear signal out to that associated with formation of H + R(, v = 0) products. Measurements with εphot aligned at θ = 0°, 54.7° and 90° suggest that these fast products have negligible recoil anisotropy (β ≈ 0). The data obtained at 208 nm shows some similarities – the relative yield of slow products is clearly increased, and an isotropic signal is still evident at TKERs greater than that expected for H + R(Ã, v = 0) products – but also some differences – most notably the minimum at TKER ≈7000 cm−1. We chose to consider the additional insights provided by the TR-VMI studies before presenting a plausible rationale for the λphot dependence of these TKER spectra.
 | ||
| Fig. 6 TKER spectra derived from H atom TOF spectra measured following the photodissociation of 2-thiophenethiol at λphot = (a) 230, (b) 225, (c) 220 and (d) 208.5 nm. The star shows the TKER expected for H + R(Ã, v = 0) products at each excitation wavelength. | ||
3.3 Time-resolved velocity map imaging
Fig. 7 shows images of the H atom fragments (monitored via the H+ ion) resulting from photolysis of 2-thiophenethiol at (a) 260, (b) 238 and (c) 200 nm, measured at δt = 500 fs. The left half of each image shows the recorded H+ ion image, the right half shows a slice through the centre of the reconstructed 3-D ion distribution, and the white arrow indicates the alignment of εphot. The TKER spectra derived from these images, and from corresponding images measured at a longer pump–probe time delay (δt = 50 ps) are shown alongside. Again, we have assumed that the co-fragments partnering the observed H atoms have mR = 115.20 u. Though of lower energy resolution, the overall appearance of the TKER spectra obtained by TR-VMI are reassuringly consistent with those derived from HRA-PTS measurements at comparable photolysis wavelengths. The 260 nm image is obviously anisotropic, and well described by β = −0.5. The higher TKER component of the 238 nm image also shows preferential perpendicular recoil (β ≈ −0.25), while the signal at lower TKER appears isotropic. The images recorded at 200 nm are essentially isotropic.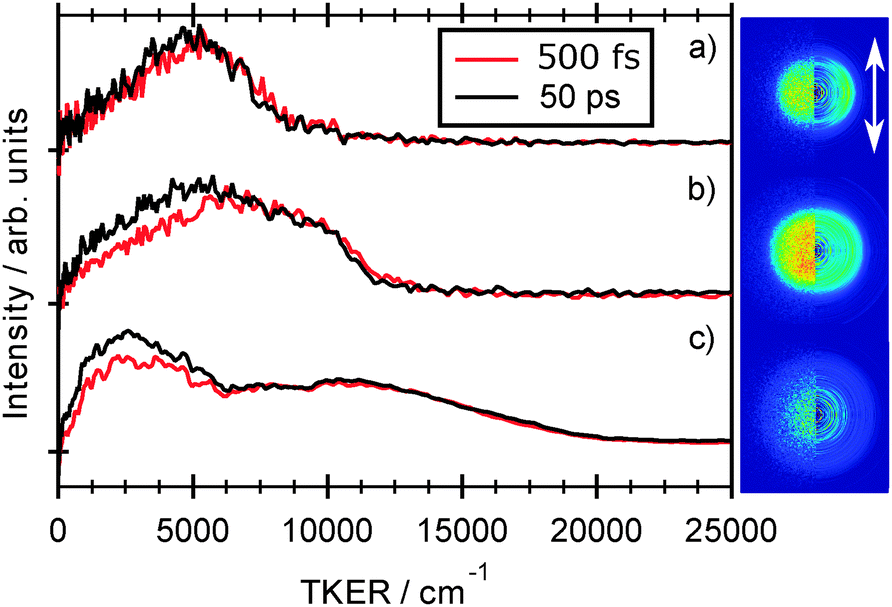 | ||
| Fig. 7 Raw image and 2-D slice through the reconstructed velocity distribution (left and right half images, respectively) of the H atom fragments resulting from photolysis of 2-thiophenethiol at (a) 260, (b) 238 and (c) 200 nm recorded at δt = 500 fs delay time. The double headed arrow indicates the alignment of εphot. TKER distributions derived from images recorded at δt = 500 fs and 50 ps are shown alongside. Given the poorer signal to noise ratio of the 200 nm image, the TKER spectra in Fig. 7(c) have been subjected to a 15-point smoothing prior to display. | ||
The general form of each TKER spectrum is evident by δt = 500 fs. Further changes out to δt = 50 ps appear relatively modest, but the relative yield of low TKER products formed at both 238 nm and 200 nm clearly increase with increasing delay. This statement can be placed on a more quantitative footing by fitting the δt dependence of selected parts of the TKER signals obtained at each wavelength. Fig. 8 shows the early time part of three such plots for products formed by (a) photolysis at 260 nm with TKERs in the range 0–8000 cm−1, and by 238 nm photolysis with TKERs in the range (b) 6000–11000 cm−1 and (c) 0–5000 cm−1. As in previous work,41 these transients were modelled using a combination of exponential rise and decay functions, convoluted with the IRF. Further details are included in the ESI,† in addition to an explanation of the apparent reverse dynamics. Fig. 8 shows the overall and component fits from which we obtained rise time constants τ260 = 133 ± 24 fs, τ238,fast = 124 ± 17 fs and, from fitting the full data set out to δt = 50 ps, τ238,slow = 1.2 ± 0.15 ps, where fast and slow correspond to signal in the respective TKER ranges, (b) and (c), defined above. Similar analysis for the 200 nm data gives time constants, τ200,fast = 71 ± 17 fs, within the IRF, and τ200,slow = 4.7 ± 1.3 ps.
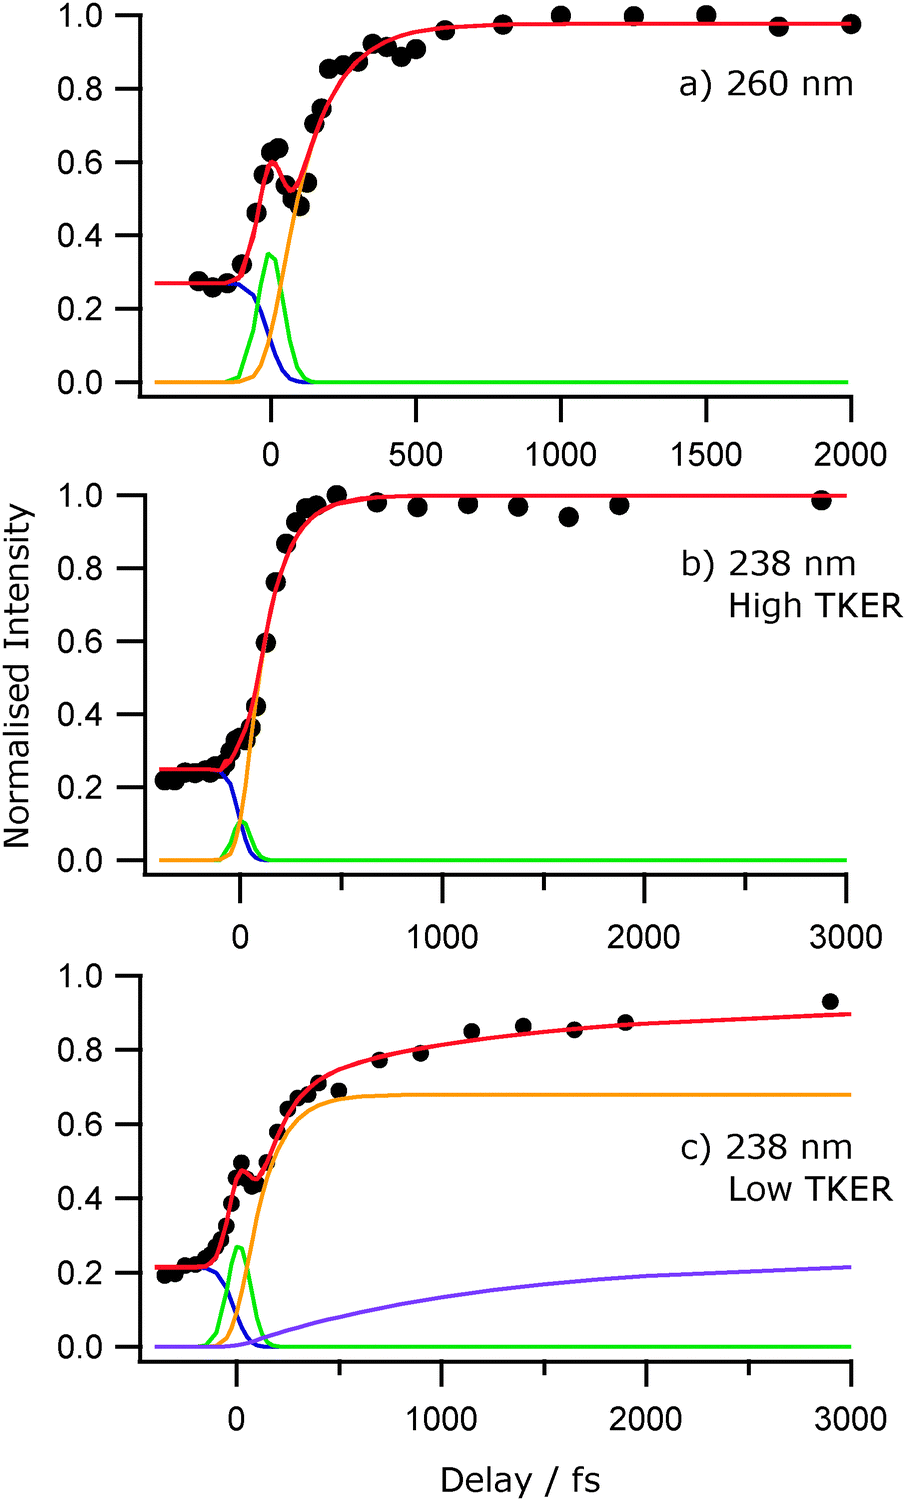 | ||
| Fig. 8 Normalised H+ signal transients following excitation of 2-thiophenethiol at 260 nm (a) and 238 nm (b and c). The latter are for signal with TKERs in the range (b) 6000–11000 cm−1 and (c) 0–5000 cm−1 respectively. The filled circles represent the integrated H+ signal for each TKER of interest and the solid red line represents the overall kinetic fit. Individual fitting components are shown in blue (exponential rise at Δt < 0), green (exponential decay centred at Δt = 0) and yellow (Δt > 0). The purple line in (c) is an additional exponential rise used to fit the long-time increase in intensity. | ||
3.4 A plausible interpretation of the wavelength dependent fragmentation dynamics
The TR-VMI data serve to reinforce the main conclusions from the HRA-PTS studies. First, excitation of 2-thiophenethiol at long UV wavelengths (e.g. 260 nm) results in prompt formation of H atoms, with an anisotropic recoil velocity distribution. This is consistent with that expected in the event of S–H bond fission following dissociation on the πσ* state PES. The R partner fragments are formed mainly in the first excited (Ã) electronic state, in the v = 0 level and in a spread of higher internal (vibrational) energy levels. Second, this prompt S–H bond fission process still operates at shorter wavelengths (e.g. 238 nm), but is supplemented by a secondary source of H atoms that appear at a slower rate, with lower kinetic energies and an isotropic angular distribution. Third, the H atom velocity distributions measured when exciting at yet shorter wavelengths (e.g. 220 nm and below) are quantitatively different. Most of the H atom photoproducts appear with a sub-100 fs time constant, but the recoil appears isotropic. The associated TKER spectra show no obvious signature of H + R(Ã, v = 0) product formation, peak at low TKER and extend to values compatible with one photon induced dissociation to H + R() products.
As noted above, the observations at long wavelength are consistent with prompt S–H bond fission on the πσ* PES. The present data are not sufficient to determine whether this πσ* is populated directly, or via rapid radiationless transfer from the 11ππ* state. Given the ground state equilibrium geometry, Franck–Condon arguments dictate that the photoexcited 2-thiophenethiol molecules arrive on the excited state PES with their S–H bond pointing out of the ring plane. The H atom recoil anisotropy and, particularly, the deduced dominance of electronically excited (à state) radical co-products imply that the photoexcited molecules remain sufficiently non-planar during S–H bond extension that they avoid CI-2 and follow the adiabatic path to products. We note many parallels between the present data and previously reported results for the near UV photolysis of 2-methyl-3-furanthiol.31 Obvious similarities include the respective ground state minimum energy geometries, the near UV absorption spectra, the H atom recoil anisotropy, the breadth of the TKER spectra obtained when exciting at long wavelengths (which most plausibly represents a propensity for ring-expansion in tandem with S–H bond extension), and the respective S–H bond strengths obtained if one associates the prominent fast peak with formation of ground state radical products. Such an analysis led to a reported S–H bond dissociation energy for 2-methyl-3-furanthiol of 31320 ± 100 cm−1. No weak pedestal at higher TKER was identified in the earlier study31 but, given the present analysis, it appears more likely that near UV photolysis of 2-methyl-3-furanthiol results in a similar almost total population inversion between the à and states of the 2-methyl-3-furanthiyl radical and that the previously reported (high) dissociation energy should actually be viewed as a threshold energy for forming à state radical products.
The TR-VMI data for 2-thiophenethiol implies some contribution from an alternative (slower) route to forming H atoms, with lower kinetic energies, once the excitation wavelength has decreased to 238 nm. The UV absorption spectrum (Fig. 2), and its analysis based on the CASPT2 calculations (Table 1), suggest that most of the transition strength at this wavelength is provided by the 21ππ* ← S0 excitation. The 238 nm TKER spectrum does not show an obvious step change from those measured at longer excitation wavelengths, suggesting that dissociation via coupling to the πσ* PES remains the major fragmentation pathway. However, the increased yield of slow, isotropic H atom products revealed by Fig. 7(b) hints at the onset of a rival decay channel. This alternative channel most likely occurs following internal conversion to the S0 state.
We have not conducted an exhaustive search for all possible low energy CIs between the ππ* and S0 PESs, but have computed PECs for the ground and first few excited singlet states along the C2–S1 bond extension coordinate, and calculated the relative energies of various parent isomers, transition states and fragmentation limits on the ground state PES. Fig. 9 shows the former PECs calculated (at the CASPT(2)/cc-pVDZ level) by systematic extension of RC2–S1 and, at each step, allowing the rest of the ground state structure to relax to its minimum energy geometry (black filled circles). The first three singlet excited state PECs were then calculated for this sequence of relaxed S0 geometries and are shown by the open circles. The equivalent relaxed scan of the S1 PEC from its optimised minimum energy geometry in the Franck–Condon region to longer C2–S1 bond lengths is shown by the filled red circles. The open black circles show the S0 energies at these optimised S1 geometries. One key finding from these calculations is the relative instability of one of the lower lying excited states with respect to RC2–S1. The calculated PEC for this state shows a CI with the S0 state at extended RC2–S1 (henceforth termed CI-3), that is reminiscent of those identified for several other S (and O) containing heterocycles.23–29 Thus it is tempting to associate the additional yield of slower H atoms revealed in Fig. 7(b) with population of this state (either directly, or by coupling from the 21ππ* state), C2–S1 bond extension towards CI-3, radiationless transfer to high vibrational levels of the S0 state and subsequent unimolecular decay.
 | ||
| Fig. 9 PECs along RC–S calculated at the CASPT2(10/8)/cc-pVDZ level of theory for the ground state and first three singlet excited states of 2-thiophenethiol. The filled black circles show a relaxed scan along the S0 PES. The open coloured circles show the excited state potentials calculated at these relaxed geometries. The solid red circles are from a relaxed scan along the S1 PES, with geometry optimisations performed at the ADC(2)/cc-pVDZ level of theory and energy corrections at the CASPT2(10,8)/cc-pVDZ level; the open black circles show the S0 state energies calculated at these relaxed S1 geometries. | ||
As Fig. 10 shows, 2-thiophenethiol is the minimum energy structure on the S0 PES, but we also identify two families of ring-opened isomers: A follows directly from C2–S1 bond fission, while formation of the isomer B also requires a trans- ← cis-isomerisation around the C3–C4 bond. A, B, the transition state separating A and B, and the calculated thresholds for S–H bond fission all lie well below the energy of a 238 nm photon (5.2 eV). Thus our favoured explanation for the additional yield of slower H atoms revealed in Fig. 7(b) is unimolecular decay from highly vibrationally excited S0 molecules. Both the minimal difference in the TKER distributions obtained by TR-VMI at δt = 500 fs and 50 ps, and the clear presence of the TKERmax peak in the HRA-PTS spectrum, implies that this is a minor channel at λphot = 238 nm.
 | ||
| Fig. 10 Calculated relative energies of 2-thiophenethiol, the biradical intermediate A formed upon C2–S1 bond fission, the lowest TS leading to the ring-opened isomers (B), selected H + radical (C, D, R) product limits and the lowest three body dissociation limit yielding two H atom products plus E. The various structures and products are shown to the right, along with their energies or threshold formation energies (in eV, defined relative to the ground state minimum). We have not checked for the presence (or otherwise) of barriers in the various fragmentation paths; the dashed lines simply correlate given structures to particular dissociation products. The horizontal dashed line indicates the total energy reached upon absorption of a 238 nm photon. | ||
The form of the spectra derived at shorter λphot are very different, however, with no fine structure attributable to the H + R(Ã, v = 0) products and a high energy tail extending to TKER values compatible with H + R(, v = 0) products. The 200 nm TR-VMI data (Fig. 7(c)) shows that these translationally excited H atoms are formed within 500 fs, and Fig. 2 shows that the parent absorption cross-section increases further at these short wavelengths. Given these facts, the most plausible explanation for the short wavelength data involves excitation to one or more higher excited states, rapid radiationless transfer to the same 1πσ* state as at longer excitation wavelengths, but with geometries sufficiently close to planar that some significant fraction of the dissociating flux now follows the diabatic path through CI-2 to H + R() products.
The 200 nm TR-VMI data (Fig. 7(c)) shows formation of some additional H atom products with low TKER over a longer timescale. As at 238 nm, we attribute these products to the unimolecular decay of highly vibrationally excited S0 molecules. The nature of the partner fragment is unclear from the present data. R, C and D would all be possible on energetic grounds. Density of states arguments would tend to favour R + H products, but the extent to which RRKM-like considerations should apply is unclear, given that the deduced unimolecular decay rate (even at 238 nm) exceeds the likely timescale for intramolecular energy randomisation on the S0 PES.
4 Conclusions
This report details a combined PTS and ab initio study of H atom formation processes following near UV excitation of 2-thiophenethiol. The long wavelength (277.5 nm ≥ λphot ≥ 240 nm) PTS data (TKER spectra and recoil anisotropy measurements) are consistent with S–H bond dissociation after population of the lowest 1πσ* PES. The thiophenethiyl (R) radicals partnering the observed H atoms are formed almost exclusively in their first excited Ã2A′ state, but the observation of a weak pedestal attributable to H + R(2A′′) products allows determination of the S–H bond strength (D0 = 27800 ± 100 cm−1) and the Ö state splitting in the thiophenethiyl radical (ΔE = 3580 ± 100 cm−1). The finding of a large population inversion between the electronic states of the radical is viewed as a natural consequence of the non-planar ground state geometry, wherein the S–H bond is aligned almost at right angles to the ring plane. The obvious parallels between the present data and that reported previously following UV photodissociation of 2-methyl-3-furanthiol31 has led to a reinterpretation of the earlier data.
At shorter excitation wavelengths, π* ← π absorption dominates and the PTS spectra reveal, first, small changes (λphot ∼ 238 nm) and then, more substantial changes once λphot ≤ 220 nm. The former change – a modest, longer-time build up of slow H atom products – is attributed to the onset of a rival internal conversion pathway to the S0 PES via a CI (CI-3) accessed by extending the C2–S1 intra-ring bond. The more striking changes in the TKER spectra observed when photolysing at shorter wavelengths, in contrast, are attributed to excited state photochemistry: the excited states populated at these short wavelengths are deduced to rapidly predissociate, by coupling to the same 1πσ* state that drives photofragmentation at longer wavelengths. In the short wavelength case, however, the dissociating molecules appear to attain sufficiently near-planar geometries en route to CI-2 to enable dissociation to the H + R() products.
The recent literature contains a growing body of experimental evidence for near UV photoinduced ring opening in similar heterocycles, in both the gas37,51–53 and condensed36,54 phases. The present investigations of the near UV photochemistry of 2-thiophenethiol invoke a (relatively minor) role for intra-ring C–S bond extension as a route to channelling excited state population back to the S0 state, but provide no definitive evidence that full ring opening is able to compete with (fast) S–H bond fission.
Acknowledgements
The Bristol authors are grateful to EPSRC (Programme Grant EP/L005913) and to Drs Barbara Marchetti, Daniel Murdock, Tom Oliver, James Smith and to Natercia Rodrigues for their many and varied contributions to this work. The Warwick authors are grateful to EPSRC for postdoctoral funding (EP/J007153) and the Royal Society for a University Research Fellowship. Additional outputs that underpin data reported in this paper have been placed in the University of Bristol's research data repository and can be accessed using the following DOI: 10.5523/bris.e8tu256gnv8410u7oanj8ikna.References
- A. Iqbal, L. J. Pegg and V. G. Stavros, J. Phys. Chem. A, 2008, 112, 9531–9534 CrossRef CAS PubMed.
- G. A. King, T. A. A. Oliver, M. G. D. Nix and M. N. R. Ashfold, J. Phys. Chem. A, 2009, 113, 7984–7993 CrossRef CAS PubMed.
- A. Iqbal, M. S. Y. Cheung, M. G. D. Nix and V. G. Stavros, J. Phys. Chem. A, 2009, 113, 8157–8163 CrossRef CAS PubMed.
- R. N. Dixon, T. A. A. Oliver and M. N. R. Ashfold, J. Chem. Phys., 2011, 134, 194303 CrossRef PubMed.
- Y. Zhang, T. A. A. Oliver, M. N. R. Ashfold and S. E. Bradforth, Faraday Discuss., 2012, 157, 141–163 RSC.
- X. Xu, J. Zheng, K. R. Yang and D. G. Truhlar, J. Am. Chem. Soc., 2014, 136, 16378–16386 CrossRef CAS PubMed.
- J. S. Lim, I. S. Lim, K. S. Lee, D. S. Ahn, Y. S. Lee and S. K. Kim, Angew. Chem., Int. Ed., 2006, 45, 6290–6293 CrossRef CAS PubMed.
- I. S. Lim, J. S. Lim, Y. S. Lee and S. K. Kim, J. Chem. Phys., 2007, 126, 034306 CrossRef PubMed.
- A. L. Devine, M. G. D. Nix, R. N. Dixon and M. N. R. Ashfold, J. Phys. Chem. A, 2008, 112, 9563–9574 CrossRef CAS PubMed.
- J. S. Lim, Y. S. Lee and S. K. Kim, Angew. Chem., Int. Ed., 2008, 47, 1853–1856 CrossRef CAS PubMed.
- M. N. R. Ashfold, A. L. Devine, R. N. Dixon, G. A. King, M. G. D. Nix and T. A. A. Oliver, Proc. Natl. Acad. Sci. U. S. A., 2008, 105, 12701–12706 CrossRef CAS PubMed.
- J. S. Lim, H. Choi, I. S. Lim, S. B. Park, Y. S. Lee and S. K. Kim, J. Phys. Chem. A, 2009, 113, 10410–10416 CrossRef CAS PubMed.
- H. J. Kim, J. H. Yoon and S. Yoon, J. Phys. Chem. A, 2010, 114, 12010–12015 CrossRef CAS PubMed.
- T. S. Venkatesan, S. G. Ramesh, Z. Lan and W. Domcke, J. Chem. Phys., 2012, 136, 174312 CrossRef CAS PubMed.
- H. S. You, S. Han, J. S. Lim and S. K. Kim, J. Phys. Chem. Lett., 2015, 6, 3202–3208 CrossRef CAS.
- H. An, H. Choi, Y. S. Lee and K. K. Baeck, ChemPhysChem, 2015, 16, 1529–1534 CrossRef CAS PubMed.
- I. Reva, M. J. Nowak, L. Lapinski and R. Fausto, Phys. Chem. Chem. Phys., 2015, 17, 4888–4898 RSC.
- C. M. Tseng, Y. T. Lee and C. K. Ni, J. Phys. Chem. A, 2009, 113, 3881–3885 CrossRef CAS PubMed.
- M. N. R. Ashfold, G. A. King, D. Murdock, M. G. D. Nix, T. A. A. Oliver and A. G. Sage, Phys. Chem. Chem. Phys., 2010, 12, 1218 RSC.
- A. Schweig and N. Thon, Chem. Phys. Lett., 1976, 38, 482–485 CrossRef CAS.
- T. Vondrak, S.-I. Sato, V. Spirko and K. Kimura, J. Phys. Chem. A, 1997, 101, 8631–8638 CrossRef CAS.
- M. Bossa, S. Morpurgo and S. Stranges, THEOCHEM, 2002, 618, 155–164 CrossRef CAS.
- J. S. Lim and S. K. Kim, Nat. Chem., 2010, 2, 627–632 CrossRef CAS PubMed.
- W. Li, Z. Xie and X. Jing, Catal. Commun., 2011, 16, 94–97 CrossRef CAS.
- G. M. Roberts, D. J. Hadden, L. T. Bergendahl, A. M. Wenge, S. J. Harris, T. N. V. Karsili, M. N. R. Ashfold, M. J. Paterson and V. G. Stavros, Chem. Sci., 2013, 4, 993–1001 RSC.
- S. Han, J. S. Lim, J.-H. Yoon, J. Lee, S.-Y. Kim and S. K. Kim, J. Chem. Phys., 2014, 140, 054307 CrossRef PubMed.
- A. M. Wenge, T. N. V. Karsili, J. R. Diaz, M. I. Cotterell, B. Marchetti, R. N. Dixon and M. N. R. Ashfold, Phys. Chem. Chem. Phys., 2015, 17, 16217–16648 RSC.
- S. L. Li, X. Xu, C. E. Hoyer and D. G. Truhlar, J. Phys. Chem. Lett., 2015, 6, 3352–3359 CrossRef CAS PubMed.
- S. L. Li, X.-F. Xu and D. G. Truhlar, Phys. Chem. Chem. Phys., 2015, 17, 20093–20099 RSC.
- H. Reisler and A. I. Krylov, Int. Rev. Phys. Chem., 2009, 28, 267–308 CrossRef CAS.
- T. A. A. Oliver, G. A. King, M. G. D. Nix and M. N. R. Ashfold, J. Phys. Chem. A, 2010, 114, 1338–1346 CrossRef CAS PubMed.
- S. Nourbakhsh, H. Yin, C. Liao and C. Y. Ng, Chem. Phys. Lett., 1992, 190, 469–475 CrossRef CAS.
- N. Gavrilov, S. Salzmann and C. M. Marian, Chem. Phys., 2008, 349, 269–277 CrossRef CAS.
- S. Salzmann, M. Kleinschmidt, J. Tatchen, R. Weinkauf and C. M. Marian, Phys. Chem. Chem. Phys., 2008, 10, 380–392 RSC.
- M. Stenrup, Chem. Phys., 2012, 397, 18–25 CrossRef CAS.
- D. Murdock, S. J. Harris, J. Luke, M. P. Grubb, A. J. Orr-Ewing and M. N. R. Ashfold, Phys. Chem. Chem. Phys., 2014, 16, 21271–21279 RSC.
- B. Marchetti, T. N. V. Karsili, O. Kelly, P. Kapetanopoulos and M. N. R. Ashfold, J. Chem. Phys., 2015, 142, 224303 CrossRef PubMed.
- D. H. Mordaunt, M. N. R. Ashfold and R. N. Dixon, J. Chem. Phys., 1996, 104, 6460–6471 CrossRef CAS.
- B. Cronin, M. G. D. Nix, R. H. Qadiri and M. N. R. Ashfold, Phys. Chem. Chem. Phys., 2004, 6, 5031–5041 RSC.
- K. L. Wells, G. Perriam and V. G. Stavros, J. Chem. Phys., 2009, 130, 074308 CrossRef PubMed.
- M. Staniforth, J. D. Young, D. R. Cole, T. N. V. Karsili, M. N. R. Ashfold and V. G. Stavros, J. Phys. Chem. A, 2014, 118, 10909–10918 CrossRef CAS PubMed.
- U. Even, J. Jortner, D. Noy, N. Lavie and C. Cossart-Magos, J. Chem. Phys., 2000, 112, 8068 CrossRef CAS.
- G. M. Roberts, J. L. Nixon, J. Lecointre, E. Wrede and J. R. R. Verlet, Rev. Sci. Instrum., 2009, 80, 053104 CrossRef CAS PubMed.
- C. Møller and M. S. Plesset, Phys. Rev., 1934, 46, 618–622 CrossRef.
- T. Dunning Jr, J. Chem. Phys., 1989, 90, 1007–1023 CrossRef.
- C. Hampel, K. Peterson and H. Werner, Chem. Phys. Lett., 1992, 190, 1–12 CrossRef CAS.
- H.-J. Werner, P. J. Knowles, G. Knizia, F. R. Manby, M. Schütz, P. Celani, W. Györffy, D. Kats, T. Korona, R. Lindh, A. Mitrushenkov, G. Rauhut, K. R. Shamasundar, T. B. Adler, R. D. Amos, A. Bernhardsson, A. Berning, D. L. Cooper, M. J. O. Deegan, A. J. Dobbyn, F. Eckert, E. Goll, C. Hampel, A. Hesselmann, G. Hetzer, T. Hrenar, G. Jansen, C. Köppl, Y. Liu, A. W. Lloyd, R. A. Mata, A. J. May, S. J. McNicholas, W. Meyer, M. E. Mura, A. Nicklass, D. P. O'Neill, P. Palmieri, D. Peng, K. Pflüger, R. Pitzer, M. Reiher, T. Shiozaki, H. Stoll, A. J. Stone, R. Tarroni, T. Thorsteinsson and M. Wang, MOLPRO, version 2010.1, a package of ab initio programs, 2010 Search PubMed.
- M. J. Frisch, G. W. Trucks, H. B. Schlegel, G. E. Scuseria, M. A. Robb, J. R. Cheeseman, G. Scalmani, V. Barone, B. Mennucci, G. A. Petersson, H. Nakatsuji, M. Caricato, X. Li, H. P. Hratchian, A. F. Izmaylov, J. Bloino, G. Zheng, J. L. Sonnenberg, M. Hada, M. Ehara, K. Toyota, R. Fukuda, J. Hasegawa, M. Ishida, T. Nakajima, Y. Honda, O. Kitao, H. Nakai, T. Vreven, J. A. Montgomery, Jr., J. E. Peralta, F. Ogliaro, M. Bearpark, J. J. Heyd, E. Brothers, K. N. Kudin, V. N. Staroverov, R. Kobayashi, J. Normand, K. Raghavachari, A. Rendell, J. C. Burant, S. S. Iyengar, J. Tomasi, M. Cossi, N. Rega, J. M. Millam, M. Klene, J. E. Knox, J. B. Cross, V. Bakken, C. Adamo, J. Jaramillo, R. Gomperts, R. E. Stratmann, O. Yazyev, A. J. Austin, R. Cammi, C. Pomelli, J. W. Ochterski, R. L. Martin, K. Morokuma, V. G. Zakrzewski, G. A. Voth, P. Salvador, J. J. Dannenberg, S. Dapprich, A. D. Daniels, O. Farkas, J. B. Foresman, J. V. Ortiz, J. Cioslowski and D. J. Fox, Gaussian 09 Revision D.01, Gaussian Inc., Wallingford, CT, 2009 Search PubMed.
- TURBOMOLE V6.2 2010, a development of University of Karlsruhe and Forschungszentrum Karlsruhe GmbH, 1989–2007, TURBOMOLE GmbH, since 2007; available from http://www.turbomole.com.
- T. A. A. Oliver, G. A. King, D. P. Tew, R. N. Dixon and M. N. R. Ashfold, J. Phys. Chem. A, 2012, 116, 12444–12459 CrossRef CAS PubMed.
- B. C. Arruda and R. J. Sension, Phys. Chem. Chem. Phys., 2014, 16, 4439–4455 RSC.
- C. C. Pemberton, Y. Zhang, K. Saita, A. Kirrander and P. M. Weber, J. Phys. Chem. A, 2015, 119, 8832–8845 CrossRef CAS PubMed.
- N. Kuthirummal, F. M. Rudakov, C. L. Evans and P. M. Weber, J. Chem. Phys., 2006, 125, 133307 CrossRef PubMed.
- D. Murdock, R. A. Ingle, I. V. Sazanovich, I. P. Clark, Y. Harabuchi, T. Taketsugu, S. Maeda, A. Orr-Ewing and M. N. R. Ashfold, Phys. Chem. Chem. Phys., 2015, 18, 2629–2638 RSC.
Footnote |
| † Electronic supplementary information (ESI) available. See DOI: 10.1039/c6cp01593j |
| This journal is © the Owner Societies 2016 |