
 Open Access Article
 This Open Access Article is licensed under a
 Creative Commons Attribution 3.0 Unported Licence
Determination of toluene hydrogenation kinetics with neutron diffraction†
Marta
Falkowska
ab,
Sarayute
Chansai
b,
Haresh G.
Manyar
b,
Lynn F.
Gladden
c,
Daniel T.
Bowron
a,
Tristan G. A.
Youngs
*a and
Christopher
Hardacre
*b
aSTFC ISIS Facility, Rutherford Appleton Laboratory, Harwell Campus, Didcot, Oxon, OX11 0QX, UK. E-mail: tristan.youngs@stfc.ac.uk
bCenTACat, School of Chemistry and Chemical Engineering, Queen's University Belfast, Stranmillis Road, BT9 5AG, UK. E-mail: c.hardacre@qub.ac.uk
cDepartment of Chemical Engineering and Biotechnology, University of Cambridge, Cambridge CB2 3RA, UK
First published on 29th March 2016
Abstract
Total neutron scattering has been used to follow the hydrogenation of toluene-d8 to methylcyclohexane-d14 over 3 wt% platinum supported on highly ordered mesoporous silica (MCM-41) at 298 K and under 150 mbar D2 pressure. The detailed kinetic information so revealed indicates that liquid reorganisation inside pores is the slowest step of the whole process. Additionally, the results were compared with the reaction performed under 250 mbar D2 pressure as well as with toluene-h8 hydrogenation using D2 at 150 mbar.
Introduction
It has been estimated that more than 80% of chemical processes use catalysis in at least one production step,1 and that heterogeneous catalysts are almost four times more frequently used than homogeneous systems.2A number of in situ methods which allow the study of solid catalysts under reaction conditions have been reported3,4 including SAXS, WAXS (XRD), EXAFS and XANES, FTIR (DRIFTS and ATR), UV-vis-NIR and NMR5–7 or combined methods. Mostly, however, these focus on the metal sites in the catalyst or the structure of the catalyst support, rather than the reagents confined in the pores. One exception to this is quasi-elastic neutron scattering (QENS) which can help in determining the molecular diffusion coefficients.8 Additionally, in situ techniques are more developed for heterogeneous processes involving gaseous reagents, where no mass transport through compounds surrounding a catalyst has to be taken into account (as is the case for liquid phase systems). One promising approach offering a unique opportunity to study the kinetics of liquid phase heterogeneous catalytic reactions in the pore of the catalyst, with simultaneous sensitivity over atomistic to mesoscopic length scales, is total neutron scattering. This technique has recently been demonstrated via an investigation of the hydrogenation of benzene to cyclohexane over a platinum catalyst in a mesoporous silica.9 Probing processes inside pores by this technique is possible due to the fact that neutrons interact with matter weakly, thus they are highly penetrating and deliver information on the bulk properties of a sample. Additionally, neutrons do not have any influence on the reaction rate and are a non-destructive probe. Other neutron diffraction techniques have also been employed to investigate catalytic reactions in the gas-phase where the focus was on the catalyst behaviour under industrially relevant conditions10 or inorganic reactions,11 such as hydrothermal crystallisation of complex inorganic solids.12
In this work, we have used the technique reported previously9 to study the hydrogenation of toluene-d8 to methylcyclohexane-d14 over 3 wt% Pt/MCM-41 at 298 K under 150 mbar and 250 mbar pressure of D2. Additionally, the hydrogenation of toluene-h8 under 150 mbar of D2 was performed to examine the potential for the technique to be used for protiated rather than deuteriated reagents. In this study, we report the detailed kinetic information as a function of length scale, on the investigated reactions. Toluene hydrogenation provides representative data for aromatic hydrogenations in general which are extensively used in the chemical industry. In addition, as the final product (methylcyclohexane) contains only saturated C–C bonds which have a different bond length than unsaturated bonds in toluene the contrast on the intramolecular scale between a reagent and a final product is high. Furthermore, the amount of deuterium atoms in each molecule after the reaction will be almost doubled causing a significant change in the neutron diffraction pattern.
Experimental
Materials
3 wt% Pt/MCM-41 was used as the catalyst, which was prepared by an incipient wetness technique using MCM-41 support (Sigma Aldrich) and 15% w/w Pt(NO3)2 aqueous solution (Johnson-Matthey) as the precursor. The catalyst was dried in air for 12 h at 393 K followed by calcination in air for 4 h at 773 K. The catalyst support, a mesoporous material, is amorphous silica with uniform unidimensional pores without any intersections or voids, and comprises cylindrical pores arranged in a hexagonal structure. The material has a sharp pore distribution, a large surface area and a large pore volume. Toluene-h8 and toluene-d8 were purchased from Sigma Aldrich and Qmx, respectively. All chemicals were used without further purification.Neutron diffraction
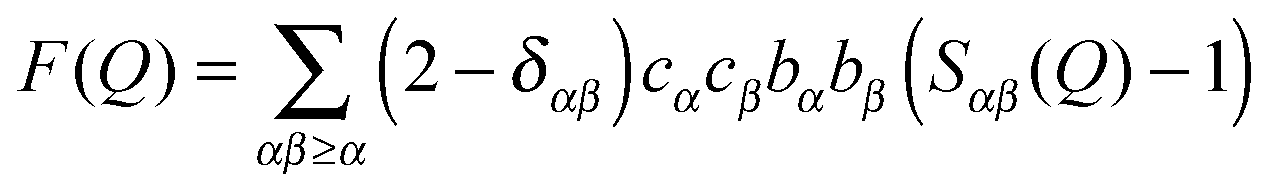
In total scattering experiments (see ESI†) a differential scattering cross section is measured as a function of the magnitude of the momentum transfer vector![[Q with combining right harpoon above (vector)]](https://www.rsc.org/images/entities/i_char_0051_20d1.gif) , and contains contributions from single atom ‘self-scattering’ and, more importantly, information about structural correlations between atom pairs, described by the structure factor F(Q):
, and contains contributions from single atom ‘self-scattering’ and, more importantly, information about structural correlations between atom pairs, described by the structure factor F(Q):This term is expressed as a sum of all correlations between pairs of atoms in a sample, where each interaction Sαβ(Q), often referred to as a partial structure factor, is weighted by the concentrations (cα, cβ) and the atomic scattering lengths (bα, bβ) for atom types α and β. The atomic scattering length describes the strength and character of the interaction of neutrons with the individual nuclei, and is isotope-dependent. The Kronecker delta δαβ is used to avoid double counting the like-atom pair terms. The momentum transfer vector is a vector between incident and scattered neutron beams and its magnitude can be calculated from:
where λ is the incident beam wavelength and 2θ is the scattering angle.
In order to describe the structure of disordered materials (see ESI†), the distribution of atoms/molecules as a function of distance from the central atom/molecule, the so called radial distribution function is often used. The corresponding radial distribution function can be determined by performing Fourier transform on the total structure factor:
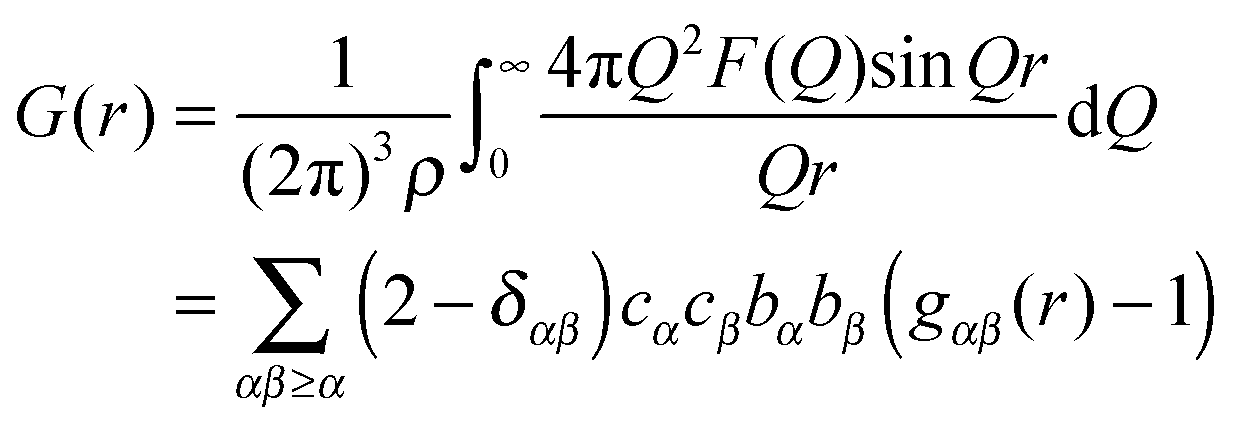
It is expressed in a similar fashion to the total structure factor, and so is a weighted sum of the partial pair distribution functions, gαβ(r). The radial distribution function in a system of atoms or molecules describes how atomic density varies as a function of distance from a reference atom or molecule placed at the origin.
All neutron diffraction data presented herein were collected on the Near and InterMediate Range Order Diffractometer (NIMROD)13 at the ISIS pulsed neutron and muon source, Rutherford Appleton Laboratory, UK. NIMROD was designed to allow comprehensive studies, ranging over atomic to mesoscopic length scales, of liquids and other disordered materials in a single measurement, Fig. 1. The instrument makes use of neutrons of wavelengths from 0.05 to 14 Å which are resolved using a time-of-flight method and is, consequently, able to collect data over a Q-range of 0.01 to 50 Å−1 (corresponding to elucidation of atomic pair correlations over length scales ranging from <1 to >300 Å). Furthermore, NIMROD benefits from a peak flux over the Q-range corresponding to molecular and mesoscopic length scales, permitting the use of short acquisition times crucial when conducting kinetic studies.
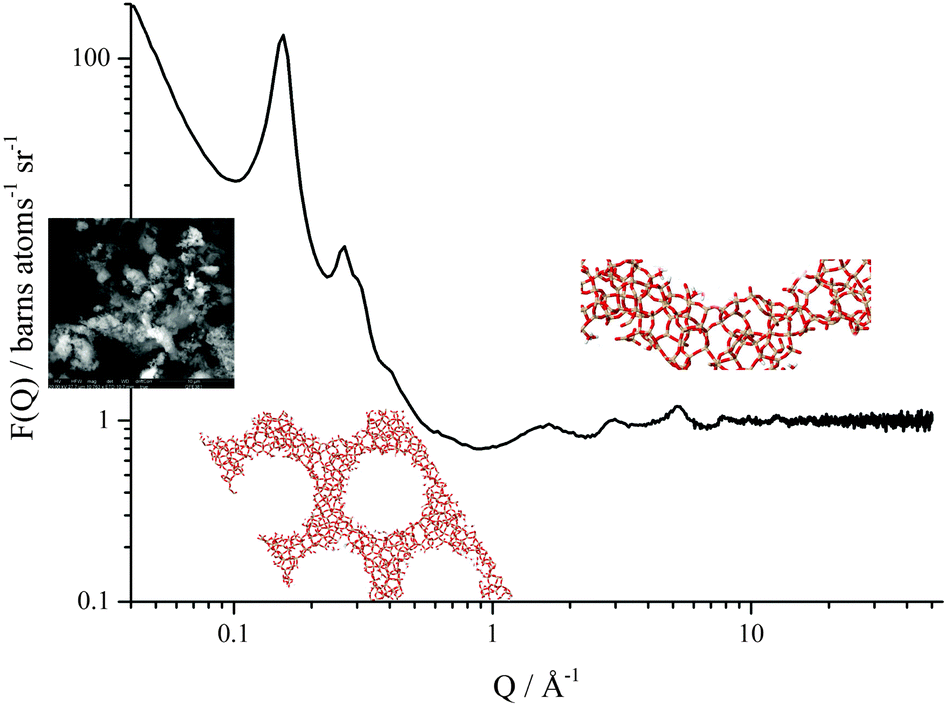 | ||
| Fig. 1 Total scattering structure factor obtained for evacuated MCM-41 on NIMROD. In a single measurement information about the size and shape of sample's grains can be obtained (low Q-range), as well as unit cell size from Bragg scattering features and interatomic correlations within the sample such as average distances between silicon and oxygen in MCM-41 (high Q-range). | ||
A standard null-scattering Ti0.68Zr0.32 flat plate neutron cell with internal dimensions 35 × 40 × 2 mm with a wall thickness of 1 mm was used as the catalytic reactor (see ESI†). The reactor was connected to a gas handling panel which allowed evacuation of the catalyst down to 10−5 mbar and the in situ introduction of toluene or D2 into the system.
Deposition of toluene into the catalyst pores was performed via capillary condensation by exposing the sample to toluene vapour. The filling process was monitored by neutron diffraction measurements and this was determined to be complete when no further changes in total structure factor were observed. This ensured the same packing fraction of the catalyst throughout the sequence of measurements, and simplified neutron data analysis. Furthermore, this procedure guaranteed no excess of liquid toluene surrounding the catalyst's grains. A small amount of liquid can be deposited on the external surface of catalyst grains due to their roughness and close to points of contact between powder grains; however, the external surface area in the chosen support (MCM-41) is small when compared to the internal surface area, so such molecules do not contribute a significant component to the obtained total structure factor. The remaining toluene surrounding the catalyst grains was present as a vapour.
The reaction was performed by exposing the catalyst filled with toluene to 150 or 250 mbar pressure of D2 at 298 K. During the reaction, data were collected in 5 min intervals to enable kinetic studies of the process. Additional measurements were made on the empty sample cell, the empty diffractometer and a 3.0 mm thick vanadium standard sample. Data were corrected for multiple scattering and absorption, and normalized to the incoherent scattering of vanadium using the Gudrun software.14 Additionally, an iterative procedure for inelasticity correction has been applied,15 which minimises the errors at low-Q range arising from inelastic collisions of the neutrons when scattering from light elements present in the sample. In our earlier proof of concept study9 inelasticity effects were not taken into account. Furthermore, the subtraction of ‘self-scattering’ was applied to the data presented, herein, in contrast to data published previously.9 This has the effect of enhancing the sensitivity of the chemical kinetics data to structural changes by minimising a small background level contribution that originates from the sensitivity of the total differential scattering cross section to the stoichiometric atomic composition of the sample.
Plug flow reactor
Kinetics determined for toluene-d8 and toluene-h8 hydrogenations from neutron diffraction experiments were compared with experiments carried out in a stainless steel plug flow reactor with the outer diameter of 12.7 mm. The reactor was filled with 0.25 g of 3 wt% Pt/MCM-41, and the constant flow of 1 bar 20% D2 in Ar was maintained to obtain 200 mbar partial pressure of the gaseous reagent during the reaction at 298 K. Samples of the reacting mixture were collected after 3 h of a reaction, extracted with methanol, and analysed using an Agilent J&W GC equipped with a HP-5 capillary column of 30 m length and 0.25 mm of the inner diameter.Results and discussion
In Fig. 2, total structure factors for catalysts filled with toluene-d8 and toluene-h8 are shown. As was mentioned above, isotopes frequently differ in neutron scattering lengths, and one of the most useful differences can be found for hydrogen (1H) and deuterium (2H): −3.740 fm and 6.674 fm, respectively. Due to this fact the total structure factors (for which scattering lengths are weighting factors) measured for catalyst filled with deuteriated and protiated toluene have different features. Features related to the presence of liquid in the system are more pronounced for the set of empty catalyst – toluene-d8 than for empty catalyst – toluene-h8. The difference in the intensity of the first Bragg reflection is more significant in the former case, decreasing by 64% of the original value, than in the latter case where a decrease of 31% of the original value is evident. The sample loaded with toluene-h8 also has a lower signal to noise ratio, especially at Q > 1 Å−1. This is due to the fact that hydrogen has a significantly higher incoherent neutron scattering cross section (80.27 barn) when compared to deuterium (2.05 barn), which in total neutron scattering is treated as a background that needs to be subtracted.15 It has to be mentioned that differences in total structure factors obtained for both evacuated catalysts (black and blue lines in Fig. 2), mainly visible in the Bragg peak intensities, are largely due to different concentrations and compositions of silanol groups present on the surface of MCM-41. In the present case, the same catalyst material was used for all reactions in sequence and, since the deuteriated reaction was performed first, exposure to catalytically activated D2 within the catalyst is likely to have caused at least a partial isotopic substitution of H-silanol groups to D-silanols. It has previously been shown that the effect of deuteriating silanol groups is for the intensity of the principal Bragg reflections to be enhanced, owing to increased contrast between the pore surface and the bulk/empty pore.16 Hence, the scattering profile for the empty catalyst displays more intense Bragg peaks than for the deuteriated reaction.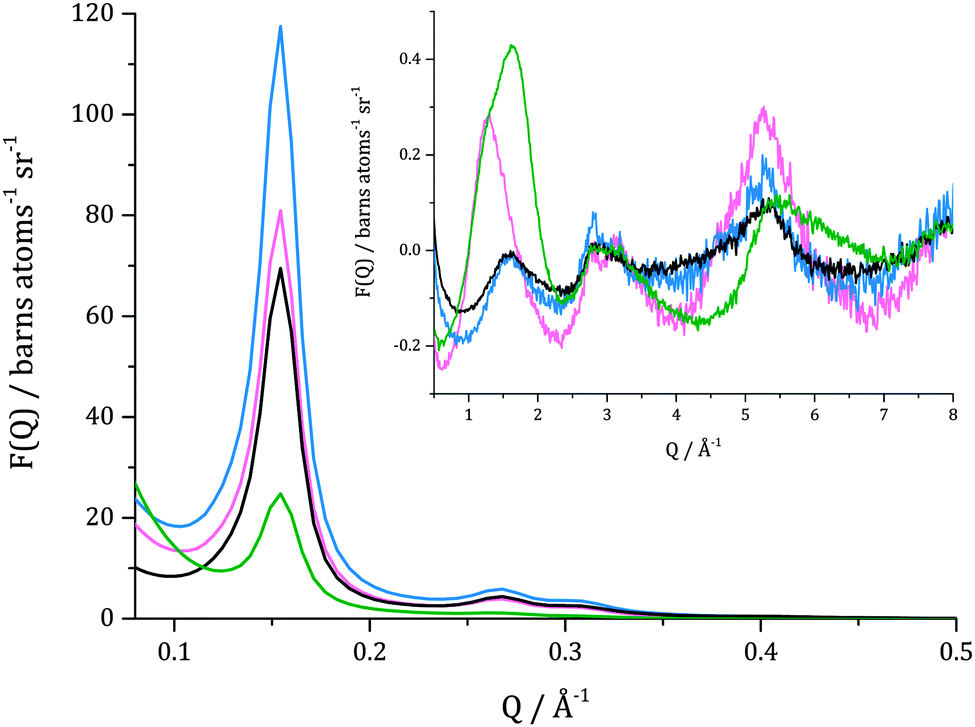 | ||
| Fig. 2 Two sets of total scattering structure factors for evacuated catalyst (blue and black lines), and catalysts loaded with reagent. Black line indicates an empty catalyst that was later filled with toluene-d8 (green line), whereas blue line presents diffraction from empty catalyst later loaded with toluene-h8 (pink line). | ||
In Fig. 3, total scattering structure factors for the evacuated catalyst, catalyst with pores filled with toluene-d8 and catalyst after the hydrogenation by 150 mbar D2 are shown. From data for the evacuated catalyst, characterization of the porous framework of MCM-41 can be made. The first Bragg reflection (100) for the evacuated catalyst is centred at Q = 0.154 Å−1 which corresponds to a pore d100-spacing of 40.80 Å and a unit cell size of 47.11 Å for a hexagonal lattice. The corresponding (110) and (200) reflections are observed at 0.27 Å−1 and 0.31 Å−1.
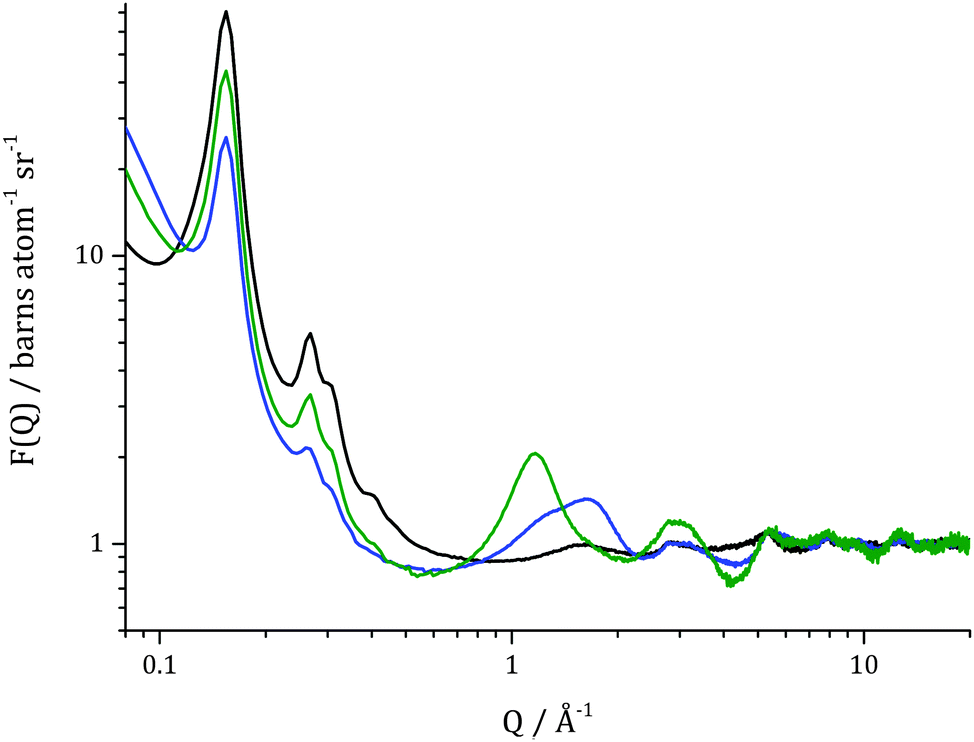 | ||
| Fig. 3 Total scattering structure factors measured for evacuated 3 wt% Pt/MCM-41 catalyst (black line), for catalyst filled with toluene-d8 by capillary condensation (blue line) and catalyst after 15 h of reaction (green line). An offset of 1 has been applied to all datasets. | ||
When structure factors for the catalyst filled with toluene-d8 and the evacuated sample are compared, a decrease in the intensity of the first Bragg peak can be observed. This is due to pores being filled with a material having higher contrast to the bulk silica than the empty pore. This property is expressed by differences in scattering length densities (SLD) computed from:
Contrast between empty pore to bulk amorphous silica and contrast between a pore filled with toluene-d8 to bulk silica are: ΔSLD = 3.47 × 10⁻⁶ Å−2 and ΔSLD = 1.77 × 10⁻⁶ Å−2, respectively. After 15 h of reaction, the intensity of the first Bragg peak increased, which is a consequence of a presence of material inside pores that possesses higher contrast to bulk silica than toluene-d8. For methylcyclohexane-d14, the final product, ΔSLD = 2.32 × 10⁻⁶ Å−2, which is slightly less then contrast found in the empty catalyst and thus, the Bragg reflections do not regain the same intensity as for the evacuated sample.
Additionally, an increase in the complexity of a signal beyond 1 Å−1 can be observed in the total scattering structure factor for the catalyst filled with toluene-d8 when compared with the evacuated catalyst. Clearly, new inter- and intramolecular correlations are present in the system due to the presence of a reagent inside pores. In the system after the reaction, further changes in these interactions can be observed which is consistent with the formation of a different chemical species – methylcyclohexane-d14.
Direct Fourier transforms of data shown in Fig. 3 were calculated and are presented in Fig. 4. In the radial distribution function for the evacuated catalyst, two clear peaks can be found at 1.6 Å and 2.6 Å which correspond to the average distance between silicon and oxygen and between oxygen atoms in silica, respectively. For the catalyst loaded with toluene-d8 additional peaks are observed at ∼1.09 Å, corresponding to the C–D bond length, and at ∼1.34 Å, associated with the aromatic C![[double bond, length as m-dash]](https://www.rsc.org/images/entities/char_e001.gif) C bond length which overlaps slightly with the peak for Si–O distance. In the radial distribution function for the catalyst after toluene-d8 hydrogenation a significant increase in the peak corresponding to C–D bond length can be observed, as well as decrease in the feature corresponding to aromatic CC bond length and an increase in a peak at ∼1.54 Å corresponding to an aliphatic C–C bond, i.e. that found in methylcyclohexane, which confirms the fact that the reaction had occurred.
C bond length which overlaps slightly with the peak for Si–O distance. In the radial distribution function for the catalyst after toluene-d8 hydrogenation a significant increase in the peak corresponding to C–D bond length can be observed, as well as decrease in the feature corresponding to aromatic CC bond length and an increase in a peak at ∼1.54 Å corresponding to an aliphatic C–C bond, i.e. that found in methylcyclohexane, which confirms the fact that the reaction had occurred.
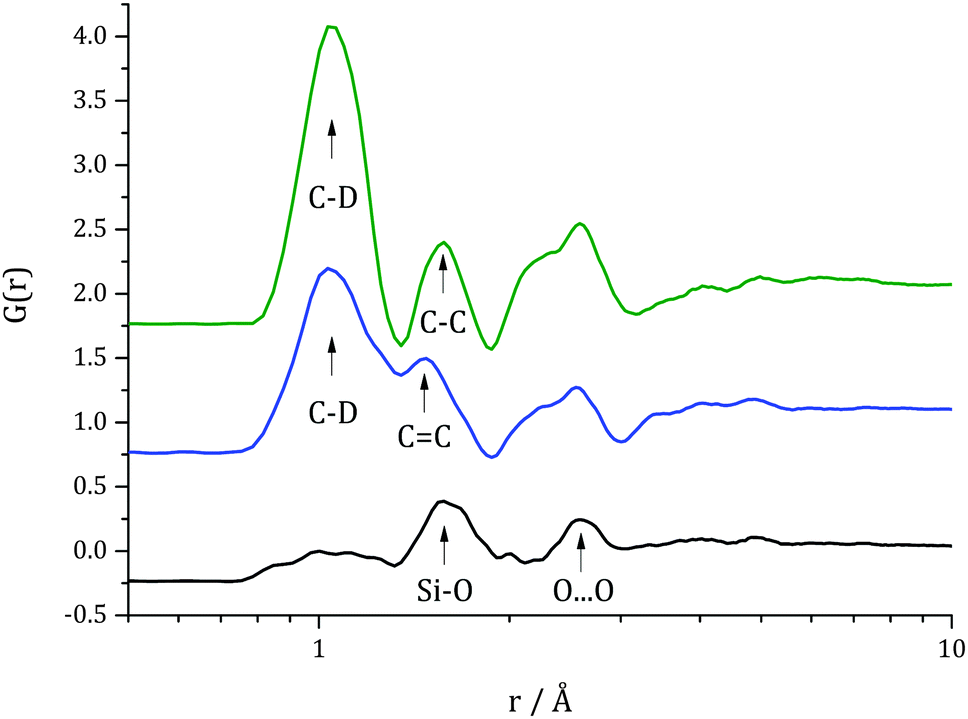 | ||
| Fig. 4 Direct Fourier transform D(r) of data shown in Fig. 3, i.e. radial distribution function for evacuated catalyst (black line), catalyst filled with toluene-d8 (red line), and catalyst after 15 h of reaction (blue line). An offset was used for clarity. | ||
As these overlapping features make the quantitative determination of an instantaneous concentration of different species during a reaction non-trivial in the total radial distribution function, a comprehensive molecular component analysis would require extensive modelling which is not practical to report here. To avoid this complication the evolution of the structural changes are analysed directly from the time evolving structure factor, Fig. 5, where evolution of the function at specific Q-values gives a view of changes, averaged over all pair correlations occurring on specific length scales given by ∼2π/Q. Data were collected every 5 min, but to allow better statistics these data sets were merged into 15 min segments.
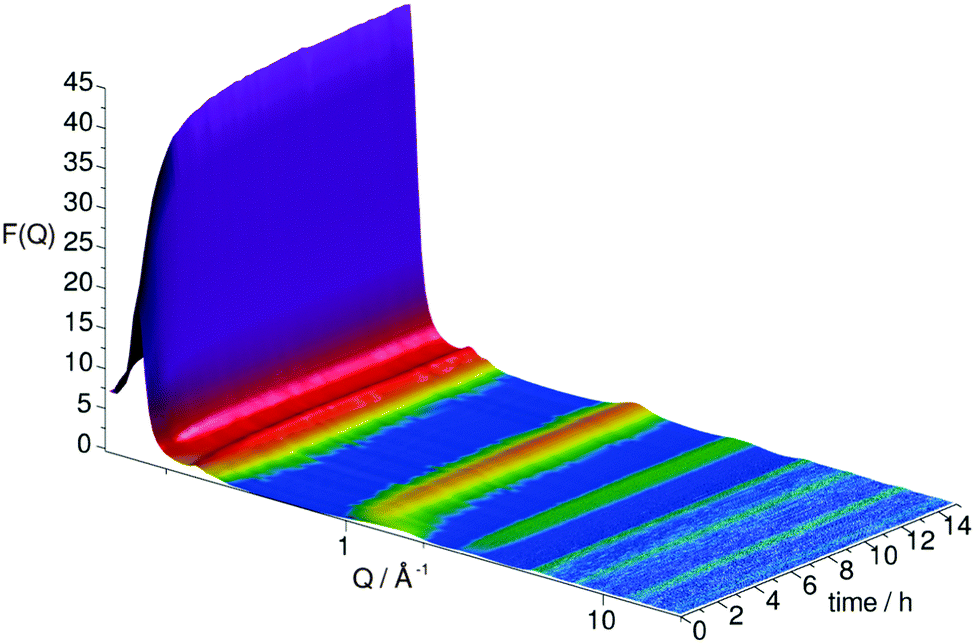 | ||
| Fig. 5 Evolution of total scattering structure factor over the course of the toluene-d8 hydrogenation under 150 mbar D2. | ||
Kinetic information corresponding to different length scales in the system can be obtained through an examination of the changes at the specific Q values with respect to time and fitting data with exponential curves using the Levenberg–Marquardt algorithm, Fig. 6. For the Q value corresponding to the first Bragg reflection (Q = 0.15 Å−1) the signal was too complex to treat as a simple exponential growth over the reaction time, and a double exponential model was found to be necessary with the rate constants for the corresponding fit found to be k1 = 1.08 ± 0.06 h−1 and k2 = 0.22 ± 0.09 h−1 (R2 = 0.998).
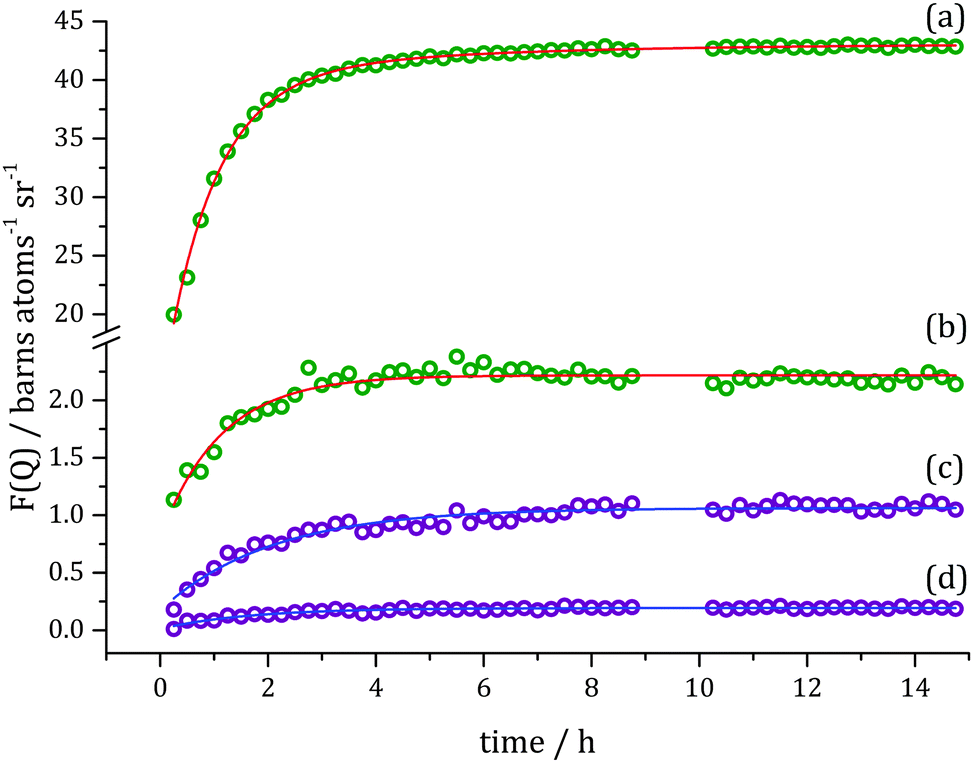 | ||
| Fig. 6 Slices taken through evolution of F(Q) (Fig. 5) at specific Q values (symbols): (a) Q = 0.15 Å−1, (b) Q = 0.27 Å−1, (c) Q = 1.18 Å−1 and (d) Q = 2.90 Å−1, and exponential fits to the data (solid lines). Green colour indicates changes in Bragg scattering and violet – in diffuse scattering over the course of the hydrogenation reaction. | ||
Due to smaller contrast changes observed for the second and third Bragg reflection, only one rate constant for each could be determined. These values are similar to the faster rate constant k1 found for the first Bragg peak and are ∼0.95 ± 0.08 h−1 (R2 = 0.912) for (110) and ∼0.93 ± 0.08 h−1 (R2 = 0.921) for (200). The intermediate Q-range rate constants describe changes at the molecular level. The fitted data resulted in values of k3(Q = 1.18 Å−1) = 0.48 ± 0.03 h−1 (R2 = 0.944) and k3(Q = 2.90 Å−1) = 0.61 ± 0.06 h−1 (R2 = 0.902). The fitting procedure for changes in F(Q) at higher Q-values is encumbered with higher errors, e.g. at Q = 4.095 Å−1 the rate constant is found to be k3 = 0.55 ± 0.14 h−1 (R2 = 0.563). Processes occurring inside pores, described by changes in Bragg reflection intensities (k1 and k2) are linked to differences in contrast to the bulk silica. In the present case such changes may only happen in one of two ways – either a new species possessing a different scattering length density enters the pore, or existing species already present within the pore rearrange in order to present a different local scattering length density. For instance, the latter effect can be brought about due to the exchange of product and reactant molecules at the pore surface, affecting the local arrangement of (and distance between) molecules at the walls of the pore, and thus creating local fluctuations in SLD, and thus cause a change in Bragg peak intensity.
We postulate that the requirement for the two rate constants to describe the changes observed at Q = 0.15 Å−1 have these underlying causes. The first case, described by the faster rate constant k1 can be assigned to D2 entering the catalyst pores, whereas the second slower rate constant is most likely due to the reorganisation of the liquid structure in the pores due to the conversion of toluene to methylcyclohexane. Additionally, toluene and methylcyclohexane differ in their preferred intermolecular orientations,17 therefore, the final product and reagent reveal different features in F(Q) in the intermolecular correlations region. The rate constants k3 found for molecular changes in the diffuse scattering pattern (>1 Å−1) describe the chemical reaction. No excess of toluene-d8 outside the catalyst grains was present as a consequence of the use of capillary condensation to fill the catalyst pores, so no mass transport through the bulk fluid to and from catalyst pore needs to be considered. Additionally, to detect gaseous D2 by neutron diffraction a much higher molecular density (i.e. increased gas pressure) would be required, and so in the investigated system the D2 becomes ‘visible’ only by changing contrast to the surrounding bulk silica when it enters a pore. In this system surface processes, such as adsorption of reagents on the active sites and desorption of products, cannot be detected due to the very low Pt loading and high pore volume to surface area ratio.
From the carried out analysis it can be concluded that liquid reorganisation within pores (including liquid diffusion) in the chosen system is the slowest step of the reaction, and this was also found for benzene-d6 hydrogenation under 250 mbar D2 on 5 wt% Pt/SiO2.9
The same procedure of data analysis as described above was also performed for toluene-d8 hydrogenation at 250 mbar D2. At this higher pressure, changes in the Bragg reflection intensities occur more rapidly and can be described only with the single exponential curve fit, Fig. 7. Rate constant for changes in F(Q) at Q = 0.15 Å−1 was determined to be k4 = 1.56 ± 0.10 h−1 (R2 = 0.983).
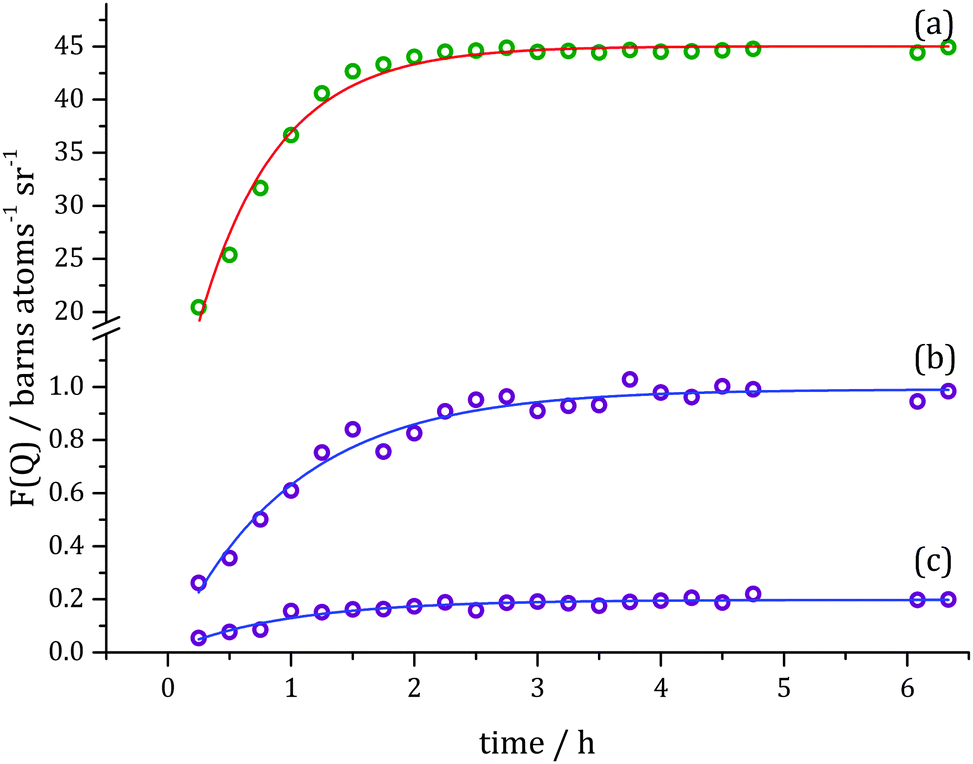 | ||
| Fig. 7 Changes of F(Q) over the course of toluene-d8 hydrogenation by 250 mbar D2 at specific Q values (symbols): (a) Q = 0.15 Å−1, (b) Q = 1.18 Å−1 and (c) Q = 2.91 Å−1, and exponential fits to the data (solid lines). | ||
Additionally, the time evolution of F(Q) at the molecular correlation level was observed at similar Q-values as for 150 mbar D2 hydrogenation, i.e. Q = 1.18 Å−1, Q = 2.91 Å−1, Q = 4.09 Å−1. The fits results in the following rate constants: k5(Q = 1.18 Å−1) = 1.00 ± 0.10 h−1 (R2 = 0.966), k5(Q = 2.91 Å−1) = 1.03 ± 0.17 h−1 (R2 = 0.907) and k5(Q = 4.09 Å−1) = 1.45 ± 0.53 h−1 (R2 = 0.624).
The rate constants found for toluene-d8 hydrogenation under two different pressures (150 and 250 mbar) are compared in Table 1. Changes in the Bragg peak region related to liquid reorganisation and processes involving D2 occurred faster when the higher pressure of D2 was used. In this higher-pressure reaction it transpired that a double-exponential fit was not required, suggesting that the two processes identified at the lower pressure have become too similar in terms of their rate constant to be able to differentiate them by this method. As expected the reaction, as observed via the molecular changes, also occurs much more rapidly at double the gaseous reagent pressure with the rate constants found to be ∼2.1 times faster than when 150 mbar D2 was used.
| 150 mbar D2 | 250 mbar D2 | |
|---|---|---|
| a For k3 and k5 values with the smallest error and the highest R2 found were chosen. | ||
| Processes involving D2 | k 1 = 1.08 ± 0.06 h−1 (R2 = 0.998) | k 4 = 1.56 ± 0.10 h−1 (R2 = 0.984) |
| Reorganisation of liquid inside pores | k 2 = 0.22 ± 0.09 h−1 (R2 = 0.998) | |
| Chemical reactiona | k 3 = 0.48 ± 0.03 h−1 (R2 = 0.944) | k 5 = 1.00 ± 0.10 h−1 (R2 = 0.966) |
The main assumption of isotopic substitution approach widely employed in neutron scattering studies is that it does not affect the structure of a compound. However, using different isotopes as the reagents in a reaction can have an influence on the chemical reaction rates and kinetic isotopic effects may, therefore, be revealed. This effect arises from the fact that heavier isotopes bond more strongly than the lighter ones, so they result in a lower potential energy of reactants causing a decrease in the reaction rate, i.e. higher activation energy is needed for reaction to proceed. To investigate whether a kinetic isotope effect was present and also whether it was feasible to use protiated reagents in the current setup, the hydrogenation of toluene-h8 was compared with the analogous toluene-d8 experiment at 150 mbar D2.
The analysis of changes of total structure factor for toluene-h8 hydrogenation at Q-value corresponding to the first Bragg reflection (i.e. Q = 0.15 Å−1) showed a different trend when compared with the reaction with deuteriated reagent, Fig. 8. In the former case, it can be fitted with double exponential decay curve instead of growth. This is due to the fact that contrast between toluene-h8 to bulk silica and contrast between methylcyclohexane-h8d6, the final product of the reaction, to bulk silica are: ΔSLD = 2.52 × 10⁻⁶ Å−2 and ΔSLD = 0.94 × 10⁻⁶ Å−2, respectively. Therefore, during this reaction a decrease in the intensity of Bragg reflections is observed. For changes in the Bragg scattering region two rate constants were found. A fast component, k6 = 1.09 ± 0.05 h−1 (R2 = 0.999), which describes the absorption processes of D2 and a slower component, that corresponds to the liquid reorganisation, k7 = 0.17 ± 0.05 h−1 (R2 = 0.999). These values are similar to those found for the corresponding processes during the toluene-d8 hydrogenation. As expected, this shows that in this system there is no significant influence of isotopic substitution on these two steps in the reaction process. Due to the lower contrast for structural features at higher Q-values it is unfortunately not possible to reliably fit the changes in F(Q) data at molecular length scales. Therefore, in order to compare the rates using the protiated and deuteriated toluene the time at which the F(Q) stopped changing was examined. At Q = 1.18 Å−1, the time course for both reactions showed that there was little change after 8 h of reaction. This suggests that there was no kinetic isotopic effect in the molecular length scale aspects of the reaction either. This was confirmed by studies of the reaction for toluene-d8 and toluene-h8 in analogous experiments but where the catalyst samples were extracted with methanol after 3 h of reaction and the extraction phase analysed using GC. The results showed that toluene conversion for both isotopic substitutions was similar, ∼30%.
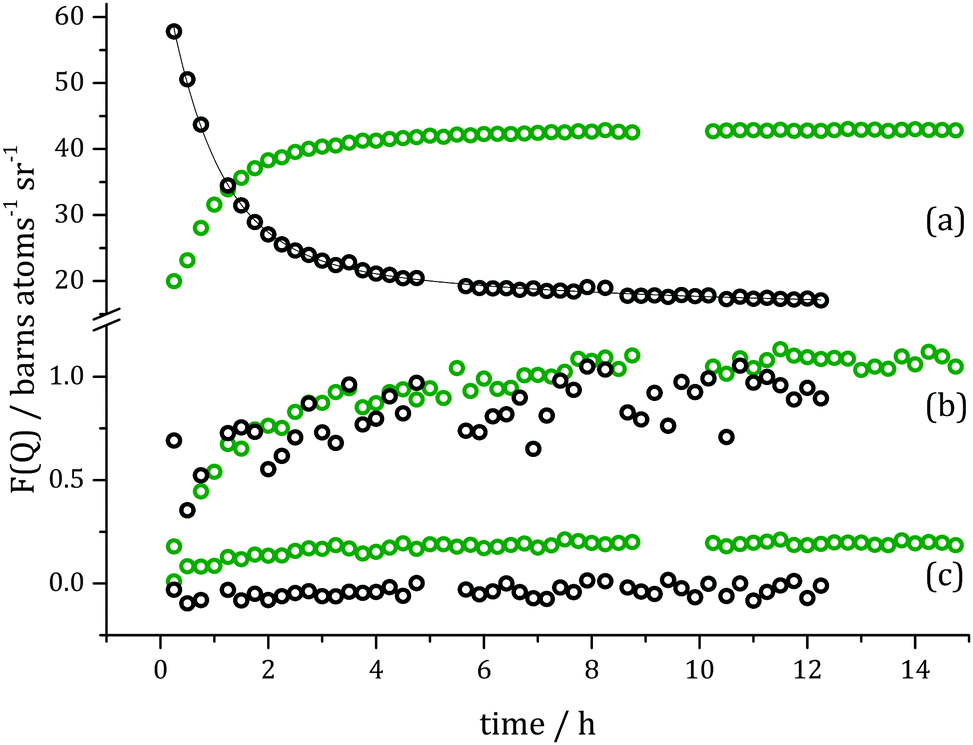 | ||
| Fig. 8 Changes of F(Q) over the course of toluene-h8 (black symbols) and toluene-d8 (green symbols) hydrogenation by 150 mbar D2 at specific Q values: (a) Q = 0.15 Å−1, (b) Q = 1.18 Å−1 and (c) Q = 2.90 Å−1. | ||
To increase the capability of total neutron scattering as a technique used for following heterogeneous process kinetics it is necessary to use a complementary technique which could supply missing information on the molecular level when protiated reagents are used. We have recently applied in situ NMR techniques in combination with total neutron scattering in to investigate benzene-h6 hydrogenation using D2, and which will be reported in a future manuscript.
Conclusions
Total neutron scattering has been employed to investigate the set of toluene hydrogenation reactions, for which the detailed kinetic information was obtained. In the process under 150 mbar D2 involving toluene-d8 three different rate constants were identified, from which the one describing liquid rearrangement in the pores, being a consequence of a product formation, was the slowest. With the increased D2 pressure (250 mbar) the expected increase in the chemical reaction rate was observed. The rate constants for processes involving D2 and liquid rearrangement inside pores were impossible to distinguish, but the combined process occurring at the same length scale was accelerated when the higher pressure was used. Additionally, the comparison between two isotopic analogous experiments for toluene-h8 and toluene-d8 under 150 mbar D2 was performed. It showed that there was no kinetic isotopic effect present in either of the steps of heterogeneous process observed. The use of protiated starting material does not adversely affect the ability for determining the rate constants for processes involving D2 or liquid reorganisation, but it is more difficult to observe changes during the heterogeneous process at the molecular level, so for chemical reaction. In the latter case, complementary techniques that reveal detailed chemical structure such as the NMR are required in combination with the neutron measurements. Nevertheless, this indicates that traditional neutron scattering contrast techniques such as isotopic difference measurements may be employed in the present technique, improving the depth of information it is possible to obtain.Acknowledgements
We thank the Science and Technology Facilities Council for the allocated beamtime at the ISIS Pulsed Neutron and Muon Source (experiment: RB1310475) as well as funding a studentship for MF. The UK Catalysis Hub is kindly thanked for resources and support provided via our membership of the UK Catalysis Hub Consortium and funded by EPSRC (grants EP/K014706/1, EP/K014668/1, EP/K014854/1EP/K014714/1 and EP/M013219/1). Supporting data are openly available on Queen’s University, Belfast Research Portal http://pure.qub.ac.uk/portal/en/datasets.Notes and references
- F. Zaera, Catal. Lett., 2012, 142, 501 CrossRef CAS.
- K. P. de Jong, in Synthesis of Solid Catalysts, ed. K. P. de Jong, Wiley-VCH Verlag GmbH & Co. KGaA, Weinheim, 2009, vol. 1, pp. 1–11 Search PubMed.
- H. Topsøe, J. Catal., 2003, 216, 155 CrossRef.
- B. M. Weckhuysen, Chem. Soc. Rev., 2010, 39, 4557–4559 RSC.
- L. F. Gladden, M. D. Mantle and A. J. Sederman, Adv. Catal., 2006, 50, 1 CAS.
- H. G. Manyar, R. Morgan, K. Morgan, B. Yang, P. Hu, J. Szlachetko, J. Sá and C. Hardacre, Catal.: Sci. Technol., 2013, 3, 1497 CAS.
- H. Daly, H. G. Manyar, R. Morgan, J. M. Thompson, J.-J. Delgado, R. Burch and C. Hardacre, ACS Catal., 2014, 4(8), 2470 CrossRef CAS.
- H. Jobic, Curr. Opin. Solid State Mater. Sci., 2002, 6, 415 CrossRef CAS.
- T. G. A. Youngs, H. Manyar, D. T. Bowron, L. F. Gladden and C. Hardacre, Chem. Sci., 2013, 4, 3484 RSC.
- T. Kandemir, F. Girgsdies, T. C. Hansen, K. D. Liss, I. Kasatkin, E. L. Kunkes, G. Wawsnick, N. Jacobsen, R. Schlögl and M. Behrens, Angew. Chem., Int. Ed., 2013, 52, 5166 CrossRef CAS PubMed.
- T. C. Hansen and H. Kohlmann, Z. Anorg. Allg. Chem., 2014, 640, 3044 CrossRef CAS.
- R. I. Walton, R. J. Francis, P. S. Halasyamani, D. O'Hare, R. I. Smith, R. Done and R. J. Humphreys, Rev. Sci. Instrum., 1999, 70, 3391 CrossRef CAS.
- D. T. Bowron, A. K. Soper, K. Jones, S. Ansell, S. Birch, J. Norris, L. Perrott, D. Riedel, N. J. Rhodes, S. R. Wakefield, A. Botti, M.-A. Ricci, F. Grazzi and M. Zoppi, Rev. Sci. Instrum., 2010, 81, 033905 CrossRef CAS PubMed.
- A. K. Soper, Rutherford Appleton Laboratory Technical Report RAL-TR-2011-013, 2011. GudrunN and GudrunX. Programs for correcting raw neutron and x-ray total scattering data to differential cross section (http://purl.org/net/epubs/work/56240).
- A. K. Soper, Int. Scholarly Res. Not., 2013, 2013, 279463 Search PubMed.
- A. K. Soper, Chem. Phys. Lett., 2013, 590, 1 CrossRef CAS PubMed.
- M. Falkowska, D. T. Bowron, H. G. Manyar, C. Hardacre and T. G. A. Youngs, ChemPhysChem, 2016 DOI:10.1002/cphc.201600149.
Footnote |
| † Electronic supplementary information (ESI) available: Raw neutron experimental data. See DOI: 10.1039/c6cp01494a |
| This journal is © the Owner Societies 2016 |