 Open Access Article
Creative Commons Attribution 3.0 Unported Licence
High resolution GHz and THz (FTIR) spectroscopy and theory of parity violation and tunneling for 1,2-dithiine (C4H4S2) as a candidate for measuring the parity violating energy difference between enantiomers of chiral molecules†
S.
Albert
ab,
I.
Bolotova
a,
Z.
Chen
a,
C.
Fábri
a,
L'.
Horný
a,
M.
Quack
*a,
G.
Seyfang
a and
D.
Zindel
a
aPhysical Chemistry, ETH Zurich, CH-8093 Zurich, Switzerland. E-mail: martin@quack.ch; Fax: +41-44-632-1021; Tel: +41-44-632-4421
bSwiss Light Source, PSI Villigen, CH-5232 Villigen, Switzerland
First published on 21st July 2016
Abstract
We report high resolution spectroscopic results of 1,2-dithiine-(1,2-dithia-3,5-cyclohexadiene, C4H4S2) in the gigahertz and terahertz spectroscopic ranges and exploratory theoretical calculations of parity violation and tunneling processes in view of a possible experimental determination of the parity violating energy difference ΔpvE in this chiral molecule. Theory predicts that the parity violating energy difference between the enantiomers in their ground state (ΔpvE ≃ 1.1 × 10⁻¹¹(hc) cm−1) is in principle measurable as it is much larger than the calculated tunneling splitting for the symmetrical potential ΔE± < 10−24 (hc) cm−1. With a planar transition state for stereomutation at about 2500 cm−1 tunneling splitting becomes appreciable above 2300 cm−1. This makes levels of well-defined parity accessible to parity selection by the available powerful infrared lasers and thus useful for one of the existing experimental approaches towards molecular parity violation. The new GHz spectroscopy leads to greatly improved ground state rotational parameters for 1,2-dithiine. These are used as starting points for the first successful analyses of high resolution interferometric Fourier transform infrared (FTIR, THz) spectra of the fundamentals ν17 (1308.873 cm−1 or 39.23903 THz), ν22 (623.094 cm−1 or 18.67989 THz) and ν3 (1544.900 cm−1 or 46.314937 THz) for which highly accurate spectroscopic parameters are reported. The results are discussed in relation to current efforts to measure ΔpvE.
1 Introduction
According to the traditional point of view both in the framework of classical molecular structure1–6 and within the ordinary quantum theory of molecules retaining only the electromagnetic force7,8 the ground states of the enantiomers of chiral molecules are energetically exactly equivalent by symmetry.1,5–10 This would result in a reaction enthalpy ΔRH⊖0 = 0 exactly for the stereomutation reaction (1). However, the situation has fundamentally changed with the discovery of parity violation.11–21 In this case one predicts a small “parity violating” energy difference ΔpvE0 between the ground states of the two enantiomers, leading to the prediction of a non-zero parity violating reaction enthalpy ΔpvH⊖0:| P ⇌ M ΔpvH⊖0 = NAΔpvE0 | (1) |
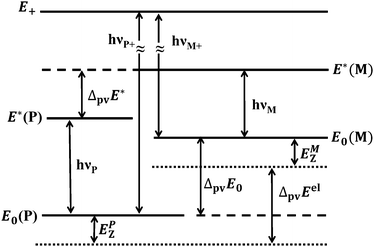 | ||
| Fig. 1 Scheme of energy levels including parity violation in 1,2-dithiine (not to scale), see also ref. 44 and 47. | ||
In a first experimental scheme originally proposed by Letokhov and coworkers30,49 one measures the difference in line positions, say, in the infrared spectrum of the separate enantiomers (hνM − hνP in Fig. 1). This provides the difference (ΔpvE* − ΔpvE0) between two parity violating energy differences (ΔpvE* and ΔpvE0) in two different energy levels. Early attempts towards such experiments were reported by Kompanets et al.49 and Arimondo, Glorieux and Oka50 (both unsuccessful). The work of Kompanets et al. on CHFClBr was further pursued by our group using high resolution microwave and infrared spectroscopy in molecular beams with detailed rovibrational analyses in order to identify suitable lines for detecting parity violation in these spectra.57 These results of our group were subsequently used to carry out experiments at very high resolution by the Paris group58 achieving about Δν/ν ≈ 10−13 relative uncertainty, compared to theoretical predictions of shifts of the order Δν/ν ≃ 10−16, ref. 39–42. Recent progress by two groups following this scheme currently can be seen from ref. 59 and 60. One can estimate that successful experiments of this kind might be possible in the near future for chiral molecules involving very heavy atoms which have relatively large values of ΔpvE because of the well-known scaling with atomic number.35–48,61 Here it must be noted that atomic spectroscopy has already been successful to detect parity violation for very heavy atoms such as Cs, Bi etc.,62–67 where a current limitation in the fundamental analysis actually results from uncertainties in the theory for such heavy-atom systems, which will be also a drawback if such experiments are successful on related molecules (see ref. 9 and 29 for a discussion). Another drawback of this first scheme is that it cannot provide ΔpvE0 (or ΔpvE*) separately. Also, this scheme requires the synthesis of separate enantiomers. We shall not discuss this scheme further here.
In the second scheme, proposed in ref. 52, one uses an excited intermediate level of well-defined parity (marked E+ for positive parity in Fig. 1) which can be reached by electric dipole transitions from both enantiomers (marked hνP+ and hνM+ in Fig. 1). Then one can obtain ΔpvE0 by a combination difference (hνP+ − hνM+). Alternatively, one can use a time dependent variant of this scheme whereby a sequence of two electric dipole transitions to a superposition state of the two enantiomers is prepared. This superposition state has a well-defined parity initially (say, with a probability p−(t = 0) = 1), which evolves in time according to eqn (2) for the complementary population of the state of positive parity detectable with high sensitivity on a “zero background”9,52
| p+(t) = 1 − p−(t) = sin2(πΔpvEt/h). | (2) |
We should note that a general condition for both experimental schemes is that the parity violating energy difference ΔpvE is much larger than the tunneling splitting ΔE± calculated using the hypothetical symmetrical (parity conserving) Hamiltonian, thus
| |ΔpvE| ≫ |ΔE±|. | (3) |
Indeed, this condition is a necessary requirement for an energy level scheme as in Fig. 1 to be applicable at all. The inequality (3) does not hold for chiral molecules such as HOOH and HSSH9,48,72 but has been predicted theoretically to be fullfilled for ClOOCl68,69 and ClSSCl,71 for example, and also for the case of 1,2-dithiine to be studied here.
Current spectroscopic techniques result in some limitations on the complexity of the chiral molecules which can be studied. Also spectroscopically accessible states of well-defined parity must be identified by appropriate high resolution analyses. Such states can be found in electronically excited states, for instance, in molecules such as difluoroallene76 or they can be found in the electronic ground state at energies near or above the barrier for stereomutation as shown for ClOOCl.68,69 One can thus identify the following steps in preparing for experiments on ΔpvE in chiral molecules.
(1) Identify suitable chiral molecules by approximate exploratory theoretical calculations, demonstrating sufficiently large absolute values |ΔpvE| to be measurable and small absolute values |ΔE±| for the tunneling splitting such that the inequality (3) holds.
(2) Carry out the necessary synthesis and exploratory high resolution spectroscopic analyses.
(3) Identify spectroscopic lines suitable to carry out the experiment according to the second scheme.
(4) Carry out the experiment to measure p+(t) according to eqn (2) with significant accuracy to provide ΔpvE.
(5) Analyse highly accurate experimental results of ΔpvE by means of highly accurate theoretical calculations to extract fundamental parameters of the standard model of particle physics (SMPP) such as the Weinberg parameter which may be significantly different in experiments of high energy physics and “low energy atomic and molecular physics” spectroscopic experiments, for instance.9
In the present work we show that the chiral molecule 1,2-dithiine is a possible candidate for experiments on ΔpvE by carrying out in essence steps 1 and 2 of the program listed above. In Section 2 we show by theoretical calculations that 1,2-dithiine has a favourable, large absolute value |ΔpvE| and a very small ground state tunneling splitting |ΔE±| satisfying the inequality (3). Furthermore the barrier for stereomutation is calculated to be low enough for states above the barrier with well-defined parity to be accessible by the currently available high resolution lasers in the infrared range.70
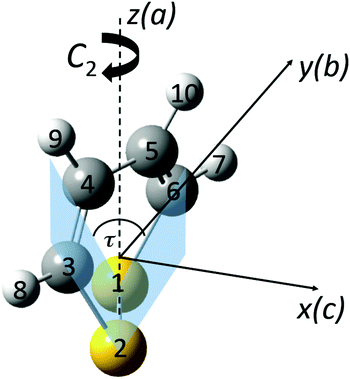
1,2-Dithiine as shown in Fig. 2 is a six membered chiral ring compound of C2 symmetry which has been synthesized in ref. 77 and 78 and since this early synthesis combined with the finding that 1,2-dithiines occur as natural products79,80 there have been substantial experimental and theoretical studies, of which we can cite here only a selection81–89 including also in particular a review82 and a recent theoretical study of parity violation in the series of molecules starting with dioxine (C4H4O2) leading to 1,2-dithiine and the higher members of this series with Se, Te, and Po83 and studies of electronic structure and antiaromaticity.84–89 Disulfides in general have been discussed as candidates for experimental studies of parity violation by us before,71,72 recently extended to the slightly more complex trisulfane.90 1,2-Dithiine is spectroscopically already quite complex but recent experimental progress has made molecules of similar complexity such as pyridine, pyrimidine, fluorobenzene, chlorobenzene,91 and phenol as well as naphthalene and azulene accessible to high resolution infrared spectroscopic analyses (see ref. 91, and references cited therein).
The outline of the present paper is briefly as follows. In Section 2 we present the theory for tunneling and parity violation. In Section 3 we discuss our experiments on the synthesis, high resolution THz (FTIR) and also GHz spectroscopy. In Section 4 we discuss the spectroscopic assignments and in Section 5 an extended rotational analysis of the ground state of 1,2-dithiine as well as of three of the stronger fundamentals ν22 (ν0 = 623.3121 cm−1), ν17 (ν0 = 1308.8724 cm−1) and ν3 (ν0 = 1544.9004 cm−1) demonstrating the feasibility of such analyses for this chiral molecule, for which the infrared spectra have not been analysed at high resolution before, while some limited microwave data existed already75 with a total of only 15 microwave lines for the normal isotopomer. We conclude with a detailed discussion and an outlook towards the feasibility of experiments to measure parity violation in this chiral molecule. A preliminary report on the present research has been given in ref. 92–94.
2 Theory
The interesting non-planar structure of 1,2-dithiine is shown in Fig. 2. The equilibrium structure of the electronic ground state (![[X with combining tilde]](https://www.rsc.org/images/entities/char_0058_0303.gif) 1A) was optimized at the MP2/cc-pVTZ, MP2/cc-pVQZ and CCSD(T)/cc-pVTZ levels of theory. These computations were carried out using the Gaussian 0973 and Molpro95,96 program packages. The planar ring structure would formally have 8 π-electrons and thus would be antiaromatic and destabilized. However, this effect is reduced by avoiding the planar geometry. The predicted ring structure possesses C2 symmetry and the optimized structural parameters are summarized in Table 1 for the equilibrium geometry. The calculated structure agrees well with an experimental rs-structure from microwave spectroscopy.75 The corresponding theoretical rotational constants are compared with the experimental results in Section 4 below in more detail. Again, the overall agreement is remarkably good. The only structural parameter which shows a large difference between experiment and theory is the S–S bond length differing by about 3 pm when compared with the CCSD(T) results, where one must consider also the different physical meanings of rs and re structures. The calculated harmonic wavenumbers
1A) was optimized at the MP2/cc-pVTZ, MP2/cc-pVQZ and CCSD(T)/cc-pVTZ levels of theory. These computations were carried out using the Gaussian 0973 and Molpro95,96 program packages. The planar ring structure would formally have 8 π-electrons and thus would be antiaromatic and destabilized. However, this effect is reduced by avoiding the planar geometry. The predicted ring structure possesses C2 symmetry and the optimized structural parameters are summarized in Table 1 for the equilibrium geometry. The calculated structure agrees well with an experimental rs-structure from microwave spectroscopy.75 The corresponding theoretical rotational constants are compared with the experimental results in Section 4 below in more detail. Again, the overall agreement is remarkably good. The only structural parameter which shows a large difference between experiment and theory is the S–S bond length differing by about 3 pm when compared with the CCSD(T) results, where one must consider also the different physical meanings of rs and re structures. The calculated harmonic wavenumbers ![[small omega, Greek, tilde]](https://www.rsc.org/images/entities/i_char_e10f.gif) i, the vibrational fundamentals
i, the vibrational fundamentals ![[small nu, Greek, tilde]](https://www.rsc.org/images/entities/i_char_e0e1.gif) i (with anharmonic corrections) and the predicted integrated band strengths (in km mol−1) are given in Table 2. The most intense fundamental
i (with anharmonic corrections) and the predicted integrated band strengths (in km mol−1) are given in Table 2. The most intense fundamental ![[small nu, Greek, tilde]](https://www.rsc.org/images/entities/i_char_e0e1.gif) 22 = 623 cm−1 corresponds to a CH “out-of-plane” bending mode, followed by the ring twisting fundamental
22 = 623 cm−1 corresponds to a CH “out-of-plane” bending mode, followed by the ring twisting fundamental ![[small nu, Greek, tilde]](https://www.rsc.org/images/entities/i_char_e0e1.gif) 24 = 214 cm−1 and the CH “in-plane” bending fundamental
24 = 214 cm−1 and the CH “in-plane” bending fundamental ![[small nu, Greek, tilde]](https://www.rsc.org/images/entities/i_char_e0e1.gif) 17 = 1303 cm−1 where “out-of-plane” and “in-plane” have obviously only approximate meaning for this non-planar molecule. Further intense absorptions arise from the CC stretching polyads and the CH stretching polyads.
17 = 1303 cm−1 where “out-of-plane” and “in-plane” have obviously only approximate meaning for this non-planar molecule. Further intense absorptions arise from the CC stretching polyads and the CH stretching polyads.
![[X with combining tilde]](https://www.rsc.org/images/entities/char_0058_0303.gif) 1A1 of 1,2-dithiine (C2 symmetry, atom numbering as in Fig. 2). The MP2 calculations were done using the Gaussian 09 package73 and the CCSD(T) calculations using the Molpro program package.74 (We indicate: method/basis set as shown)
1A1 of 1,2-dithiine (C2 symmetry, atom numbering as in Fig. 2). The MP2 calculations were done using the Gaussian 09 package73 and the CCSD(T) calculations using the Molpro program package.74 (We indicate: method/basis set as shown)
| MP2/cc-pVTZ | MP2/cc-pVQZ | MP2/cc-pV5Z | CCSD(T)/cc-pVTZ | Exp.a | |
|---|---|---|---|---|---|
| a Experimental structural parameters from ref. 75 (rs structure). | |||||
| r(S1C6) | 176.21 | 175.58 | 175.17 | 177.59 | 175.9(4) |
| r(S1S2) | 206.23 | 204.77 | 203.88 | 208.35 | 205.1(3) |
| r(C5C6) | 135.08 | 134.91 | 134.93 | 134.89 | 135.3(3) |
| r(C4C5) | 144.71 | 144.44 | 144.36 | 146.12 | 145.1(1) |
| r(C6H7) | 108.21 | 108.16 | 108.16 | 108.32 | |
| r(C5H10) | 108.25 | 108.19 | 108.17 | 108.41 | |
| α(C6S1S2) | 97.99 | 98.12 | 98.19 | 98.27 | 98.7(2) |
| α(S1C6C5) | 121.39 | 121.17 | 121.07 | 121.88 | 121.4(2) |
| α(C4C5C6) | 124.18 | 124.14 | 124.07 | 124.40 | 124.2(2) |
| α(S1C6H7) | 116.65 | 116.77 | 116.90 | 116.09 | |
| α(C6C5H10) | 117.85 | 117.87 | 117.90 | 118.14 | |
| τ(C6S1S2C3) | 54.99 | 55.31 | 55.59 | 53.25 | 53.9 |
| τ(S2S1C6H7) | 141.14 | 141.07 | 141.02 | 141.82 | |
| τ(S2S1C6C5) | −42.27 | −42.37 | −42.51 | −41.11 | −41.2 |
| τ(S1C6C5H10) | −177.25 | −177.18 | −177.08 | −177.85 | |
![[small omega, Greek, tilde]](https://www.rsc.org/images/entities/i_char_e10f.gif) i (in cm−1), IR intensities (in km mol−1), and anharmonic fundamentals
i (in cm−1), IR intensities (in km mol−1), and anharmonic fundamentals ![[small nu, Greek, tilde]](https://www.rsc.org/images/entities/i_char_e0e1.gif) i (in cm−1) of 1,2-dithiine as calculated using the Gaussian 09 package73
i (in cm−1) of 1,2-dithiine as calculated using the Gaussian 09 package73
| Mode | Symmetry |
![[small omega, Greek, tilde]](https://www.rsc.org/images/entities/i_char_e10f.gif) i
(MP2/cc-pVTZ)
i
(MP2/cc-pVTZ) |
Intensity |
![[small nu, Greek, tilde]](https://www.rsc.org/images/entities/i_char_e0e1.gif) i
(MP2/cc-pVTZ)
i
(MP2/cc-pVTZ) |
Approximate description |
|---|---|---|---|---|---|
| 1 | A | 3226 | 8.495 | 3085 | CH stretches |
| 2 | A | 3204 | 0.206 | 3077 | CH stretches |
| 3 | A | 1568 | 11.063 | 1522 | CC stretches |
| 4 | A | 1390 | 4.468 | 1349 | CH in-plane bends |
| 5 | A | 1181 | 0.098 | 1164 | CH in-plane bends |
| 6 | A | 997 | 2.670 | 981 | C2C3 stretch |
| 7 | A | 938 | 0.814 | 920 | CH out-of-plane bends |
| 8 | A | 780 | 3.451 | 767 | CH out-of-plane bends |
| 9 | A | 740 | 4.977 | 728 | CS sym. Stretches |
| 10 | A | 573 | 0.100 | 565 | SS stretch, CH out-of-plane bends |
| 11 | A | 523 | 0.068 | 516 | SS stretch, CH out-of-plane bends |
| 12 | A | 448 | 0.243 | 441 | CCC in-plane bends |
| 13 | A | 204 | 0.001 | 200 | Ring pucker |
| 14 | B | 3221 | 5.420 | 3115 | CH stretches |
| 15 | B | 3197 | 0.882 | 3075 | CH stretches |
| 16 | B | 1610 | 0.210 | 1563 | CC stretches |
| 17 | B | 1329 | 14.809 | 1303 | CH in-plane bends |
| 18 | B | 1184 | 1.162 | 1166 | CH in-plane bends |
| 19 | B | 929 | 0.139 | 910 | CH out-of-plane bends |
| 20 | B | 858 | 2.711 | 847 | CCC in-plane bends |
| 21 | B | 702 | 1.495 | 684 | CS asym. stretches |
| 22 | B | 632 | 92.517 | 623 | CH out-of-plane bends |
| 23 | B | 315 | 0.083 | 312 | CSS in-plane bends |
| 24 | B | 214 | 12.041 | 214 | CCC out-of-plane bends |
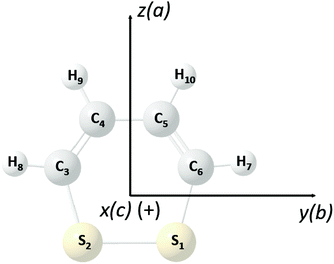
The twisted structure with a dihedral angle τ(C6–S1–S2–C3) of 53.25 degrees gives rise to P and M enantiomorphism, with a planar structure of C2v symmetry being the transition state for interconversion between the two enantiomers (Fig. 3 and Table 3). Formally, this corresponds to the cis-transition state of general disulfides with internal rotation.71,72 The S–S bond length is elongated to 217.8 pm (CCSD(T)/cc-pVDZ level) and one finds as angles α(C6–S1–S2) = 104.43° and α(S1–C6–C5) = 129.72° for the transition state which are the only structural parameters apart from the obvious dihedral angles differing substantially from the equilibrium structures. The transition state as calculated at the CCSD(T)/cc-pVQZ level of theory is found to be about 2500 cm−1 above the potential minimum (without vibrational zero-point energy correction). The planar structure is shown in Fig. 3 which also indicates the atom numbering with C6, S1, S2, C3, C4, C5 and H7, H8, H9, H10. The structural parameters are summarized in Table 3 and the harmonic wavenumbers of the transition state are given in Table 4 with the species in C2v symmetry.
| MP2/cc-pVTZ | MP2/cc-pVQZ | CCSD(T)/cc-pVDZ | |
|---|---|---|---|
| r(S1C6) | 175.36 | 174.81 | 177.97 |
| r(S1S2) | 212.78 | 211.46 | 217.82 |
| r(C5C6) | 134.18 | 133.95 | 135.75 |
| r(C4C5) | 145.37 | 145.18 | 147.54 |
| r(C6H7) | 108.30 | 108.24 | 109.94 |
| r(C5H10) | 108.10 | 108.04 | 109.75 |
| α(C6S1S2) | 104.73 | 104.88 | 104.43 |
| α(S1C6C5) | 129.57 | 129.49 | 129.72 |
| α(C4C5C6) | 125.70 | 125.63 | 125.85 |
| α(S1C6H7) | 109.87 | 109.85 | 109.75 |
| α(C6C5H10) | 116.67 | 116.71 | 117.01 |
![[small omega, Greek, tilde]](https://www.rsc.org/images/entities/i_char_e10f.gif) i (in cm−1) of the planar transition state for the stereomutation of 1,2-dithiine
i (in cm−1) of the planar transition state for the stereomutation of 1,2-dithiine  as calculated using the Gaussian 09 program package73
| Mode | Symmetry |
![[small omega, Greek, tilde]](https://www.rsc.org/images/entities/i_char_e10f.gif) i
(MP2/cc-VTZ)
i
(MP2/cc-VTZ) |
![[small omega, Greek, tilde]](https://www.rsc.org/images/entities/i_char_e10f.gif) i
(MP2/cc-pVQZ)
i
(MP2/cc-pVQZ) |
|---|---|---|---|
| 1 | A1 | 3233 | 3231 |
| 2 | A1 | 3202 | 3202 |
| 3 | A1 | 1628 | 1626 |
| 3 | A1 | 1403 | 1402 |
| 5 | A1 | 1209 | 1208 |
| 6 | A1 | 985 | 985 |
| 7 | A1 | 729 | 732 |
| 8 | A1 | 513 | 515 |
| 9 | A1 | 458 | 462 |
| 10 | A2 | 927 | 928 |
| 11 | A2 | 746 | 743 |
| 12 | A2 | 503 | 509 |
| 13 | A2 | i162 | i168 |
| 14 | B1 | 926 | 926 |
| 15 | B1 | 642 | 640 |
| 16 | B1 | 263 | 264 |
| 17 | B2 | 3222 | 3221 |
| 18 | B2 | 3198 | 3199 |
| 19 | B2 | 1645 | 1644 |
| 20 | B2 | 1341 | 1342 |
| 21 | B2 | 1213 | 1212 |
| 22 | B2 | 850 | 851 |
| 23 | B2 | 678 | 681 |
| 24 | B2 | 314 | 315 |
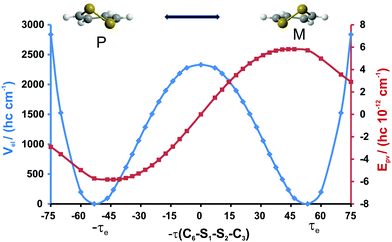
The parity-conserving electronic (Vel) and parity-violating potentials (Epv) computed along the IRC interconversion path are given in Fig. 4. Epv was computed with our recently developed44,97 coupled-cluster singles and doubles linear response approach (CCSD-LR) using the Zurich version of the PSI3 program.98Epv is obtained as a linear response function of the coupled cluster wavefunction with an effective one-electron spin–orbit coupling serving as a static perturbation. We employed a decontracted cc-pVDZ basis set augmented with a set of steep s and p functions. Details of the theoretical approach have been described in ref. 44.
Based on our calculations, and as can be seen from Fig. 4, we predict the P-enantiomer to be stabilized with respect to the M-enantiomer. The computed value of Epv for P-1,2-dithiine is Epv/(hc) = −5.72 × 10⁻¹² cm−1. The signed electronic parity violating the energy difference ΔpvEel between the two enantiomers as defined by eqn (4) is obtained to be
| ΔpvEel(qe) = Eelpv(qM) − Eelpv(qP) = (hc) 11.44 × 10⁻¹² cm−1 | (4) |
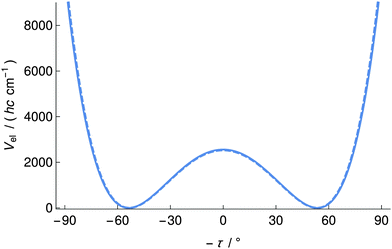
In order to estimate the ground-state tunneling splitting (ΔE±) the τ(C6–S1–S2–C3) dihedral angle (denoted by τ) was selected to be the reaction coordinate describing the interconversion of the two puckered enantiomers through a planar transition state. For every energy value as a function of τ the remaining internal coordinates were optimized at the MP2/cc-pVTZ level of theory and the resulting structures were then used for single-point CCSD(T)/cc-pVQZ electronic structure computations. This definition of the reaction coordinate was justified by MP2/cc-pVTZ IRC computations, where the resulting IRC path connecting the planar transition state with the two enantiomeric potential minima was found to be almost identical to the 1D MP2/cc-pVTZ reaction path following simply a variation of τ. The structural parameters as a function of the reaction coordinate values qi and the harmonic wavenumbers as a function of q are given in the ESI.†
We employed the quasi-adiabatic channel reaction path Hamiltonian approach (RPH)99–101 to compute the tunneling splittings ΔE±. In conjunction with the Born–Oppenheimer potential (CCSD(T)/cc-pVQZ, see the dashed line in Fig. 5) we used Cartesian coordinates, energy gradients and harmonic force fields (all of these quantities were obtained at the MP2/cc-pVTZ level of theory) along the reaction path to generate the lowest quasi-adiabatic channel potential (Fig. 5, solid line). The barrier heights are 2529 cm−1 (Born–Oppenheimer potential) and 2559 cm−1 (lowest quasi-adiabatic channel potential). The RPH energy levels corresponding to the lowest quasi-adiabatic channel potential are given in Table 5. It can be seen from Table 5 that the tunneling splittings increase as the energy levels approach the barrier. At v = 12, about 2170 cm−1 above the minimum of the channel and still almost 400 cm−1 below the barrier the tunneling splitting of 0.1 cm−1 would be easily measurable in the infrared region. This large value is quite remarkable in view of the essentially pure “heavy atom” motion for the tunneling process.
| v = 0 | 0.00 (4 × 10⁻²⁵) | v = 10 | 1860.60 (1.4 × 10⁻⁴) |
| v = 1 | 202.39 (3 × 10⁻²²) | v = 11 | 2019.19 (4.2 × 10⁻³) |
| v = 2 | 401.84 (7 × 10⁻²⁰) | v = 12 | 2169.37 (0.10) |
| v = 3 | 598.16 (7 × 10⁻¹⁸) | v = 13 | 2307.68 (1.80) |
| v = 4 | 791.14 (4 × 10⁻¹⁷) | v = 14 | 2421.75 (17.48) |
| v = 5 | 980.51 (8 × 10⁻¹⁵) | v = 15 | 2514.78 (52.76) |
| v = 6 | 1166.00 (2 × 10⁻¹²) | v = 16 | 2636.09 (69.83) |
| v = 7 | 1347.23 (1.4 × 10⁻⁹) | v = 17 | 2779.88 (76.93) |
| v = 8 | 1523.79 (8.4 × 10⁻⁸) | v = 18 | 2936.34 (82.13) |
| v = 9 | 1695.15 (3.8 × 10⁻⁶) | v = 19 | 3102.76 (86.59) |
Since the tunneling splittings of the lowest tunneling doublets are very small owing to the high interconversion barrier and large effective tunneling mass, their direct variational computation is not easily possible due to numerical limitations. In order to estimate ΔE± we invoked an extrapolation technique that has been successfully used for the calculation of small tunneling splittings in ClSSCl.71 This method resulted in a ground-state tunneling splitting of ΔE±/(hc) = 4 × 10⁻²⁵ cm−1. We have also calculated the expectation value of ΔpvE in the torsional ground state and found it to differ by less than 10% from ΔpvEel. Thus the parity violating energy difference ΔpvE clearly exceeds the tunneling splittings for the hypothetical symmetrical potential by many orders of magnitude and 1,2-dithiine is a suitable candidate for measuring ΔpvE by the technique proposed in ref. 52 from this point of view. We shall discuss further spectroscopic aspects in the following sections.
3 Experimental
3.1 Synthesis of 1,2-dithiine
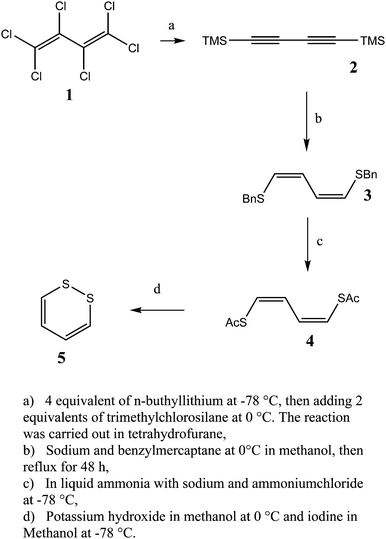
1,2-Dithiine was synthesized according to the scheme in Fig. 6 using a procedure which is a modification of ref. 81, as described here, because the original procedure from ref. 81, which was tried as well, did not give quite satisfactory results in step c.3.2 GHz measurements of 1,2-dithiine
The ground state pure rotational spectra of 1,2-dithiine have been recorded between 65 and 117 GHz using our GHz spectrometer described in detail in ref. 103 and only slightly modified here. It consists of an Agilent synthesizer (E8257D PSG, Agilent Technologies Option 520 UNX) working in the range 250 kHz to 20 GHz with a frequency resolution of 0.001 Hz and frequency locked to a 10 MHz-rubidium standard (FS725, Stanford Research Systems) for short-term stability and to a GPS standard (TM-4, Spectrum Instruments Inc.) for long-term stability. The signal is frequency multiplied by a factor of 6 (S10MS-AG, OML Inc.) and coupled out to free space via a conical W-band antenna (QWH-WCRR, QuinStar Technology Inc.) leading to an operation in the frequency range of 67 to 118 GHz. The beam is focused through Teflon lenses into a 2.5 m path length glass cell equipped with two Teflon windows and mounted in a Brewster angle to the incoming and outcoming beam. Finally the beam is detected with a two-channel indium antimonide (InSb) bolometer [QFI/2(2),QMC Instruments Ltd.] after passing through a second Teflon lens. All transitions were measured using the frequency modulation technique (second harmonic lock-in detection) with a modulation frequency of 50 kHz.The gas sample was prepared by introducing the vapour at a pressure of approximately 0.025 mbar (measured using two Baratron gauges 627B.1T and 627B11M, MKS Instruments) from a liquid sample to the 2.5 m glass cell, which was covered by an aluminum foil to prevent 1,2-dithiine from photochemical decomposition due to exposure to daylight. A typical measured linewidth (full-width-at-half-maximum) at 100 GHz was close to 200 kHz. Fig. 7 shows a survey spectrum in the GHz range.
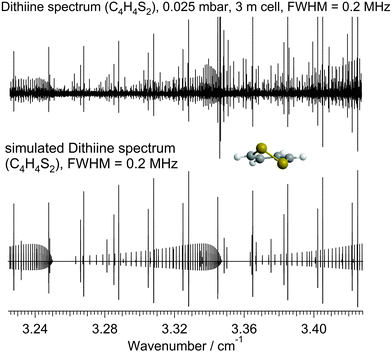 | ||
| Fig. 7 Rotational survey spectrum of the ground state of 1,2-dithiine in the range 3.23–3.42 cm−1 (97–102.5 GHz). The spectrum is frequency modulated. One recognizes the 600 MHz spacing of the strongest adjacent Ka lines. The pressure was p = 0.025 mbar, the path length was l = 2.5 m and the temperature was T = 295 K. The upper trace shows the measured rotational spectrum and the lower trace a simulation using the parameters in Table 9. | ||
3.3 FTIR measurements of 1,2-dithiine
The FTIR spectrum of 1,2-dithiine has been recorded using our Fourier transform spectrometer Bruker IFS 125 HR Zürich prototype (ZP 2001) in the region 600–3200 cm−1. The Zurich FTIR setup is described in detail in ref. 106–109. The effective resolution ranged from 0.001 cm−1 in the range 600–1000 cm−1, close to the Doppler width (FWHM), which ranged from 0.0006 cm−1 at 500 cm−1 to 0.0036 cm−1 at 3000 cm−1. A White-type cell with path lengths ranging from 3.2 m up to 19.2 m and a 3 m glass cell were used for room temperature (295 K) measurements. The sample pressure measured using a MKS Baratron was varied between 0.1 and 1 mbar. All spectra were self-apodized. Table 6 shows the measurement parameters. Apertures from 0.8 mm to 1.0 mm were used. The spectra were calibrated with OCS (600–1300 cm−1)104,109 and water (1280–1365 cm−1).105 In general, the calibrated wavenumbers are estimated to be accurate within 0.0002 cm−1. The resolutions specified in Table 6 correspond to nominal bandwidths defined as 0.9 × 1/dMOPD.109 The data given in the ESI† correspond to calibrated wavenumbers. Due to the instability of 1,2-dithiine some impurities arising from reaction products such as thiophene have been identified in the spectra. As a survey we also measured further spectra covering the range 800–5000 cm−1 at low resolution.| Region/cm−1 | 600–1000 | 1150–2200 | 2500–3600 |
| Resolution/cm−1 | 0.0008 | 0.001 | 0.001 |
| Windows | KBr | KBr | KBr |
| Source | Globar | Globar | Tungsten |
| Detector | MCT | MCT | InSb |
| Beam splitter | Ge:KBr | Ge:KBr | Si:CaF2 |
| Opt. filter/cm−1 | 550–1000 | 900–2500 | 550–5000 |
| Aperture/mm | 1.0 | 0.8 | 0.8 |
| ν mirror/(kHz) | 40 | 40 | 40 |
| Calib. gas | OCS104 | H2O105 | OCS104 |
4 Rotational and rovibrational assignments
4.1 General aspects and symmetry considerations
Table 7 includes the character tables for the point group C2, the molecular symmetry groups MS2 and MS4 including the possibility of tunneling following Longuet-Higgins114 and the systematic notation of ref. 110 for the symmetry species indicating parity explicitly by + and −. We also show in Table 7 the notation for the C2v symmetry group of the transition state and the induced representations Γ(MS2)↑(MS4) which indicate the symmetries of the tunneling sublevels. The nuclear spin statistical weights g arising from the 24 = 16 nuclear spin functions of the 4 protons (H7, H8, H9, H10) combined with the motional functions to Pauli allowed states are indicated for each symmetry. The combination of the rotational quantum numbers Ka and Kc for the asymmetric top in a totally symmetric vibronic level is given as well in Table 7, which also includes the number of vibrational modes of each symmetry (nΓv). According to the C2 symmetry the modes with A symmetry generate a-type transitions and the modes with B symmetry generate b- and c-type transitions. In a more detailed description the modes with A symmetry can split into A1 and A2 symmetry and the modes with B symmetry into B1 and B2 symmetry in the planar transition state as shown in Tables 2 and 4. As a consequence the fundamentals with B symmetry generate mainly c-type transitions and weak b-type transitions if they correspond to out-of-plane modes in the planar transition state (B1) or stronger b-type transitions than c-type transitions if they correspond to in-plane modes (B2) in the planar transition state. We have also calculated the electric dipole transition moment components μa, μb and μc for the vibrational fundamentals in order to assist the assignments. The fundamentals with A symmetry generate weak a-type transitions if the modes correspond to out-of-plane modes (A2) in the planar transition state because modes with A2 symmetry are not infrared active. This is important with respect to the ring puckering mode ν13 which would correspond to an A2 mode in the planar configuration. For that reason the fundamental ν13 is extremely weak. However, fundamentals with A symmetry generate strong a-type transitions if they correspond to in-plane modes in the planar transition state.| C 2 | E | C 2 | ||||||||
|---|---|---|---|---|---|---|---|---|---|---|
| M S 2 | E | (αβ) | μ | J | K a K c | n Γv | n Γs | g | Γ(MS2)↑MS4 | |
| A | A | 1 | 1 | μ z | J z | ee, eo | 13 | 10 | 10 | A+ + A− |
| B | B | 1 | −1 | μ x , μy | J x , Jy | oo, oe | 11 | 6 | 6 | B+ + B− |
| C 2v | E | C 2 | σ xz | σ yz | |||||||
|---|---|---|---|---|---|---|---|---|---|---|---|
| S 2*(MS4) | E | (αβ) | (αβ)* | E* | μ | J | K a K c | n Γv | n Γs | g | |
| A1 | A+ | 1 | 1 | 1 | 1 | μ z | ee | 9 | 10 | 10 | |
| A2 | A− | 1 | 1 | −1 | −1 | J z | eo | 4 | 0 | 10 | |
| B1 | B− | 1 | −1 | 1 | −1 | μ x | J y | oo | 3 | 0 | 6 |
| B2 | B+ | 1 | −1 | −1 | 1 | μ y | J x | oe | 8 | 6 | 6 |
4.2 Assignment procedure
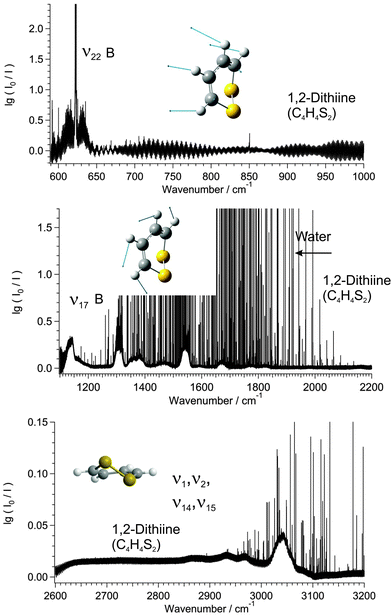
Fig. 7 shows part of the ground state rotational spectrum of 1,2-dithiine in the range 97–102.5 GHz. The assignment of the rotational transitions has been performed using the Pgopher program,115,116 a Loomis–Wood assignment program, and the WANG program117 up to J = 50. The infrared spectral region between 600 cm−1 and 1000 cm−1 as illustrated in Fig. 8 shows one strong absorption feature, and the region between 1150 cm−1 and 2200 cm−1 shows two strong absorption bands of 1,2-dithiine at 1310 cm−1 and 1590 cm−1. The strong sharp lines visible in Fig. 8 are due to water absorption lines. In the following description the term ‘subband’ or ‘series’ describes the transitions belonging to one Ka or Kc value. The assignment of the observed rovibrational transitions belonging to a particular subband consisting of P and R branches has been carried out efficiently using an interactive Loomis–Wood (LW) assignment program118 (see also ref. 109 and 119) previously designed for linear molecules.120–122 This limitation is, however, only superficial as the assignment program has been used successfully for several asymmetric top molecules: CHClF2,123,124 CHCl2F,108,125 CDBrClF,106 pyridine, and pyrimidine.1264.3 Ground state of 1,2-dithiine
1,2-Dithiine is an asymmetric rotor with C2 symmetry, its only permanent electric dipole moment component lies along the a-axis (μa = 1.85 D75), allowing transitions obeying a-type selection rules (eo ↔ ee and oe ↔ oo) for rotational transitions. The assignment of the rotational transitions observed here was assisted by using previously reported spectroscopic parameters from Gillies et al.,75 which included only 15 transitions up to J = 5, Ka = 5. A total of 560 transitions were newly assigned up to J ≤ 50 and Ka ≤ 19 in the range of 65 to 117 GHz in the present work. The overview spectrum in Fig. 7 illustrates the rotational structure of 1,2-dithiine in the ground state such as the stronger aR-type transitions progressing nicely with separations between adjacent Ka lines by about 600 MHz, while the aQ-type transitions are overshadowed and clustered.4.4 The ν22 band of 1,2-dithiine
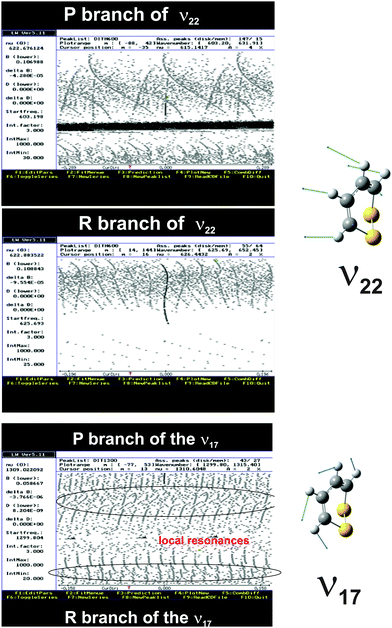
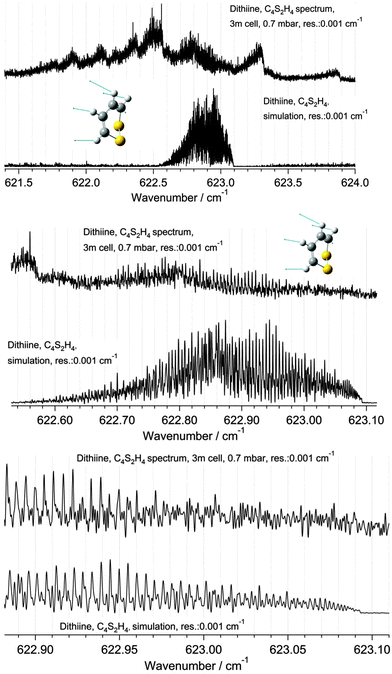
The ν22 band of 1,2-dithiine at 623 cm−1 (Fig. 8) is the strongest band in the IR absorption spectrum of 1,2-dithiine and consists of c- and b-type transitions. A comparison with the FTIR spectra of the already analysed aromatic molecules naphthalene,127 azulene128 and phenol129 illustrates that the ν22 fundamental of 1,2-dithiine corresponds to the strongest out-of-plane fundamentals of these aromatic molecules which are also dominated by strong Q branches due to c-type transitions. However, the planar aromatic molecules show no b-type transitions according to the C2v symmetry. The c- and b-type transitions are not split until Kc < 11. The c-type series were identified as P, R and Q branches with ee ↔ oe and eo ↔ oo transitions. In addition, some b-type lines (around 20) above Kc ≥ 11 have been assigned with ee ↔ oo and eo ↔ oe transitions. The spacing between two transitions of a c-type series is approximately 2A. The assignments were checked by comparison with ground state combination differences. Loomis–Wood diagrams of this band are shown in Fig. 9. The patterns of P and R branches of the c-type series are clearly visible in Fig. 9. The upper diagram shows the P branch and the middle diagram the R branch. The visible series are transitions where c- and b-types fall together. The lines have been assigned up to J ≤ 78 and Ka ≤ 73 and Kc ≤ 34.4.5 The ν17 band of 1,2-dithiine
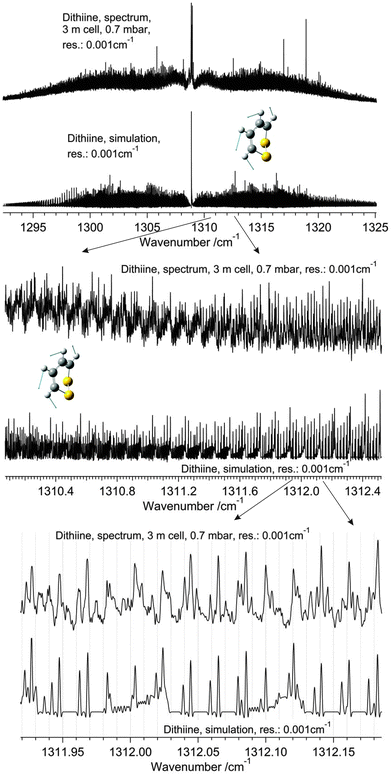
The observed spectrum of the ν17 fundamental of 1,2-dithiine at 1308 cm−1 clearly shows a characteristic b-type contour within the P and R branches and a c-type contour within the sharp center Q branch as shown in Fig. 8 (middle panel) and in more detail in Fig. 13. The shape of the b-type series is very similar to the shape of the b-type series assigned in the ν15 fundamental of fluorobenzene.130 However, due to the C2v symmetry of fluorobenzene the ν15 fundamental shows no c-type transition and therefore no visible Q branch. The ν17 band was chosen to be analyzed first, as a series of regularly spaced spectral patterns can be identified even through preliminary visual inspection. A simulated spectrum was generated using the estimated band center from inspecting the recorded high resolution data and the ground state spectroscopic parameters obtained from the analysis of the rotational spectra measured in the present work. The first attempt to assign the observed spectrum was based on the comparison with this simulated spectrum. The preliminarily assignments of the transitions were then confirmed by comparing the ground state combination differences with the GHz data. The simulated spectrum was refined by newly added assigned transitions and this process was continued in an iterative fashion until a few progressions of transitions were assigned. However, as the Loomis–Wood diagram of the P branch in Fig. 9 (lower part) illustrates, the b-type subbands are perturbed from J = 32 and onwards and therefore have only been assigned up to J ≤ 32. A closer look at the Loomis–Wood diagram indicates that the ν17 state is perturbed from at least two states: one with higher energy and smaller rotational C constant and the second with lower energy and larger rotational C constant. Only b-type transitions were assigned. The c-type transitions are not rotationally resolved in this band.4.6 The ν3 band of 1,2-dithiine
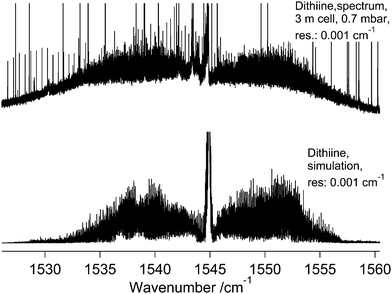
The ν3 band centered at 1544.9 cm−1 exhibits a strong absorption feature in the recorded spectrum as shown in the FTIR survey spectrum in Fig. 8 (middle trace). The strong sharp lines are due to water absorption. The assignment as the ν3 fundamental is consistent with the predicted intensity of this band being the highest in the region of 1400–1600 cm−1 (Table 2). A few strong a-type transitions with low Kc values were readily assigned with the aid of Loomis–Wood diagrams and simulated spectra using ground state constants and the estimated band center allowed a better prediction of more transitions to be assigned. As for the ν17 band, local perturbations were encountered and the assignment of lines was carried out up to J = 40 only. Also, the relatively noisy background prevented the transitions with Ka larger than 10 from being assigned.5 Results of the spectroscopic parameters and discussion
The rovibrational analysis has been carried out using Watson's A reduced effective Hamiltonians in the Ir representation (with the definitions of axes according to Fig. 2) up to sextic centrifugal distortion constants:117,131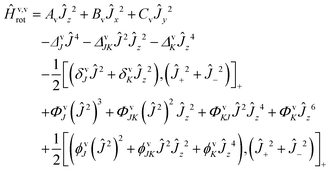 | (5) |
5.1 Rotational analysis and parameters of the ground state of 1,2-dithiine
560 rotational transitions in the GHz region were combined with the 15 lines reported in ref. 75 in a joint least squares analysis. Using only the three rotational constants and five centrifugal distortion constants included in the adjustment, the overall drms of the fit consisting of 575 rotational transitions is remarkably low (less than 7 kHz, or 0.0000002 cm−1). Table 8 lists all the spectroscopic parameters of the ground state of 1,2-dithiine. The rotational constants A, B and C obtained here compare well with those determined in the earlier microwave work. However, the previous study did not have a sufficient number of transitions (just a total of 15 lines) to accurately determine centrifugal distortion constants. In our work we observed more than 500 transitions and also covered a large range of the rotational spectrum with quantum numbers extending to J ≤ 50 and Ka ≤ 19, which led to a significant improvement in these centrifugal distortion constants. It was possible to observe intensity alternation in the spectra due to the nuclear spin statistical weights. According to Table 7 the expected intensity alternation in the rotationally resolved spectra of 1,2-dithiine is ee![[thin space (1/6-em)]](https://www.rsc.org/images/entities/char_2009.gif) :
:![[thin space (1/6-em)]](https://www.rsc.org/images/entities/char_2009.gif) eo
eo![[thin space (1/6-em)]](https://www.rsc.org/images/entities/char_2009.gif) :
:![[thin space (1/6-em)]](https://www.rsc.org/images/entities/char_2009.gif) oo
oo![[thin space (1/6-em)]](https://www.rsc.org/images/entities/char_2009.gif) :
:![[thin space (1/6-em)]](https://www.rsc.org/images/entities/char_2009.gif) oe = 10
oe = 10![[thin space (1/6-em)]](https://www.rsc.org/images/entities/char_2009.gif) :
:![[thin space (1/6-em)]](https://www.rsc.org/images/entities/char_2009.gif) 10
10![[thin space (1/6-em)]](https://www.rsc.org/images/entities/char_2009.gif) :
:![[thin space (1/6-em)]](https://www.rsc.org/images/entities/char_2009.gif) 6
6![[thin space (1/6-em)]](https://www.rsc.org/images/entities/char_2009.gif) :
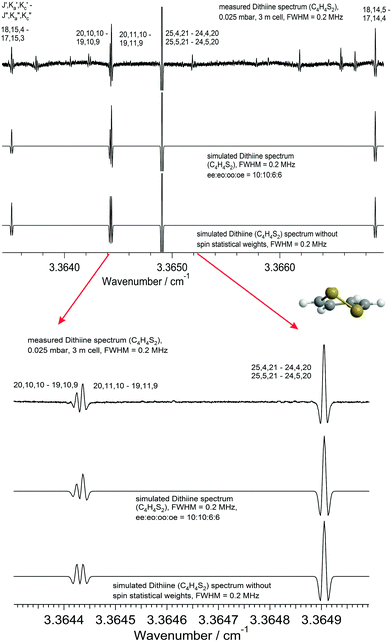
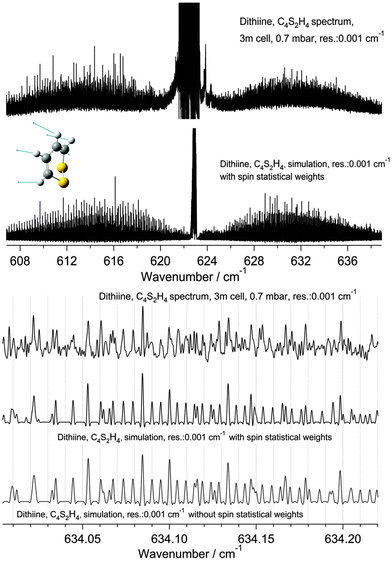
:![[thin space (1/6-em)]](https://www.rsc.org/images/entities/char_2009.gif) 6. Fig. 10 shows as an example a comparison of the strong R branch lines (upper trace) with simulations using the spectroscopic constants from Table 8 and using nuclear spin statistical weights (middle trace) and simulations without these weights (lower trace). The lower panel displays an enlarged part of the upper panel. Even for congested lines the effects of nuclear spin statistical weights are visible, confirming the assignments. This complete set of ground state rotational parameters (Table 8) plays an important role in the subsequent analysis of the dense rovibrational spectra in the preliminary assignment stage, especially when the upper state is perturbed.
6. Fig. 10 shows as an example a comparison of the strong R branch lines (upper trace) with simulations using the spectroscopic constants from Table 8 and using nuclear spin statistical weights (middle trace) and simulations without these weights (lower trace). The lower panel displays an enlarged part of the upper panel. Even for congested lines the effects of nuclear spin statistical weights are visible, confirming the assignments. This complete set of ground state rotational parameters (Table 8) plays an important role in the subsequent analysis of the dense rovibrational spectra in the preliminary assignment stage, especially when the upper state is perturbed.
| Theory (MP2/cc-pVTZ), t.w. | Expt. t.w.a | |
|---|---|---|
| a Equilibrium rotational constants (Ae, Be, Ce) from vibrational perturbation theory (t.w.) and experimental ground state rotational constants (A0, B0, C0) from our present GHz and FTIR experiments. (t.w.) (“semi-experimental” values). b This work including the lines of ref. 75. | ||
| A e/cm−1 | 0.111061 | 0.111544a |
| B e/cm−1 | 0.103524 | 0.103980a |
| C e/cm−1 | 0.058925 | 0.058852a |
| Ground state75 | t.w. ground stateb | |
|---|---|---|
| A 0/cm−1 | 0.1109554 (6) | 0.110955440 (2) |
| B 0/cm−1 | 0.1034997 (6) | 0.103499682 (2) |
| C 0/cm−1 | 0.05857394 (2) | 0.058573904 (1) |
| Δ J /10−6 cm−1 | 0.0007 (2) | 0.010663 (3) |
| Δ JK /10−6 cm−1 | 0.0037 (7) | 0.013592 (9) |
| Δ K /10−6 cm−1 | −0.002 (1) | −0.005986 (5) |
| δ J /10−6cm−1 | 0.0002 (1) | 0.002249 (1) |
| δ K /10−6 cm−1 | 0.00023 (3) | 0.015793 (1) |
| N | 15 | 560+15 |
| d rms/cm−1 | 0.0000001 | 0.0000002 |
| J max for fit | 6 | 50 |
| J max assigned | 6 | 50 |
K
a![[thin space (1/6-em)]](https://www.rsc.org/images/entities/char_2009.gif) max max
|
3 | 19 |
K
c![[thin space (1/6-em)]](https://www.rsc.org/images/entities/char_2009.gif) max max
|
5 | 39 |
5.2 Rovibrational analysis and parameters of the ν22 band of 1,2-dithiine
According to the calculated transition moments μb = −1.33 × 10⁻³ D and μc = −2.20 × 10⁻³ D the b-type absorption lines are predicted to have less than 40% of the strength of the corresponding c-type transitions. Around 1500 b-type transitions and around 4000 c-type transitions have been used in the adjustment. However, most of these b-type transitions, as already mentioned, are from non-split c-type and b-type transitions for Kc ≤ 11 (around 1480 lines). Pure b-type transitions (around 20) have been assigned and used near the center of the Q branch region. At higher J levels the b-type transitions are too weak to be detected. Pure c-type transitions (around 2500) have been assigned in the entire spectrum. In general, b- and c-type transitions up to J ≤ 78, Ka ≤ 73 and Kc ≤ 34 were used for the fit of the spectroscopic constants. Global perturbations were observed, perhaps through interactions with the 2ν23 state or 3ν24 state or possibly also a combination with ν13 and even ν12. The “polyad” between 600 and 700 cm−1 comprises 8 levels. The constants of the ground state have been held fixed to the values in Table 8 and the constants of the ν22 have been adjusted using the least squares analysis. Due to the interactions some of the sextic constants could be determined for ν22 as Table 9 shows, although the corresponding spectroscopic parameters have an effective meaning only. Around 4000 transitions were used in the fit with a drms = 0.00026 cm−1.| ν 17 | ν 22 | ν 3 | |
|---|---|---|---|
![[small nu, Greek, tilde]](https://www.rsc.org/images/entities/i_char_e0e1.gif) 0
0
|
1308.87327 (38) | 623.093915 (25) | 1544.900370 (51) |
| A | 0.1110980 (30) | 0.110782038 (46) | 0.1110040 (57) |
| B | 0.1033660 (24) | 0.103339231 (78) | 0.1032180 (47) |
| C | 0.05857310 (19) | 0.05848408 (11) | 0.05849980 (16) |
| Δ J /10−6 | 0.000690 (20) | −0.0081798 (81) | 0.00910 (12) |
| Δ JK /10−6 | 0.001400 (92) | 0.03133 (31) | 0.0090 (11) |
| Δ K /10−6 | −0.0005986 | −0.01207 (24) | −0.0130 (27) |
| δ J /10−6 | 0.0002249 | −0.002719 (40) | 0.0002248 |
| δ K /10−6 | 0.0015793 | 0.01488 (12) | 0.0015792 |
| Φ J /10−12 | — | −1.181 (14) | — |
| Φ JK /10−12 | — | 1.410 (44) | — |
| Φ K /10−12 | — | −0.492 (30) | — |
| ϕ J /10−12 | — | −0.4683 (57) | — |
| ϕ JK /10−12 | — | 0.218 (15) | — |
| ϕ K /10−12 | — | −0.421 (19) | — |
| N | 1006 | 4056 | 875 |
| d rms/cm−1 | 0.000137 | 0.00026 | 0.00025 |
| J max for fit | 32 | 78 | 40 |
| J max assigned | 32 | 78 | 40 |
K
a![[thin space (1/6-em)]](https://www.rsc.org/images/entities/char_2009.gif) max max
|
12 | 73 | 10 |
K
c![[thin space (1/6-em)]](https://www.rsc.org/images/entities/char_2009.gif) max max
|
30 | 33 | 40 |
A comparison of the measured spectrum with the simulated spectrum calculated using the parameters listed in Tables 8 and 9 is shown in Fig. 11 and 12 for the R and Q branch regions. The upper panel of Fig. 11 shows the complete ν22 fundamental (upper trace) and a simulation (lower trace). The lower panel of Fig. 11 is an enlarged region of the measured R branch lines (upper trace). The lower traces show simulations with and without nuclear spin statistical weights. As the simulation illustrates the intensity effect due to nuclear spin statistical weights is not visible in this part of the spectrum. The agreement between the measured and the simulated spectra is of comparable quality in both cases. Differences are due to numerous hot band lines not shown in the simulation and the relatively high noise level in the experiment.
Only 20% of the molecules are in the ground state at 295 K, while 80% molecules generate hot bands. The Q branch region in Fig. 12 (upper trace) illustrates numerous hot bands. The determination of the band center is only possible through the use of a Loomis–Wood assignment program. The other two panels display an enlargement of the Q branch region. As one can see in the third panel there is a remarkably good agreement between the simulation and the experimental spectrum, considering the important hot band contributions. A partial rovibrational analysis was possible for one of the hot bands.
5.3 Rovibrational analysis and parameters of the ν17 band of 1,2-dithiine
As the ab initio calculations shown in Table 2 suggest, the ν17 band is of B symmetry which permits both b- and c-type transitions with an intensity ratio of approximately 8![[thin space (1/6-em)]](https://www.rsc.org/images/entities/char_2009.gif) :
:![[thin space (1/6-em)]](https://www.rsc.org/images/entities/char_2009.gif) 1 according to the calculations. A total of 1006 transitions obeying b-type selection rules (eo–oe and ee–oo) were assigned and analysed in a least squares adjustment varying only the three rotational constants and five centrifugal distortion constants of ν17 with a drms = 0.00014 cm−1 but fixing the parameters for ΔK, δk and δj to the ground state values. Although perturbations have been encountered from J = 32 onwards, there is good agreement between the simulated spectrum based on the parameters shown in Table 9 and the observed spectra as shown in Fig. 13. Only unperturbed lines up to J ≤ 32 have been used in the least squares adjustment. However, the assignment of the perturbed lines above J > 32 has been checked by ground state combination differences calculated from the perturbed P and R branch lines of ν17.
1 according to the calculations. A total of 1006 transitions obeying b-type selection rules (eo–oe and ee–oo) were assigned and analysed in a least squares adjustment varying only the three rotational constants and five centrifugal distortion constants of ν17 with a drms = 0.00014 cm−1 but fixing the parameters for ΔK, δk and δj to the ground state values. Although perturbations have been encountered from J = 32 onwards, there is good agreement between the simulated spectrum based on the parameters shown in Table 9 and the observed spectra as shown in Fig. 13. Only unperturbed lines up to J ≤ 32 have been used in the least squares adjustment. However, the assignment of the perturbed lines above J > 32 has been checked by ground state combination differences calculated from the perturbed P and R branch lines of ν17.
The strong Q branch as shown in Fig. 13 with a calculated |μb/μc| = 2.8 is due to c-type transitions according to the prediction. However, the Q branch region is more complicated due to numerous hot bands. It was not possible to identify single c-type transitions because of the strong congestion of lines which is in agreement with the predicted transitions. Some of the hot band lines can be grouped into series using the Loomis–Wood diagram, however an adjustment of the spectroscopic parameters is not yet possible. Considering a possible assignment of the band observed at 1308.9 cm−1 to ν4 predicted at 1350 cm−1 by the ab initio calculations reported in Table 2, we have also conducted an analysis using a-type selection rules in the assignment. While this assignment gives a satisfactory fit as well, the shape of the Q branch in the simulation is much broader and differs significantly from the experimental shape. Therefore the assignment as ν17 seems to be well justified. As in the case of ν22, our data are insufficient to make use of nuclear spin statistical weights in the assignment of ν17. We have also tested fits with a variation of ΔK (and also other parameters) being systematically fixed at a series of values. The conclusion from these tests is that the shape of the Q branch can be best simulated if all quartic constants are fixed at the values of the quartic constants of the ground state. However, this fixing leads to slightly larger drms = 0.0005 cm−1 which is still below the instrumental resolution. Thus the spectroscopic parameters have clearly a meaning as “effective parameters” only which it does, however, not affect our conclusions.
5.4 Rovibrational analysis and parameters of the ν3 band of 1,2-dithiine
Consistent with A symmetry under C2, 875 transitions from the ν3 band were assigned obeying a-type selection rules eo–ee and oe–oo (Fig. 14). These lines were fit with the variation of one more spectroscopic constant than used for the ν17 band. To minimize the possible effects from the observed perturbation in this band, only transitions with J(max) = 40 (onset of local resonances) were assigned. There is good agreement between the observed and simulated spectra in unperturbed regions and the band provides a good example for a totally symmetric fundamental.6 Discussion and conclusions
Designing and selecting molecules towards specific properties for a variety of applications is a well-known task in chemistry.133,134 The theoretical selection and spectroscopic characterization of a chiral molecule suitable for the measurement of the parity violating energy difference ΔpvE between the enantiomers by the method proposed by us three decades ago52 is a new, very great challenge, given the current technical possibilities.70 The present work contributes some major results towards this goal, both theoretical and spectroscopic, for the moderately complex molecule 1,2-dithiine.From the theoretical point of view, we have shown that in the ground and low energy rovibrational states parity violation clearly dominates over tunneling in the quantum dynamics of 1,2-dithiine by many orders of magnitude. Thus the reaction enthalpy ΔpvH0 for the stereomutation reaction (1) is, in principle, a measurable quantity for 1,2-dithiine, similar to the simpler molecule dichlorodisulfane (Cl–SS–Cl) which we had studied before,71 and quite different from the case of disulfane HSSH.72 A detailed study of the conformation dependence of parity violation in 1,2-dithiine, indeed, shows that this is a particularly favorable molecule, as the maximum of the absolute value of the parity violating potential (about 6 × 10⁻¹² (hc) cm−1 corresponding to ΔpvEel(qmax) = 12 × 10−12 (hc) cm−1 in Fig. 4) is found to be close to the equilibrium geometry. The expectation value ΔpvE0 in the vibrational ground state has been calculated approximately by means of the ground state of the lowest quasiadiabatic channel for torsion and differs by less than 10% from the equilibrium value ΔpvEel(qe) = 11.44 × 10⁻¹² (hc) cm−1 (eqn (4)), very close to the maximum value. Again, 1,2-dithiine might be compared to ClSSCl in this respect where the predicted ΔpvE0 is smaller by a factor of about 8 (1.35 × 10⁻¹² (hc) cm−1![[thin space (1/6-em)]](https://www.rsc.org/images/entities/char_2009.gif) 71), because of the relatively unfavorable position of the equilibrium geometry, far removed from the position of the maximum in the parity violating potential as a function of torsional angle with ΔpvEel(qmax) ≈ 12 × 10−12 (hc) cm−1, which is actually quite similar to the maximum value in 1,2-dithiine. Also in our recent study of ΔpvE in trisulfane, the predicted ΔpvE0 = 1.6 × 10⁻¹² (hc) cm−1 is found to be much smaller than the maximum value as a function of the torsional (stereomutation reaction) coordinate (ΔpvEel(qmax) = 8.2 × 10⁻¹² (hc) cm−1). Another, even less favorable example of this kind, which we encountered in the past, is 1,3-difluoroallene which in many other spectroscopic aspects is quite easily accessible.76
71), because of the relatively unfavorable position of the equilibrium geometry, far removed from the position of the maximum in the parity violating potential as a function of torsional angle with ΔpvEel(qmax) ≈ 12 × 10−12 (hc) cm−1, which is actually quite similar to the maximum value in 1,2-dithiine. Also in our recent study of ΔpvE in trisulfane, the predicted ΔpvE0 = 1.6 × 10⁻¹² (hc) cm−1 is found to be much smaller than the maximum value as a function of the torsional (stereomutation reaction) coordinate (ΔpvEel(qmax) = 8.2 × 10⁻¹² (hc) cm−1). Another, even less favorable example of this kind, which we encountered in the past, is 1,3-difluoroallene which in many other spectroscopic aspects is quite easily accessible.76
Our theoretical results also provide further evidence that simple scaling laws, as repeatedly discussed since the early theoretical work of Bouchiat and Bouchiat62,63 for atoms (with parity violating effects increasing with about the third power of the atomic number Z), are of limited significance in predicting parity violation in molecules. Many earlier discussions have pointed out that an approximate scaling with Z5 can be derived for parity violation in molecules31,35,37,61,83 with the implicit assumption that the number of neutrons in a typical nucleus is proportional to Z as well. However, the strong dependence of molecular parity violation upon conformation can easily change the effects by an order of magnitude and more, as seen from the examples given above. Examples are known, where a conformation change in a substituent without changing the stereomutation coordinate can even change the sign of the parity violating potential without changing the enantiomeric nature.33,35,135 Indeed, in strong contrast to atomic parity violation the molecular parity violation is characterized by a complicated (3N − 6)-dimensional effective parity violating potential hypersurface to be added to the ordinary parity conserving potential hypersurface as a perturbation of different symmetry,9,61 and our results of 1,2-dithiine in relation to other molecules studied demonstrate the complicated consequences of this. It has been pointed out61 that a Zn scaling might be applied to a series of homologous molecules either at their individual equilibrium geometries or at identical (non-equilibrium) geometries or else at geometries related to the maximum absolute values of |ΔpvEel| of the different molecules, with quite different results in each case. As an alternative to the effective parity violating potential one might also consider the tensor components of the parity violating potential61 or values corresponding to the main chiral axes36 in relation to a Zn scaling. In practice, simple rules including Zn-scaling and geometrical factors might be derived as the first selection criteria,48 but in the end, for individual molecules to be selected for the very demanding experiments, quantitative calculations as carried out here for 1,2-dithiine including the conformation dependence and tunneling processes are required. In this respect, 1,2-dithiine turns out to be quite a favorable candidate for experiments.
Tunneling in the ground state has been shown in the present work to be completely suppressed for 1,2-dithiine with
| ΔE± < 10−24 (hc) cm−1 ≪ ΔEpv ≃ 10−11 (hc) cm−1 | (6) |
We have shown here that high resolution analyses are possible in the infrared range for 1,2-dithiine, with three strong fundamentals ν22 at 623.094 cm−1, ν3 at 1544.900 cm−1 and ν17 at 1308.873 cm−1. The latter band might be used as a starting point for a stepwise two-photon excitation to the 2ν17 range at 2600 cm−1, where tunneling can be important, if couplings to tunneling sublevels of well-defined parity can be identified. In the future also high resolution analyses of the 2ν17 absorptions or the CH stretching polyad at around 3000 cm−1 can become possible. Indeed, the overtone of the fundamental ν3 studied here is predicted to show a strong Fermi-resonance with the CH-stretching fundamentals using our ab initio calculations. In all cases a major remaining challenge will be the analysis of rovibrational couplings to tunneling sublevels of well-defined parity. Some first evidence for rovibrational couplings has been seen in the present analysis of ν17. At higher energies intramolecular rovibrational couplings are very likely,119 given the high density of vibrational states, which is about 50 states per cm−1 interval at 2600 cm−1 and 1300 states per cm−1 interval at around 3000 cm−1. The corresponding spectroscopic analyses of the resulting complex spectra can be successful, however, with existing high resolution infrared laser spectroscopy of molecular beams, achieving even hyperfine resolution in excited vibrational states of ammonia, for example, (i.e. Δν < 1 MHz around ν = 100 THz or Δ![[small nu, Greek, tilde]](https://www.rsc.org/images/entities/i_char_e0e1.gif) < 0.00003 cm−1 at
< 0.00003 cm−1 at ![[small nu, Greek, tilde]](https://www.rsc.org/images/entities/i_char_e0e1.gif) = 3300 cm−1
= 3300 cm−1![[thin space (1/6-em)]](https://www.rsc.org/images/entities/char_2009.gif) 70). Double resonance with IR-lasers70 and GHz spectroscopy103 can also be helpful in this context. We have furthermore carried out extensive calculations on various deuterated isotopomers of 1,2-dithiine, where the CD infrared chromophore makes the wavenumber range just above the tunneling switching range accessible. These results are presented in the ESI† as well. The study of the lowest frequency fundamentals by synchrotron-based THz (FTIR) spectroscopy is in progress.
70). Double resonance with IR-lasers70 and GHz spectroscopy103 can also be helpful in this context. We have furthermore carried out extensive calculations on various deuterated isotopomers of 1,2-dithiine, where the CD infrared chromophore makes the wavenumber range just above the tunneling switching range accessible. These results are presented in the ESI† as well. The study of the lowest frequency fundamentals by synchrotron-based THz (FTIR) spectroscopy is in progress.
The present work thus clearly opens the route towards successful spectroscopic experiments to measure the parity violating energy difference ΔpvE in 1,2-dithiine with a rather short time τpv = 1.5 s for complete parity change in this molecule; the initial time evolution in the ms range would be clearly detectable by the now available techniques.70 While a simpler molecule with fewer atoms would certainly still be desirable to complete the necessary spectroscopic groundwork, 1,2-dithiine has the advantage of a relatively rigid structure apart from the simple spin 1/2 protons with only the rather light C and S nuclei with zero spin, a simple nuclear structure, which is almost ideal for highly accurate theoretical analyses in terms of fundamental parameters of the standard model of particle physics from experimental results, once available.9
Acknowledgements
Our work is financially supported by an advanced grant from the ERC, the Schweizerischer Nationalfonds and the ETH Zürich. The research leading to these results had in particular also received funding from the European Union's Seventh Framework Programme (FP7/2007–20013) ERC grant agreement no. 290925. Very substantial help from Guido Grassi and Fabienne Arn in the synthesis work is gratefully acknowledged. We also acknowledge the help from and enjoyed the discussion with Andreas Schneider and Andres Laso and also support from the COST project MOLIM.References
- J. H. van't Hoff, La chimie dans l'espace, P. M. Bazendijk, Rotterdam, 1887, reprinted with commentary in Search PubMed ref. 2 .
- C. Bourgois, Louis Pasteur, J. H. van't Hoff, A. Werner: sur la dissymétrie moléculaire, Collection Epistème, Dôle, France, 1986 Search PubMed.
- J. H. van't Hoff, Vorlesungen über theoretische und physikalische Chemie, Heft 2. Die chemische Statik, Vieweg, Braunschweig, 1899 Search PubMed.
- E. Fischer, Ber. Dtsch. Chem. Ges., 1894, 27, 2985–2993 CrossRef CAS.
- V. Prelog, Chirality in Chemistry, in Les prix Nobel 1975, Nobel Lectures, Elsevier, New York, ch. Chemistry, 1971–1980, pp. 203–216 (the Nobel Foundation 1975) Search PubMed.
- M. Quack, Eur. Rev., 2014, 22, S50–S86 CrossRef.
- F. Hund, Z. Phys., 1927, 43, 805–826 CrossRef CAS.
- F. Merkt and M. Quack, Molecular Quantum Mechanics and Molecular Spectra, Molecular Symmetry, and Interaction of Matter with Radiation, Handbook of High-Resolution Spectroscopy, John Wiley & Sons, Ltd, Chichester, 2011, ch. 1, vol. 1, pp. 1–55 Search PubMed.
- M. Quack, Fundamental Symmetries and Symmetry Violations from High Resolution Spectroscopy, Handbook of High Resolution Spectroscopy, John Wiley & Sons, Ltd, Chichester, New York, 2011, ch. 18, vol. 1, pp. 659–722 Search PubMed.
- M. Quack, Angew. Chem., Int. Ed. Engl., 1989, 28, 571–586 CrossRef.
- T. Lee and C. Yang, Phys. Rev., 1956, 104, 254–258 CrossRef CAS.
- C. Wu, E. Ambler, R. Hayward, D. Hoppes and R. Hudson, Phys. Rev., 1957, 105, 1413–1415 CrossRef CAS.
- J. I. Friedman and V. L. Telegdi, Phys. Rev., 1957, 105, 1681–1682 CrossRef CAS.
- R. L. Garwin, L. M. Lederman and M. Weinrich, Phys. Rev., 1957, 105, 1415–1417 CrossRef CAS.
- H. Schopper, Philos. Mag., 1957, 2, 710–713 CrossRef CAS.
- H. Schopper, Naturwissenschaften, 1958, 45, 453–456 CrossRef CAS.
- S. L. Glashow, Nucl. Phys., 1961, 22, 579–588 CrossRef.
- S. Weinberg, Phys. Rev. Lett., 1967, 19, 1264–1266 CrossRef.
- A. Salam, in Weak and electromagnetic interactions, ed. N. Svartholm, Almkvist & Wiksell, Stockholm, 1968, pp. 367–377 Search PubMed.
- M. J. G. Veltman, Rev. Mod. Phys., 2000, 72, 341–349 CrossRef.
- G. 't Hooft, Rev. Mod. Phys., 2000, 72, 333–339 CrossRef.
- Y. Yamagata, J. Theor. Biol., 1966, 11, 495–498 CrossRef CAS PubMed.
- D. W. Rein, J. Mol. Evol., 1974, 4, 15–22 CrossRef CAS PubMed.
- S. F. Mason, Chemical Evolution: Origin of the Elements, Molecules, and Living Systems, Clarendon Press, Oxford, 1991 Search PubMed.
- P. Frank, W. Bonner and R. N. Zare, in On the one hand but not on the other: the challenge of the origin and survival of homochirality in prebiotic chemistry, ed. E. Keinan and I. Schechter, Wiley-VCH, Weinheim, 2001, book section 11, pp. 175–208 Search PubMed.
- M. Quack, Angew. Chem., Int. Ed., 2002, 41, 4618–4630 CrossRef CAS PubMed.
- M. Quack, Chimia, 2003, 57, 147–160 CrossRef CAS.
- J. Jortner, Philos. Trans. R. Soc. London, Ser. B, 2006, 361, 1877–1891 CrossRef CAS PubMed.
- M. Quack, Adv. Chem. Phys., 2014, 157, 249–290 Search PubMed.
- V. S. Letokhov, Phys. Lett. A, 1975, 53, 275–276 CrossRef.
- R. A. Hegström, D. W. Rein and P. G. H. Sandars, J. Chem. Phys., 1980, 73, 2329–2341 CrossRef.
- S. F. Mason and G. E. Tranter, Mol. Phys., 1984, 53, 1091–1111 CrossRef CAS.
- A. Bakasov, T.-K. Ha and M. Quack, Proc. of the 4th Trieste Conference (1995), Chemical Evolution: Physics of the Origin and Evolution of Life, ed. J. Chela Flores and F. Rolin, Kluwer, Dordrecht, 1996, pp. 287–296.
- P. Lazzeretti and R. Zanasi, Chem. Phys. Lett., 1997, 279, 349–354 CrossRef CAS.
- A. Bakasov, T. K. Ha and M. Quack, J. Chem. Phys., 1998, 109, 7263–7285 CrossRef CAS.
- A. Bakasov and M. Quack, Chem. Phys. Lett., 1999, 303, 547–557 CrossRef CAS.
- J. K. Laerdahl and P. Schwerdtfeger, Phys. Rev. A: At., Mol., Opt. Phys., 1999, 60, 4439–4453 CrossRef CAS.
- R. Berger and M. Quack, J. Chem. Phys., 2000, 112, 3148–3158 CrossRef CAS.
- M. Quack and J. Stohner, Phys. Rev. Lett., 2000, 84, 3807–3810 CrossRef CAS PubMed.
- J. K. Laerdahl, P. Schwerdtfeger and H. M. Quiney, Phys. Rev. Lett., 2000, 84, 3811–3814 CrossRef CAS PubMed.
- M. Quack and J. Stohner, Z. Phys. Chem., 2000, 214, 675–703 CrossRef CAS.
- M. Quack and J. Stohner, J. Chem. Phys., 2003, 119, 11228–11240 CrossRef CAS.
- A. C. Hennum, T. Helgaker and W. Klopper, Chem. Phys. Lett., 2002, 354, 274–282 CrossRef CAS.
- L. Horný and M. Quack, Mol. Phys., 2015, 113, 1768–1779 CrossRef.
- M. Quack and J. Stohner, Chirality, 2001, 13, 745–753 CrossRef CAS PubMed.
- R. Berger, in Parity-violation effects in molecules, in Relativistic Electronic Structure Theory, ed. P. Schwerdtfeger, Elsevier, Amsterdam, 2004, part 2, book section 4, pp. 188–288 Search PubMed.
- M. Quack and J. Stohner, Chimia, 2005, 59, 530–538 CrossRef CAS.
- M. Quack, J. Stohner and M. Willeke, Annu. Rev. Phys. Chem., 2008, 59, 741–769 CrossRef CAS PubMed.
- O. N. Kompanets, A. R. Kukudzhanov, V. S. Letokhov and L. L. Gervits, Opt. Commun., 1976, 19, 414–416 CrossRef CAS.
- E. Arimondo, P. Glorieux and T. Oka, Opt. Commun., 1977, 23, 369–372 CrossRef CAS.
- R. A. Harris and L. Stodolsky, Phys. Lett. B, 1978, 78, 313–317 CrossRef.
- M. Quack, Chem. Phys. Lett., 1986, 132, 147–153 CrossRef CAS.
- M. J. M. Pepper, I. Shavitt, P. v. Ragué Schleyer, M. N. Glukhovtsev, R. Janoschek and M. Quack, J. Comput. Chem., 1995, 16, 207–225 CrossRef CAS.
- B. Darquié, C. Stoeffler, A. Shelkovnikov, C. Daussy, A. Amy-Klein, C. Chardonnet, S. Zrig, L. Guy, J. Crassous, P. Soulard, P. Asselin, T. R. Huet, P. Schwerdtfeger, R. Bast and T. Saue, Chirality, 2010, 22, 870–884 CrossRef PubMed.
- M. Quack, Faraday Discuss., 2011, 150, 533–565 RSC.
- M. Quack, Faraday Discuss., 2011, 150, 123–127 RSC.
- A. Bauder, A. Beil, D. Luckhaus, F. Müller and M. Quack, J. Chem. Phys., 1997, 106, 7558–7570 CrossRef CAS.
- C. Daussy, T. Marrel, A. Amy-Klein, C. T. Nguyen, C. J. Bordé and C. Chardonnet, Phys. Rev. Lett., 1999, 83, 1554–1557 CrossRef CAS.
- M. Schnell and J. Küpper, Faraday Discuss., 2011, 150, 1–17 RSC.
- S. K. Tokunaga, C. Stoeffler, F. Auguste, A. Shelkovnikov, C. Daussy, A. Amy-Klein, C. Chardonnet and B. Darquié, Mol. Phys., 2013, 111, 2363–2373 CrossRef CAS.
- A. Bakasov, R. Berger, T.-K. Ha and M. Quack, Int. J. Quantum Chem., 2004, 98, 393–407 CrossRef.
- M. A. Bouchiat and C. Bouchiat, J. Phys., 1974, 35, 899–927 CAS.
- M. A. Bouchiat and C. Bouchiat, J. Phys., 1975, 36, 493–509 CAS.
- R. Conti, P. Bucksbaum, S. Chu, E. Commins and L. Hunter, Phys. Rev. Lett., 1979, 42, 343–346 CrossRef CAS.
- S. C. Bennett and C. E. Wieman, Phys. Rev. Lett., 1999, 82, 2484–2487 CrossRef CAS.
- V. M. Shabaev, K. Pachucki, I. Tupitsyn and V. A. Yerokhin, Phys. Rev. Lett., 2005, 94, 213002 CrossRef CAS PubMed.
- K. Tsigutkin, D. Dounas-Frazer, A. Family, J. E. Stalnaker, V. V. Yashchuk and D. Budker, Phys. Rev. Lett., 2009, 103, 071 CrossRef PubMed.
- R. Prentner, M. Quack, J. Stohner and M. Willeke, J. Phys. Chem. A, 2015, 119, 12805–12822 CrossRef CAS PubMed.
- M. Quack and M. Willeke, J. Phys. Chem. A, 2006, 110, 3338–3348 CrossRef CAS PubMed.
- P. Dietiker, E. Miloglyadov, M. Quack, A. Schneider and G. Seyfang, J. Chem. Phys., 2015, 143, 244305 CrossRef CAS PubMed.
- R. Berger, M. Gottselig, M. Quack and M. Willeke, Angew. Chem., Int. Ed., 2001, 40, 4195–4198 CrossRef CAS.
- M. Gottselig, D. Luckhaus, M. Quack, J. Stohner and M. Willeke, Helv. Chim. Acta, 2001, 84, 1846–1861 CrossRef CAS.
- M. J. Frisch, G. W. Trucks, H. B. Schlegel, G. E. Scuseria, M. A. Robb, J. R. Cheeseman, G. Scalmani, V. Barone, B. Mennucci, G. A. Petersson, H. Nakatsuji, M. Caricato, X. Li, H. P. Hratchian, A. F. Izmaylov, J. Bloino, G. Zheng, J. L. Sonnenberg, M. Hada, M. Ehara, K. Toyota, R. Fukuda, J. Hasegawa, M. Ishida, T. Nakajima, Y. Honda, O. Kitao, H. Nakai, T. Vreven, J. A. Montgomery, Jr., J. E. Peralta, F. Ogliaro, M. Bearpark, J. J. Heyd, E. Brothers, K. N. Kudin, V. N. Staroverov, R. Kobayashi, J. Normand, K. Raghavachari, A. Rendell, J. C. Burant, S. S. Iyengar, J. Tomasi, M. Cossi, N. Rega, J. M. Millam, M. Klene, J. E. Knox, J. B. Cross, V. Bakken, C. Adamo, J. Jaramillo, R. Gomperts, R. E. Stratmann, O. Yazyev, A. J. Austin, R. Cammi, C. Pomelli, J. W. Ochterski, R. L. Martin, K. Morokuma, V. G. Zakrzewski, G. A. Voth, P. Salvador, J. J. Dannenberg, S. Dapprich, A. D. Daniels, Ö. Farkas, J. B. Foresman, J. V. Ortiz, J. Cioslowski and D. J. Fox, Gaussian 09 Revision E.01, Gaussian Inc., Wallingford, CT, 2009 Search PubMed.
- H.-J. Werner, P. J. Knowles, G. Knizia, F. R. Manby and M. Schütz, Wiley Interdiscip. Rev.: Comput. Mol. Sci., 2012, 2, 242–253 CrossRef CAS.
- J. Z. Gillies, C. W. Gillies, E. A. Cotter, E. Block and R. DeOrazio, J. Mol. Spectrosc., 1996, 180, 139–144 CrossRef CAS.
- M. Gottselig and M. Quack, J. Chem. Phys., 2005, 123, 084305 CrossRef PubMed.
- W. Schroth, F. Billig and H. Langguth, Z. Chem., 1965, 5, 353–354 CrossRef CAS.
- W. Schroth, F. Billig and G. Reinhold, Angew. Chem., Int. Ed., 1967, 6, 698–699 CrossRef CAS.
- F. Bohlmann and K.-M. Kleine, Chem. Ber., 1965, 98, 3081–3086 CrossRef CAS.
- J. T. Mortensen, J. S. Sørensen and N. A. Sørensen, Acta Chem. Scand., 1965, 18, 2392–2394 CrossRef.
- E. Block, M. Birringer, R. DeOrazio, J. Fabian, R. S. Glass, C. Guo, C. He, E. Lorance, Q. Qian, T. B. Schroeder, Z. Shan, M. Thiruvazhi, G. S. Wilson and X. Zhang, J. Am. Chem. Soc., 2000, 122, 5052–5064 CrossRef CAS.
- E. Block, Phosphorus, Sulfur Silicon Relat. Elem., 1999, 153, 173–192 CrossRef.
- S. Pelloni, F. Faglioni and P. Lazzeretti, Mol. Phys., 2013, 111, 2387–2391 CrossRef CAS.
- S. Pelloni, F. Faglioni, A. Soncini, A. Ligabue and P. Lazzeretti, Chem. Phys. Lett., 2003, 375, 583–590 CrossRef CAS.
- A. Soncini, F. Faglioni and P. Lazzeretti, Phys. Rev. A: At., Mol., Opt. Phys., 2003, 68, 033402 CrossRef.
- J. Fabian and P. Birner, Collect. Czech. Chem. Commun., 1988, 53, 2096–2115 CrossRef CAS.
- R. S. Glass, N. E. Gruhn, D. L. Lichtenberger, E. Lorance, J. R. Pollard, M. Birringer, E. Block, R. DeOrazio, C. He, Z. Shan and X. Zhang, J. Am. Chem. Soc., 2000, 122, 5065–5074 CrossRef CAS.
- J. V. Ortiz, J. Phys. Chem. A, 2002, 106, 5924–5927 CrossRef CAS.
- J. Fabian, M. Mann and M. Petiau, Molecular Modeling Annual, 2000, 6, 177–185 CrossRef CAS.
- C. Fábri, L. Horný and M. Quack, ChemPhysChem, 2015, 16, 3584–3589 CrossRef PubMed.
- S. Albert, K. Keppler, P. Lerch, M. Quack and A. Wokaun, J. Mol. Spectrosc., 2015, 315, 92–101 CrossRef CAS.
- S. Albert, I. Bolotova, Z. Chen, C. Fábri, L. Horný, M. Quack, G. Seyfang and D. Zindel, Chimia, 2015, Proceedings of the Swiss Chemical Society Fall meeting 2015, 69, PC105.
- S. Albert, I. Bolotova, Z. Chen, C. Fábri, L. Horný, M. Quack, G. Seyfang and D. Zindel, Proceedings of QAMTS 2015, Beatenberg, Switzerland, 2015, P. 10 Search PubMed.
- S. Albert, I. Bolotova, Z. Chen, C. Fábri, L. Horný, M. Quack, G. Seyfang and D. Zindel, Proceedings of the 20th Symposium on Atomic, Cluster and Surface Physics (SASP 2016), Davos, Switzerland, February 7–12, 2016, Innsbruck, 2016, pp. 127–130, ISBN: 978-3-903122-04-8.
- H.-J. Werner, P. J. Knowles, G. Knizia, F. R. Manby and M. Schütz, Wiley Interdiscip. Rev.: Comput. Mol. Sci., 2012, 2, 242–253 CrossRef CAS.
- H.-J. Werner, P. J. Knowles, G. Knizia, F. R. Manby, M. Schütz, P. Celani, T. Korona, R. Lindh, A. Mitrushenkov, G. Rauhut, K. R. Shamasundar, T. B. Adler, R. D. Amos, A. Bernhardsson, A. Berning, D. L. Cooper, M. J. O. Deegan, A. J. Dobbyn, F. Eckert, E. Goll, C. Hampel, A. Hesselmann, G. Hetzer, T. Hrenar, G. Jansen, C. Köppl, Y. Liu, A. W. Lloyd, R. A. Mata, A. J. May, S. J. McNicholas, W. Meyer, M. E. Mura, A. Nicklass, D. P. O'Neill, P. Palmieri, D. Peng, K. Pflüger, R. Pitzer, M. Reiher, T. Shiozaki, H. Stoll, A. J. Stone, R. Tarroni, T. Thorsteinsson and M. Wang, MOLPRO, version 2012.1, a package of ab initio programs, 2012, see http://www.molpro.net Search PubMed.
- L. Horný and M. Quack, Faraday Discuss. Chem. Soc., 2011, 150, 152–154 Search PubMed.
- T. D. Crawford, C. D. Sherrill, E. F. Valeev, J. T. Fermann, R. A. King, M. L. Leininger, S. T. Brown, C. L. Janssen, E. T. Seidl, J. P. Kenny and W. D. Allen, J. Comput. Chem., 2007, 28, 1610–1616 CrossRef CAS PubMed.
- B. Fehrensen, D. Luckhaus and M. Quack, Z. Phys. Chem., 1999, 209, 1–19 CrossRef CAS.
- B. Fehrensen, D. Luckhaus and M. Quack, Chem. Phys. Lett., 1999, 300, 312–320 CrossRef CAS.
- B. Fehrensen, D. Luckhaus and M. Quack, Chem. Phys., 2007, 338, 90–105 CrossRef CAS.
- R. Xu, W. B. Schweizer and H. Frauenrath, Chem. – Eur. J., 2009, 15, 9105–9116 CrossRef CAS PubMed.
- M. Suter and M. Quack, Appl. Opt., 2015, 54, 4417–4431 CrossRef CAS PubMed.
- A. Maki and J. S. Wells, Wavenumber Calibration Tables from Heterodyne Frequency Measurements, NIST Special Publication 821, USA, 1991 Search PubMed.
- L. S. Rothman, I. E. Gordon, A. Barbe, D. C. Benner, P. F. Bernath, M. Birk, V. Boudon, L. R. Brown, A. Campargue, J. P. Champion, K. Chance, L. H. Coudert, V. Dana, V. M. Devi, S. Fally, J. M. Flaud, R. R. Gamache, A. Goldman, D. Jacquemart, I. Kleiner, N. Lacome, W. J. Lafferty, J. Y. Mandin, S. T. Massie, S. N. Mikhailenko, C. E. Miller, N. Moazzen-Ahmadi, O. V. Naumenko, A. V. Nikitin, J. Orphal, V. I. Perevalov, A. Perrin, A. Predoi-Cross, C. P. Rinsland, M. Rotger, M. Šimecková, M. A. H. Smith, K. Sung, S. A. Tashkun, J. Tennyson, R. A. Toth, A. C. Vandaele and J. Vander Auwera, J. Quant. Spectrosc. Radiat. Transfer, 2009, 110, 533–572 CrossRef CAS.
- S. Albert, K. Keppler Albert and M. Quack, Trends Opt. Photonics, 2003, 84, 177–180 CAS.
- S. Albert and M. Quack, ChemPhysChem, 2007, 8, 1271–1281 CrossRef CAS PubMed.
- S. Albert, S. Bauerecker, M. Quack and A. Steinlin, Mol. Phys., 2007, 105, 541–558 CrossRef CAS.
- S. Albert, K. Keppler Albert and M. Quack, High Resolution Fourier Transform Infrared Spectroscopy, Handbook of High Resolution Spectroscopy, John Wiley & Sons, Ltd, 2011, ch. 26, vol. 2, pp. 965–1019 Search PubMed.
- M. Quack, Mol. Phys., 1977, 34, 477–504 CrossRef CAS.
- K. v. Puttkamer and M. Quack, Mol. Phys., 1987, 62, 1047–1064 CrossRef.
- K. v. Puttkamer, M. Quack and M. A. Suhm, Mol. Phys., 1988, 65, 1025–1045 CrossRef.
- E. Riedle, A. Beil, D. Luckhaus and M. Quack, Mol. Phys., 1994, 81, 1–15 CrossRef.
- H. C. Longuet-Higgins, Mol. Phys., 1963, 6, 445–460 CrossRef CAS.
- C. M. Western, PGOPHER, a Program for Simulating Rotational Structure!, University of Bristol Research Data Repository, Bristol, 2014 Search PubMed.
- C. M. Western, Handbook of High-Resolution Spectroscopy, John Wiley &, Ltd, Chichester, 2011, ch. 1, vol. 2, pp. 1415–1435 Search PubMed.
- D. Luckhaus and M. Quack, Mol. Phys., 1989, 68, 745–758 CrossRef CAS.
- B. P. Winnewisser, J. Reinstädtler, K. M. T. Yamada and J. Behrend, J. Mol. Spectrosc., 1989, 136, 12–18 CrossRef CAS.
- S. Albert, K. Keppler Albert, H. Hollenstein, C. Manca Tanner and M. Quack, Fundamentals of Rotation-Vibration Spectra, Handbook of High-Resolution Spectroscopy, John Wiley & Sons, Ltd, Chichester, 2011, ch. 3, vol. 1, pp. 117–173 Search PubMed.
- S. Albert, M. Winnewisser and B. P. Winnewissser, Ber. Bunsenges. Phys. Chem., 1996, 100, 1876–1896 CrossRef CAS.
- S. Albert, M. Winnewisser and B. P. Winnewissser, Microchim. Acta, 1997, 14, 79–88 CAS.
- S. Albert, K. Albert, M. Winnewisser and B. P. Winnewissser, Ber. Bunsenges. Phys. Chem., 1998, 102, 1428–1448 CrossRef CAS.
- S. Albert, H. Hollenstein, M. Quack and M. Willeke, Mol. Phys., 2004, 102, 1671–1686 CrossRef CAS.
- S. Albert, H. Hollenstein, M. Quack and M. Willeke, Mol. Phys., 2006, 104, 2719–2735 CrossRef CAS.
- S. Albert, K. K. Albert and M. Quack, J. Mol. Struct., 2004, 695–696, 385–394 CAS.
- S. Albert and M. Quack, J. Mol. Spectrosc., 2007, 243, 280–291 CrossRef CAS.
- S. Albert, K. Keppler Albert, P. Lerch and M. Quack, Faraday Discuss., 2011, 150, 71–99 RSC.
- S. Albert, P. Lerch and M. Quack, ChemPhysChem, 2013, 14, 3204–3208 CrossRef CAS PubMed.
- S. Albert, P. Lerch, R. Prentner and M. Quack, Angew. Chem., Int. Ed., 2013, 52, 346–349 CrossRef CAS PubMed.
- S. Albert, K. Keppler and M. Quack, Mol. Phys., 2015, 113, 2267–2289 CrossRef CAS.
- J. K. G. Watson, Vibrational Spectra and Structure, Amsterdam, 1978, vol. 6, pp. 1–89 Search PubMed.
- H. M. Pickett, J. Mol. Spectrosc., 1991, 148, 371–377 CrossRef CAS.
- M. Stefko, M. D. Tzirakis, B. Breiten, M.-O. Ebert, O. Dumele, W. B. Schweizer, J.-P. Gisselbrecht, C. Boudon, M. T. Beels, I. Biaggio and F. Diederich, Chem. – Eur. J., 2013, 19, 12693–12704 CrossRef CAS PubMed.
- J. M. Matxain, J. M. Asua and F. Ruiperez, Phys. Chem. Chem. Phys., 2016, 18, 1758–1770 RSC.
- R. Berger and M. Quack, ChemPhysChem, 2000, 1, 57–60 CrossRef CAS PubMed.
Footnote |
| † Electronic supplementary information (ESI) available. See DOI: 10.1039/c6cp01493c |
| This journal is © the Owner Societies 2016 |

